
(T2108 measures the percentage of stocks trading above their respective 40-day moving averages [DMAs]. It helps to identify extremes in market sentiment that are highly likely to reverse. To learn more about it, see my T2108 Resource Page. You can follow real-time T2108 commentary on twitter using the #T2108 hashtag. T2108-related trades and other trades are posted on twitter using the #120trade hashtag)
T2108 Status: 43.7%
VIX Status: 16.6
General (Short-term) Trading Call: Play the wedge breakout (go long)
Active T2108 periods: Day #1 over 40% (underperiod), Day #18 under 70% (underperiod)
Reference Charts (click for view of last 6 months from Stockcharts.com):
S&P 500 or SPY
SDS (ProShares UltraShort S&P500)
U.S. Dollar Index (volatility index)
VIX (volatility index)
VXX (iPath S&P 500 VIX Short-Term Futures ETN)
EWG (iShares MSCI Germany Index Fund)
CAT (Caterpillar)
Commentary
The S&P 500 (SPY) has managed to break out ahead of schedule. In previous posts, I noted that I expected the wedge pattern in the index to breakout or breakdown this week. I thought the Federal Reserve meeting would deliver the catalyst but perhaps market participants are trying to get a head start on Bernanke’s effort to dispel the manufactured panic making the rounds over “bond tapering.”
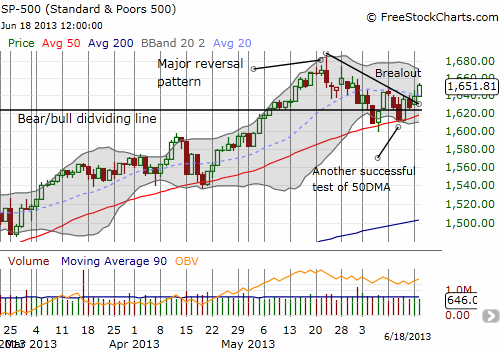
This breakout also ends the short-term downtrend on the S&P 500 formed from the major reversal pattern on May 22nd. With the 50DMA tested successfully once again, the index is printing a very bullish pattern overall. T2108 is 43.7%, so plenty of room exists to the upside for a fresh market rally.
The last piece of the puzzle will be the volatility index, the VIX. Currently, it remains elevated above the key pivot area around 15.2. I am assuming the VIX is only this high because of lingering uncertainty about the Fed’s coming announcement. After some initial churn, I am also assuming the VIX will plunge post-Fed. A close below 15.2 will seal the deal on the bullish short-term outlook for the S&P 500.
In other news, a roundtrip on a Google (GOOG) call option worked again. I did not announce this trade as it is part of some testing. A bullish S&P 500 makes me even more bullish on buying the dips in GOOG.
Daily T2108 vs the S&P 500
")
Black line: T2108 (measured on the right); Green line: S&P 500 (for comparative purposes)
Red line: T2108 Overbought (70%); Blue line: T2108 Oversold (20%)
Weekly T2108

*All charts created using freestockcharts.com unless otherwise stated
Related links:
The T2108 Resource Page
Expanded daily chart of T2108 versus the S&P 500
Expanded weekly chart of T2108
Be careful out there!
Full disclosure: no positions