(T2108 measures the percentage of stocks trading above their respective 40-day moving averages [DMAs]. It helps to identify extremes in market sentiment that are highly likely to reverse. To learn more about it, see my T2108 Resource Page. You can follow real-time T2108 commentary on twitter using the #T2108 hashtag. T2108-related trades and other trades are posted on twitter using the #120trade hashtag)
T2108 Status: 81.8% (overbought day #7)
VIX Status: 14.5
General (Short-term) Trading Call: Hold (extended overbought strategy remains in effect)
Reference Charts (click for view of last 6 months from Stockcharts.com):
S&P 500 or SPY
SDS (ProShares UltraShort S&P500)
U.S. Dollar Index (volatility index)
VIX (volatility index)
VXX (iPath S&P 500 VIX Short-Term Futures ETN)
EWG (iShares MSCI Germany Index Fund)
CAT (Caterpillar)
Commentary
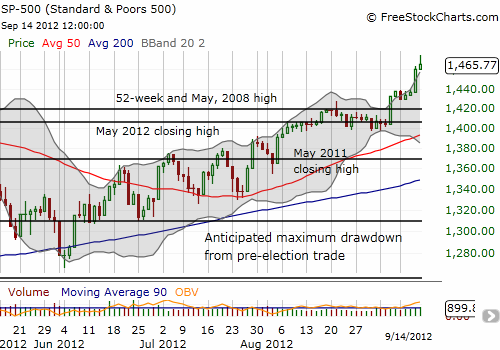
T2108 and the S&P 500 made marginal gains on Friday while the VIX actually popped a healthy 3.3%. It seems volatility “wants” to hold its recent lows, so I am expecting some wide daily trading ranges in the coming week or more. This should be an excellent time for executing the new extended overbought strategy which looks to aggressively buy dips (and sell rips).

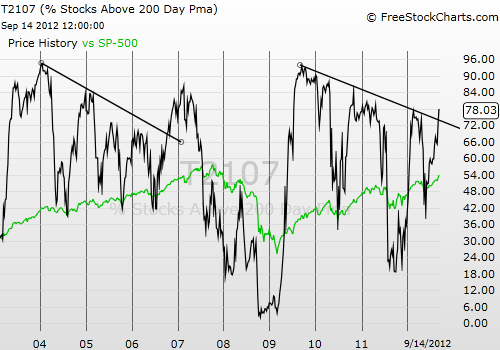
With T2108 the most overbought it has been since February, I realized I should check good ol’ T2107, the percentage of stocks trading above their 200-day moving averages. Not only has T2107 been ripping higher, it is now at its highest point of the year at 78%. This means that you can just about throw darts at stocks and land on winners. The month of September in particular has lifted most boats. Even MORE importantly is that on September 13, T2107 finally broke out from a long-term downtrend established with T2107’s peak soon after the bounce from historic lows in 2009.

The last time such a breakout happened was October 13, 2006. At the time, the housing bubble had clearly peaked but the S&P 500 continued to rally anyway. Today’s equivalent is probably all the poor economic news from China that confirms the growth slowdown. In 2006, the S&P 500 continued to rally through the end of the year, something I expect this year as well. While T2107 peaked for good in early 2007, the S&P 500 managed to continue to rally through the spring, swooned in the summer, and then rallied one last time into Fall for a marginal new high. This behavior suggests that it is now time to monitor T2107 more closely for signs of a bearish divergence between it and the S&P 500. Once I think that has occurred, I will immediately void the new aggressive trading strategy. T2107 then provides an additional stopping rule. Here are the revised set of rules – again using SSO calls:
- Intra-day: Buy dips in the morning and sell on next rally.
- Market close: Buy weak closes with target to hold position for 1-3 days.
- Rallies in general: sell rallies but do NOT fade them.
- Stops: The bullish strategy ends on whatever comes first: T2108 drops below 70% (no longer overbought), the S&P 500 makes a lower low, OR T2107 “stalls” while the S&P 500 continues to rally (a bearish divergence).
A large difference between now and then is monetary policy. Now, monetary policy continues to get more accomodative as today’s bull market is not sharing the wealth nearly as well as the prior one. So, I have to expect the current rally to have longer legs. In other words, I am not going to maintain a strict interpretation of a “bearish divergence” between T2107 and the S&P 500. I hate to mix the technical signals with the fundamental context, but having a Federal Reserve print money in regular quantities every month for an indefinite period is too powerful a drug to ignore!
Daily T2108 vs the S&P 500
Click chart for extended view with S&P 500 fully scaled vertically (updated at least once a week)

Black line: T2108 (measured on the right); Green line: S&P 500 (for comparative purposes)
Weekly T2108

*All charts created using freestockcharts.com unless otherwise stated
Related links:
The T2108 Resource Page
Expanded daily chart of T2108 versus the S&P 500
Expanded weekly chart of T2108
Be careful out there!
Full disclosure: long VXX shares, short VXX calls
