(T2108 measures the percentage of stocks trading above their respective 40-day moving averages [DMAs]. It helps to identify extremes in market sentiment that are highly likely to reverse. To learn more about it, see my T2108 Resource Page. You can follow real-time T2108 commentary on twitter using the #T2108 hashtag. T2108-related trades and other trades are posted on twitter using the #120trade hashtag)
T2108 Status: 78.1% (overbought day #2)
VIX Status: 14.4
General (Short-term) Trading Call: Hold (reduce bearish hedges, buy the dips).
Reference Charts (click for view of last 6 months from Stockcharts.com):
S&P 500 or SPY
SDS (ProShares UltraShort S&P500)
U.S. Dollar Index (volatility index)
VIX (volatility index)
VXX (iPath S&P 500 VIX Short-Term Futures ETN)
EWG (iShares MSCI Germany Index Fund)
CAT (Caterpillar)
Commentary
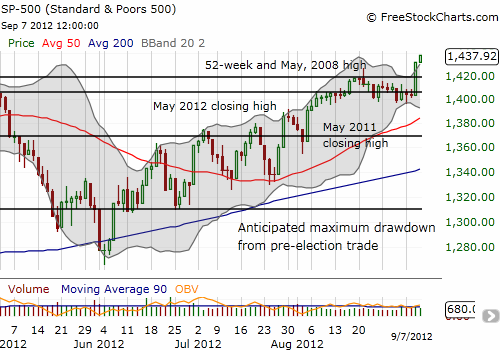
As expected, bad news was good news on Friday as the S&P 500 gained 0.4% on the heels of what was supposed to be a poor unemployment report for August. Another catalyst was news that China will roll out yet another stimulus program as the country now seems to be locked into a cycle of government intervention to stimulate, cool, and then stimulate again.

Regardless the reason for the extension of Thursday’s monster rally, the S&P 500 provided the bullish confirmation I needed to initiate a new short-term trading strategy: a new 4-year high on a strong close to follow-through on Thursday’s surge that wiped out all previous bearish undertones. The new strategy is to buy the dips as long as T2108 remains overbought. It assumes that the S&P 500 is embarking on another extended overbought period to follow-through on the extended overbought rally that began the year. This is NOT a recommendation for chasing the rally, especially here. The S&P 500 is quite stretched relative to its Bollinger Band, and these moves tend to correct before pushing higher again. (Note well that stochastics are NOT overbought!).
Here are the specifics – all buys refer to SSO calls:
- Intra-day: Buy dips in the morning and sell on next rally.
- Market close: Buy weak closes with target to hold position for 1-3 days.
- Rallies in general: sell rallies but do NOT fade them.
- Stops: The bullish strategy ends on whatever comes first: T2108 drops below 70% (no longer overbought) or the S&P 500 makes a lower low.
The last point is extremely important. The S&P 500 is already up 14.3% for the year, and it has had only one real cool-off period. This is not a time to get euphoric, but it is time to recognize that the upward trend continues. Until the trend ends, there is little point in fighting it. The trend ends when the S&P 500 prints a lower low…which has yet to happen since the bounce from the June 1 low. The condition for ending the strategy once T2108 drops from overbought is just a recognition that such a move could mark another transition point. When it happens, I will reassess the strategy.
In other trading news…
- As expected, Apple (AAPL) ended the week with a new all-time high (closing and intra-day). I failed to profit given poor timing and positioning of this week’s Apple calls.
- I sold my Siemens Atkins (SI) calls. The stock surged 2.4% on Friday and well above its upper Bollinger Band. My upside target was $100, and the stock is at $98.77. With only two more weeks to go before expiration, September options will lose time premium at a faster clip, further motivating my sale. SI remains a great way to play a recovery in Europe and/or a receding in euro-panic. The offsetting puts are worthless but the overall trade was profitable.
- Pro Shares UltraShort MSCI Europe (EPV) confirmed its weakness with a new all-time low. I will be dumping that position soon!
- The volatility index, the VIX, cratered 7.8%. In the past three days, the VIX has almost completely reversed its strong bounce from previous lows – contributing to my assessment that bearish undertones have been brushed away. I sold my puts against the VXX position but am holding the now nearly worthless short calls until expiration.
- The Federal Reserve issues its next statement on monetary policy on September 13. Recall that traders should expect a strong market in the day or two going into the meeting.
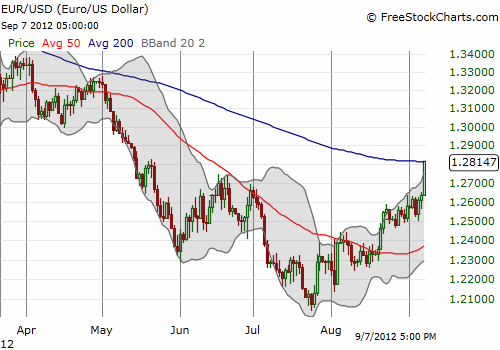
- The euro gained a strong 1.43% against the U.S. dollar, pushing it well above its upper Bollinger Band and closing right on the 200DMA. While I expected a small pullback, current momentum suggests the euro will soon hurtle over this resistance, providing further downward pressure for the U.S. dollar. More on this in another post!

Daily T2108 vs the S&P 500
Click chart for extended view with S&P 500 fully scaled vertically (updated at least once a week)

Black line: T2108 (measured on the right); Green line: S&P 500 (for comparative purposes)
Weekly T2108

*All charts created using freestockcharts.com unless otherwise stated
Related links:
The T2108 Resource Page
Expanded daily chart of T2108 versus the S&P 500
Expanded weekly chart of T2108
Be careful out there!
Full disclosure: long SSO puts; long AAPL calls, long EPV, long VXX short VXX calls, short EUR/USD
