(T2108 measures the percentage of stocks trading above their respective 40-day moving averages [DMAs]. To learn more about it, see my T2108 Resource Page. You can follow real-time T2108 commentary on twitter using the #T2108 hashtag. T2108-related trades and other trades are posted on twitter using the #120trade hashtag)
T2108 Status: 63%
VIX Status: 14.5%
General (Short-term) Trading Call: Hold with a bullish bias (more details below)
Reference Charts (click for view of last 6 months from Stockcharts.com):
S&P 500 or SPY
SDS (ProShares UltraShort S&P500)
U.S. Dollar Index (volatility index)
VIX (volatility index)
VXX (iPath S&P 500 VIX Short-Term Futures ETN)
EWG (iShares MSCI Germany Index Fund)
Commentary
For the third day in a row, T2108 closed at 63%. The rapid drop from overbought levels has not (yet?) preceded a similarly dramatic correction. In the meantime, the retooling of the T2108 portfolio got off to a tremendous start this week – much better than I could have expected.
As a reminder, the March 13th breakout of the S&P 500 placed T2108 back into overbought territory after a brief 6-day rest from the previous historic overbought period. The data suggest this is a time to get or stay bullish and NOT to expect an imminent, massive correction. The path higher should be fraught with churn and frequent jumps in and out of overbought territory. With this as a backdrop, I have left a near “full” position of SDS and a small position of VXX (that I never should have held) in the T2108 portfolio as a hedge for the aggressively bullish bias I am carrying forward from here. I launched my first “trial balloons” with call options and shares in Caterpillar (CAT) and call options on CSX Corporation (CSX). After I wrote that strategy, I also decided to load up on SSO calls (SSO is the ProShares Ultra S&P 500 ETF).
CAT was a disappointment as it experienced minimal follow-through for the rest of the week. Call options I bought expired worthless, but I am still holding a small number of shares. On Friday, I reloaded with some April calls. I bought the SSO calls a bit too early and had to wait out a 50% drop in value on March 14th. I did not have the presence of mind to double down on my bet; next time I will. The S&P 500 rallied again on Thursday, March 15th and delivered a 50% net gain that I quickly locked in. Those March $58 calls were expiring the next day, and it did not make sense to press my luck any further. The CSX calls were the truly big winners.
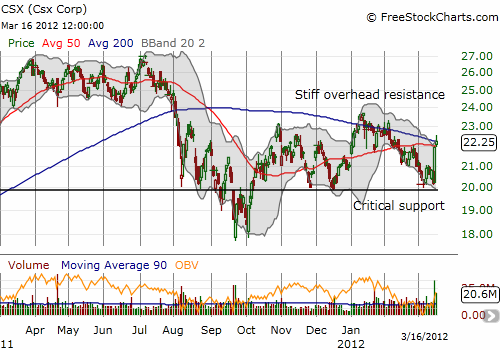
CSX was NOT in a bullish technical position at the time I selected it for a trade except that it looked like a critical support “should” hold. Instead, CSX is what I am calling a “catch-up” stock during this bullish phase for T2108. CSX remains well off its highs and likely looks cheap relative to a recovering economy. Catch-up stocks have some company-specific issue preventing a full recovery valuation. Anyone feeling left behind by the rally will give catch-up stocks a hard look given the apparent upside potential once the market decides to look past the issues. For CSX, sagging coal prices are dragging on the company’s performance even as all the economic signals the company sees remain strong. I gathered this interpretation after scanning the transcript of CSX earnings looking for insights on natural gas prices (see “Railroad Company CSX Anticipates A Bottom In Natural Gas Prices” for more). On March 14th, I felt like I made a terrible mistake. CSX sold off on high volume and broke its lows from March 13th even as the S&P 500 closed relatively flat for the day. That sell-off brought CSX ever closer to a disastrous break of critical support. Unlike the SSO calls, I bought April calls expecting CSX to take its time meandering back up to 50DMA resistance, so doubling down was not even close on the radar here.
Incredibly, the next day, CSX soared 8.5%. Turns out that CSX made a presentation that morning at the JPMorgan Aviation, Transportation and Defense Conference where the company reiterated its bullish guidance. Combined with a timely reiteration of an overweight rating and buyers got all the excuse they needed to play catch-up with CSX. Here is what Barclays said (from briefing.com, emphasis mine):
“Barclays says weak coal demand is challenging the earnings outlook for the eastern U.S. rails, CSX and NSC. The market has been quick to respond, sending both companies’ shares materially lower, but they expect a slow coal recovery will remain an overhang for several quarters. As mentioned earlier the firm downgraded NSC to Equal Weight as a result. On the other hand, solid pricing fundamentals and relatively stable western coal dynamics create a bright outlook for UNP. As mentioned earlier the firm upgraded UNP to Overweight. Although CSX also faces coal headwinds, they believe a lower valuation and forecast cost reductions this year provide some buffer for shareholders; firm reits their Overweight rating on CSX.”
Note well, the market received NO NEW INFORMATION. What happened was a simple reminder that CSX is cheap in a bullish environment and a recovering economy. CSX just happened to deliver the strongest example of a catch-up play that I could imagine. The 32.3 million shares traded were the highest in almost a year. CSX continued to rally on Friday, again on high volume. CSX punched above its 200DMA and now looks a LOT more bullish. I almost locked in a double on CSX, but if I had held on through Friday, I would have achieved a triple.

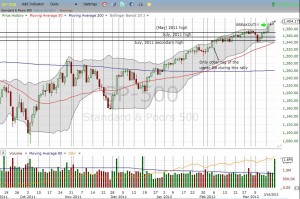
In case you were doubting that the bullish winds are once again behind the market, review the chart of the S&P 500 below. The index is now tagging the upper Bollinger Band (BB) and looks ready for a second phase of its rally in what technicians sometimes call “walking the band.” This occurs during strong trends whether up or down. Oscillators classically fail during these periods and cannot provide any new information. The S&P 500 smashed through the upper-BB as our first bullish signal. It has yet to close below the the upper-BB. For context, the S&P 500 has only tagged the upper-BB one other time during this entire multi-month rally. This occurred on February 3rd right at resistance from the July, 2011 secondary high. The one-day correction on March 6th ended right around this level. In other words, the S&P 500 has, incredibly, delivered one of its more bullish signals yet. It should be respected. Oh, and did I mention that buyers stepped up AGAIN? Buying volume surged (granted, Friday was a major options expiration day).
Click to see larger view.

Now, before you think I am getting carried away with all this bullish talk with the S&P 500 already up 11% or so for the year, I will reiterate that I am still not a stock chaser. Even in this bullish mode, I strongly prefer catch-up stocks to breakout stocks. For stocks in strong uptrends, I am looking for dips, as shallow as they may be, to lower my downside risk and to increase my assumed upside opportunity. Trades outside of my 2012 focus of housing, commodities, and insider buys will largely be swing trades (short-term on the order of days, not weeks). Finally, given the hedge of SDS and VXX, I will tend to be very aggressive with call buying on SSO on the dips. I will prefer call options for now because they give me an automatic stop loss which I consider a very important attribute with the stock market so well extended to the upside.
I close with these baffling stats demonstrating that retail investors are still walking away from the stock market and embracing bonds. In “Market Keeps Rising, but Who’s Doing All the Buying?“, CNBC provides the latest remarkable stats on investor flight from stocks…without definitively identifying whose buying keeps lifting stocks:
“Virtually every metric offered to gauge investor behavior is showing money draining out of the market and insiders skeptical about the future…
Stock-based mutual funds have lost $1.2 billion since the start of February even though those same funds have returned 9.8 percent in 2012.
Moreover, bond mutual funds have pulled in at least $6 billion for six weeks running, totaling $29.6 billion in the past four weeks, which was 11.8 times as much the $2.5 billion into all equity funds.
Finally, and perhaps most damning, corporate insiders are dumping their holdings in droves, selling $6.8 billion in February, the most in 11 months and 13 times the level of insider buying, which is way above the norm of 8.6 times.”
Moreover, “Thomson Reuters has found companies issuing negative earnings preannouncements outweighing those issuing positive ones by a 3-to-1 margin, the highest since the crisis days of 2009” and “analysts have cut their ‘buy’ ratings on each of the [S&P 500]’s 10 sectors during the course of the year.”
Incredibly, a good chunk of the money leaving stocks has apparently piled into ONE ETF, VXX, the iPath S&P 500 VIX Short-Term Futures ETN. Schaeffer’s Investment Research provides this incredible data from Barron’s, March 10, 2012:
“… the assets entrusted to the iPath S&P 500 VIX Short-Term Futures exchange-traded note (VXX) has increased by $746 million, or 94%, this year, to $1.54 billion. This is a fund that increases in value along with the price of implied market volatility, known more colloquially as disaster insurance. So, about three-quarters as much net cash has found its way to a fund that profits from spikes in U.S. market volatility as has been sent to funds that attempt to profit from rising equity-market values.”
No matter what we make of this investor flight and negativity, it is clear that the resulting selling remains too weak to take the market down significantly. The few buyers that are out there are obviously sufficient to keep any dips shallow. I dare not guess what will change this strange dynamic, but while it lasts, I will remain focused on constructing trading strategies that fit the occasion.
Next up, Best Buy (BBY) as my next catch-up stock.
Charts below are the latest snapshots of T2108 (and the S&P 500)
Refresh browser if the charts are the same as the last T2108 update.
Black line: T2108 (measured on the right); Green line: S&P 500 (for comparative purposes)
Weekly T2108

*All charts created using freestockcharts.com unless otherwise stated
Related links:
The T2108 Resource Page
Expanded daily chart of T2108 versus the S&P 500
Expanded weekly chart of T2108
Be careful out there!
Full disclosure: long SDS and VXX; long VXX puts; long CAT shares and calls; long BBY

