(T2108 measures the percentage of stocks trading above their respective 40-day moving averages [DMAs]. To learn more about it, see my T2108 Resource Page. You can follow real-time T2108 commentary on twitter using the #T2108 hashtag. T2108-related trades and other trades are posted on twitter using the #120trade hashtag)
T2108 Status: 73%
VIX Status: 14.7%
General (Short-term) Trading Call: Strong bullish bias – see below for more details and an explanation!
Reference Charts (click for view of last 6 months from Stockcharts.com):
S&P 500 or SPY
SDS (ProShares UltraShort S&P500)
U.S. Dollar Index (volatility index)
VIX (volatility index)
VXX (iPath S&P 500 VIX Short-Term Futures ETN)
EWG (iShares MSCI Germany Index Fund)
Commentary


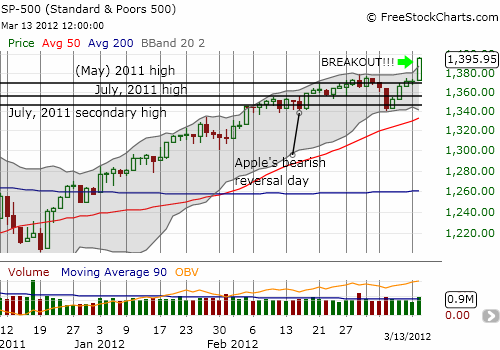
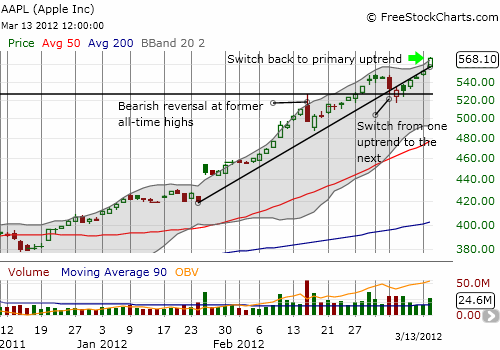
A picture can say a 1000 words, and a stock chart can broadcast a 1000 lessons. I started this T2108 Update with these two charts because, in my mind, they perfectly symbolize the bullish significance of today’s trading. Buyers FINALLY stepped up in force to power the S&P 500 higher. The 1.8% gain on the day featured higher than average volume, a breakout to near four-year highs, and a close at the highs of the day. The market simply cannot get more bullish than this on a single trading day. A stellar trifecta. Apple (AAPL) clearly led the way for the bulls; the main differences are the ALL-TIME highs on the winds of persistently strong buying pressure. Enjoy these pictures – I think it is rare to get such convincing breakouts.
OK. Now that I got the excitement out of my system, I can wallow in my queasiness about this setup. T2108 re-entered overbought territory after just a brief rest from the historic overbought period that began this year. I was looking for the 7-8% sell-off that has historically been the worst case scenario following extended overbought periods. I would have gladly bought with both hands under such a scenario. Instead, we got the equally likely 1-2% sell-off, and I sat on the bearish T2108 bearish portfolio. I braced for a breakout, but hoped for more churn to give me more time to mentally adjust to the bullish implications of the shallow sell-off. Instead, we got the most bullish breakout possible in very short order. In other words, I have not had a chance to get comfortable with the stark reality that it is time for a change in strategy, and this situation leaves me queasy.
As a contrarian at heart, I prefer to buy into sell-offs (fear) and sell into rallies (cheer). The standard T2108 cycles are a perfect fit for my comfort zone. Now, T2108 is not signalling a cyclical strategy; it is signalling a trend-following strategy. Based on the last historical analysis I conducted on overbought periods, I have been reiterating the need to recognize that the market is flashing bullish signs for whatever would follow the last overbought period. Now, here we are.
Here is a partial reminder of the strategy I outlined for this period in the last T2108 Update:
“Going forward, I will be maintaining the current bearish configuration (SDS and VXX shares) as a hedge to this trend-following strategy. I want to keep this component in place in case some black swan swoops in to deliver an extreme counter-punch. In parallel, I will be aggressively executing swing trades (duration of 1 to 3 days or so) in the indices AND individual stocks, using shares and options. I will particularly focus on fading any and all pops in VXX with put options. The weekly chart…reminds us that VXX’s ultimate fate is always lower prices; I may drop VXX shares altogether if for some reason I am not able to stay ahead of losses with VXX put options. During the current VXX downtrend, trading these puts [has] consistently delivered attractive profits for me (but not in the T2108 portfolio unfortunately!). I recommend reading “Volatility ETFs Often Own All VIX Futures” for understanding why the current crop of volatility products perform so poorly over an extended period of time.”
I expect the S&P 500 to grind its way higher and higher over the coming weeks and months, but it should feature constant shifting in and out of overbought periods rather than another extended overbought period. While the bias will be for more upside, the churn will remind us (or at least me) of the on-going downside risks. Bears will find themselves constantly frustrated, and bulls will find constant relief. However, the historical data also suggest that this next bullish phase will NOT end as well as the first one. In fact, we should expect an outcome very similar to the extended overbought periods of 2009 and 2010. That is, at the end of this road is hiding somewhere the next calamity. This time, it will be something none of us are thinking about and/or worrying about. Yes, I just feel more comfortable thinking about what can go wrong. 🙂
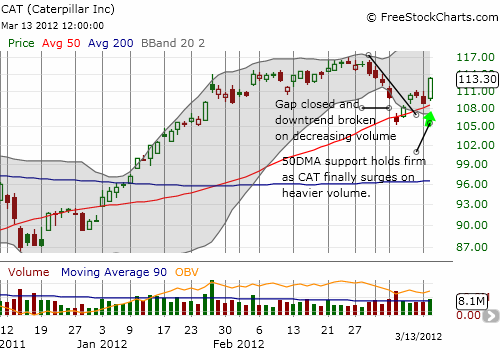
To kick off this trend-following, I executed two aggressive trades: calls and shares in Caterpillar (CAT) and calls in CSX Corporation (CSX). I previously discussed the bearish implications for the divergence in performance of the two stocks. I even cautioned in a separate post that CAT may have printed an ominous breakdown. Today’s bullish trading action invalidated the warning:

In this next bullish phase, I fully expect CSX to play a lot of catch-up (a slowdown in coal is hurting CSX) and for CAT to represent one of the favorite ways for big buyers to play an on-going recovery in the U.S. and global economy.
I consider these trades to be my first trial balloons of the shift in strategy. I am looking for confirmation that the S&P 500 is truly embarking on a fresh trend. This confirmation should come with a bullish follow-through day within the next week or less WITHOUT the S&P 500 completely reversing today’s breakout. Breaking the lows of today will call into question the breakout. I plan to stay flexible and nimble, especially since I am now traveling a bit away from my traditional comfort zone.
Finally, note that I have written about many bullish scenarios in the past few months. These areas will also be my focus on any future buying setups: commodities, housing, insider buying, and special “situations” or themes. Stay tuned for more pieces in these areas.
Charts below are the latest snapshots of T2108 (and the S&P 500)
Refresh browser if the charts are the same as the last T2108 update.
Black line: T2108 (measured on the right); Green line: S&P 500 (for comparative purposes)
Weekly T2108

*All charts created using freestockcharts.com unless otherwise stated
Related links:
The T2108 Resource Page
Expanded daily chart of T2108 versus the S&P 500
Expanded weekly chart of T2108
Be careful out there!
Full disclosure: long SDS and VXX; long CAT shares and calls; long CSX calls


Aah shit. Yes shit, dammit. (hope the profanity does not offent). I hate this situation but I think you’re right. I concluded the same yesterday, same day as you. I suspect I’ll get stopped out of most new longs given my skittishness. How do you recommend dealing with that?
We are on the exact same wavelength. I am dealing with this uncomfortable situation by starting small. My positions in CAT and CSX are as I said “trial balloons.” I want the market to keep proving itself to be in a bullish mode. I will have a loose stop because 1) I expect more churn and the market to weave in and out of overbought conditions, and 2) I am fully hedged with my on-going positions in SDS and VXX (although I have now come to re-loathe VXX!). I hope that helps!
In future T2108 updates, I plan to talk about individual stocks a little more to demonstrate how I am thinking about all this. The T2108 portfolio was originally intended only for playing the major indices, so I am also uneasy right now venturing into individual stocks since I expose that portfolio to company-specific risks that have nothing to do with the T2108 technicals.
On your recommendation just looked at chart of csx. UUg. what’s going to be the catalyst?
I also just tweeted on CSX. I am back to being suspicious. The stock shouldn’t break yesterday’s low for my thesis to hold up. I will give it another few days. For now, it is STILL contradicting the general bullish signals in the market. The main catalyst is the interest of big buyers late to the table who are looking for “catch up” stocks in companies that should do well in a continued economic recovery.