(T2108 measures the percentage of stocks trading above their respective 40-day moving averages [DMAs]. To learn more about it, see my T2108 Resource Page. You can follow real-time T2108 commentary on twitter using the #T2108 hashtag. T2108-related trades and other trades are posted on twitter using the #120trade hashtag)
T2108 Status: 83% (overbought day #20)
VIX Status: 19.4
General (Short-term) Trading Call: Close more bullish positions, begin/expand bearish positions
Reference Charts (click for view of last 6 months from Stockcharts.com):S&P 500 or SPY
SDS (ProShares UltraShort S&P500)
U.S. Dollar Index (volatility index)
VIX (volatility index)
VXX (iPath S&P 500 VIX Short-Term Futures ETN)
EWG (iShares MSCI Germany Index Fund)
Commentary
It is hard to believe that January ended with 4 days of selling given this month’s performance was the best start to a year since 1997. The losses have been very small, but they have managed to take the S&P 500 off its primary uptrend. Volume also picked up slightly, reaching the 90-day average for only the second time this year. (Click link above to review the chart). The lack of participation in this historic rally is of course bringing that moving average down at a rapid clip. (For more on the light volume, see my T2108 Update from January 25).
As promised, I sold my SSO calls soon after Tuesday’s opening. This was a case where holding calls that expire in a few days really forced the issue in a good way. The S&P 500 stalled soon after it gapped up at the open. The subsequent selling would have erased all my profits and then some at the day’s lows.
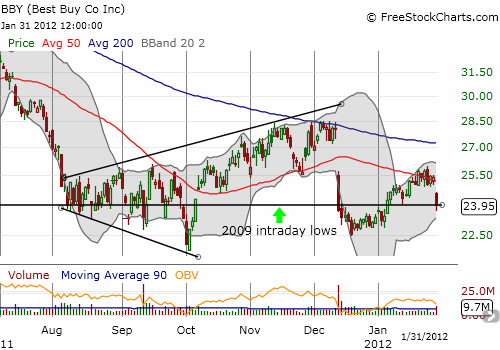
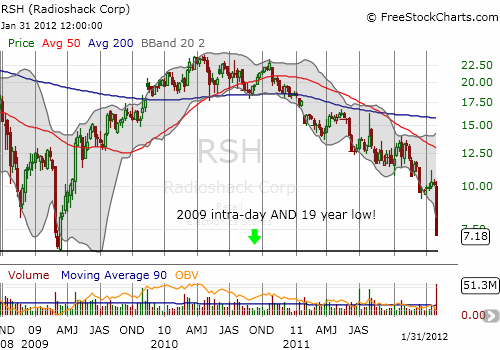
My next trade idea for waiting out the overbought period was a purchase of a handful of call options on Best Buy (BBY). The stock dropped from 50DMA resistance and closed with a loss of 5.6% in sympathy with a gut-wrenching, post-earnings crushing of Radio Shack (RSH). RSH lost 30% on the day!


I feel that BBY’s loss was overdone just based on Radio Shack’s poor results. This time, I purchased calls expiring in March anticipating the path from here to closing the gap will NOT be a straight one. For good measure, I even bought a few calls on Radio Shack expiring in the summer as a VERY speculative play that Tuesday’s destruction could be a catalyst for major, constructive change for “The Shack.” The selling struck me as the market starting to vote that RSH will be the next electronics retailer to slide into oblivion. Eventually, I will write up my thoughts on CNBC’s recent special exploring BBY’s business. In the meantime, these trades obviously will extend well past the current overbought period. If overbought conditions continue to drag on, I will not be surprised to see both stocks make sharp (partial) recoveries, providing an early exit for my positions.
T2108 has now been overbought for 20 days. This is an important milestone. Of the 19 overbought periods since 1986 that made it this far, only TWO finished the overbought period in negative territory relative to the close of the first overbought day, one finished flat, and nine more finished with gains at or below 5%. The remaining seven experienced extremes in performance (for more details, see my analysis of overbought periods).
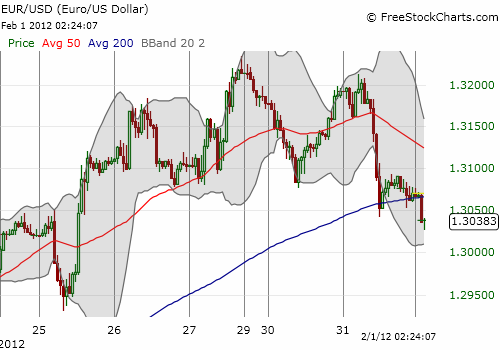
Unfortunately, I do not yet have statistics on performance AFTER the overbought period ends. However, the implication, incredibly, is that the tide is slowly shifting in favor of the bulls…even with the horrible trading volume! That is, unless the euro has anything to offer to derail proceedings. Early in Tuesday’s trading session, I tweeted that the euro was heading straight south. It went on to plunge much further than I expected, and, as is often the case these days, the market ignored it and eventually bounced despite the drop.

Regardless, I will be even more patient waiting to apply my last 25% bearish position. Moreover, the time may come within the next week to consider some official bullish T2108 trades to hedge the bearish position or even to neutralize it (as opposed to stopping out altogether). The specific positioning will have to depend on trading relative to overheard resistance from the highs of last summer. The outcome of this overbought period will have a strong impact on the formal rules I eventually write for trading overbought periods. Stay tuned and buckle your seat belts.
For your viewing pleasure, legendary market technician and creator of the Bollinger Bands, John Bollinger, cautions that trading the “golden cross” is not good in a long, sideways market like the current one. He also talks about the psychology of the January effect but describes betting on it akin to a coin toss. Yet, he still concludes that it is worth holding equities into the middle of the year for the promise of modest gains.
Charts below are the latest snapshots of T2108 (and the S&P 500)
Refresh browser if the charts are the same as the last T2108 update.
Black line: T2108 (measured on the right); Green line: S&P 500 (for comparative purposes)
Weekly T2108

*All charts created using freestockcharts.com unless otherwise stated
Related links:
The T2108 Resource Page
Expanded daily chart of T2108 versus the S&P 500
Expanded weekly chart of T2108
Be careful out there!
Full disclosure: long SDS and VXX; long BBY shares and calls, long RSH calls, short EUR/USD

