On May 15, 2006, I wrote a piece called “Evidence of A Tiring Bull.” I used T2107, the percentage of stocks trading above their 200-day moving averages (DMAs), to make the strong claim that the three-year old bull market was nearing an end. T2107 had been in decline for two years, and I projected the downtrend to continue. The S&P 500 had just started a “sell-in-May” correction and by late June, it seemed I had made a prescient call.
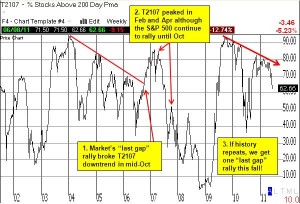
At that point, a rebound and then rally ensued. By October, the stock market had not only recovered, but was making new 5-6 year highs. Even the downtrend in T2107 broke, and I had to backpedal into a reluctant bullish posture. Then, a strange thing happened. T2107 made a double-peak in February and April of 2007, but the stock market continued to rally to fresh highs. The rally just kept pushing along even as T2107 continued to decline. It was not until October, 2007, that the market finally hit the brick wall that preceded our last major bear market.
Standing here almost four years after that experience, I can appreciate better how I did not maintain the proper frame of reference when interpreting T2107. The 200DMA is a slow-moving average. While it is very bearish for a stock to drop below its 200DMA, the process of a complete breakdown can occur over many tests, breaks, recoveries, and retests. Moreover, even as more and more stocks stumble, a minority of strong stocks can continue to maintain the burden of carrying indices to higher levels. In other words, a major bull market can send its warning signals in slow motion, not in one resounding wake-up call. It seems the slow motion warnings are underway again.
The chart below summarizes T2107’s behavior over the past 10 years.
Click graphic for a larger view

*Chart created using TeleChart
Notice that T2107 topped out very quickly after the March, 2009 lows, reaching stratospheric levels (above 90%) reminiscent of early 2004. Since September, 2009, T2107 has slowly but surely ground its way lower. Even the current rally off the summer 2010 lows stopped just short of the downtrend. If history repeats itself, we will get a major snapback rally starting at some point this summer (according to my T2108 analysis, the bottom preceding such a rally could be imminent). Once T2107 crosses its downtrend line, we should get confirmation that a sustained rally is underway. After that, we will watch to see whether and when the stock market starts to diverge from T2107. That is, if T2107 restarts a sustained decline even as the stock market continues to rally, we should guess that the overall bull market is very likely coming to an end (or at least some major correction is imminent).
Last time, I was thrown off the scent by long duration of this entire process (over a year). I will be more patient and more vigilant this time around. Last time, it was Intel (INTC) that refused to confirm the stock market’s rally by peaking in late 2003, very soon after the bull market started. This time, another major stock, Goldman Sachs (GS), is refusing to confirm the current rally off the March, 2009 lows by topping out in late 2009 and declining ever since.
Be careful out there!
Full disclosure: long SSO puts, long GS
