
AT40 = 20.4% of stocks are trading above their respective 40-day moving averages (DMAs) (ends 3-day oversold period)
AT200 = 44.8% of stocks are trading above their respective 200DMAs
VIX = 25.0 (smallest range since February 1, 2018)
Short-term Trading Call: bullish
Commentary
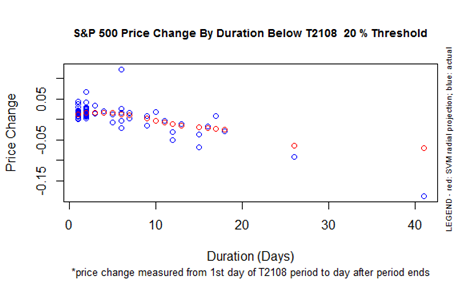
It was a reluctant push, but AT40 (T2108), the percentage of stocks trading above their respective 40-day moving averages (DMAs), just barely punched above the oversold threshold of 20%. The close of 20.4% ends a 3-day oversold period over which the S&P 500 (SPY) gained 3.2%. That performance is at the high end of an expected 3-day oversold period (see the red dots in the chart below).
The S&P 500 (SPY) closed with a marginal 0.3% gain. It has yet to reverse or invalidate the failure at 50DMA resistance.
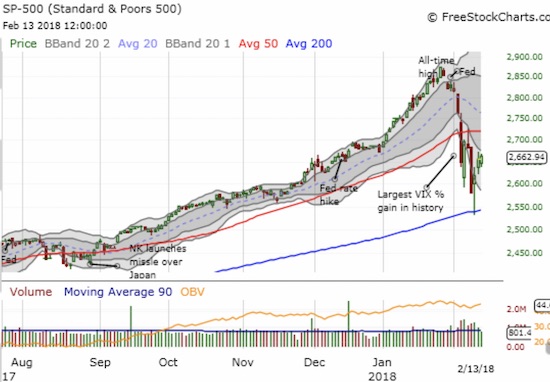
The volatility index, the VIX, dropped just 2.5%. The range from intraday low to high was the smallest range since the beginning of the month. This is a perfect coiled spring ahead of the U.S. report on inflation (CPI) on Valentine’s Day, Wednesday, February 14th. Since an inflation “scare” from strong wage gains in the jobs report was one of the proximate causes of the current sell-off, this inflation report has the potential to make or break the recovery from oversold trading conditions.
CHART REVIEWS
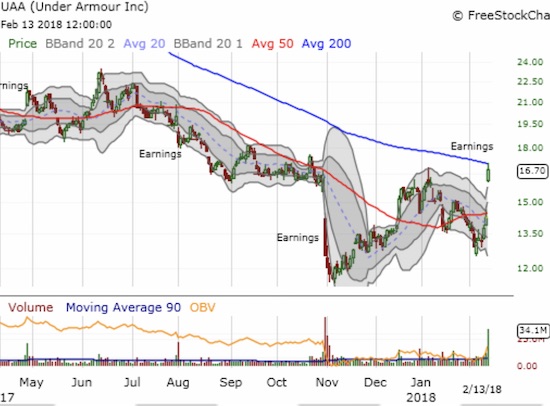
Under Armour (UAA)
UAA popped 17.4% post-earnings. Back on November 9, 2017, Kohl’s (KSS) had the following to say in its earnings conference call about Under Armour (emphasis mine) (from the Seeking Alpha transcript):
“Looking at our progress on our individual key pillars, on the product front, our active business increased almost 20% for the quarter, an acceleration of the year-to-date trend. Both apparel and footwear categories in Active were strong and this was driven by large increases in both Nike and Adidas, as well as continued strong performance from Under Armour. We continue to gain market share in Active and we expect the very strong holiday performance in both Active apparel and footwear categories.”
KSS issued this encouraging report on UAA just one week after the stock experienced a large post-earnings gap down. I was tempted to buy UAA as part of a bottom-fishing component to my 2018 thesis to buy retail, but I balked. UAA is now up about 41% from that point! I will start accumulating UAA if it manages to close above its 200DMA and follow-through. The large trading volume of 34.1M shares, at a minimum, shoved aside the negativity from the last earnings report and definitely created the conditions for securing a bottom in the stock.
Trade notes from previous AT40 posts: bought shares in U.S. Steel (X), sold SPY calls expiring Friday and started accumulating a new tranche expiring next week, sold AAPL call options (on Monday), bought fresh CAT put for a partial hedge, added to ProShares Ultra VIX Short-Term Futures (UVXY) puts, sold short iPath S&P 500 VIX ST Futures ETN (VXX)
— – —
FOLLOW Dr. Duru’s commentary on financial markets via email, StockTwits, Twitter, and even Instagram!
“Above the 40” uses the percentage of stocks trading above their respective 40-day moving averages (DMAs) to assess the technical health of the stock market and to identify extremes in market sentiment that are likely to reverse. Abbreviated as AT40, Above the 40 is an alternative label for “T2108” which was created by Worden. Learn more about T2108 on my T2108 Resource Page. AT200, or T2107, measures the percentage of stocks trading above their respective 200DMAs.
Active AT40 (T2108) periods: Day #1 over 20% (ended 3-day oversold period), Day #7 under 30%, Day #8 under 40%, Day #8 under 50%, Day #9 under 60%, Day #15 under 70%
Daily AT40 (T2108)
")
Black line: AT40 (T2108) (% measured on the right)
Red line: Overbought threshold (70%); Blue line: Oversold threshold (20%)
Weekly AT40 (T2108)

*All charts created using freestockcharts.com unless otherwise stated
The charts above are my LATEST updates independent of the date of this given AT40 post. For my latest AT40 post click here.
Related links:
The AT40 (T2108) Resource Page
You can follow real-time T2108 commentary on twitter using the #T2108 or #AT40 hashtags. T2108-related trades and other trades are occasionally posted on twitter using the #120trade hashtag.
Be careful out there!
Full disclosure: long X shares, long SPY calendar call spread and call, long CAT calls and puts, long UVXY puts, long SVXY calls, short VXX, long NKE
*Charting notes: FreeStockCharts.com uses midnight U.S. Eastern time as the close for currencies. Stock prices are not adjusted for dividends.