
AT40 = 36.2% of stocks are trading above their respective 40-day moving averages (DMAs)
AT200 = 50.4% of stocks are trading above their respective 200DMAs
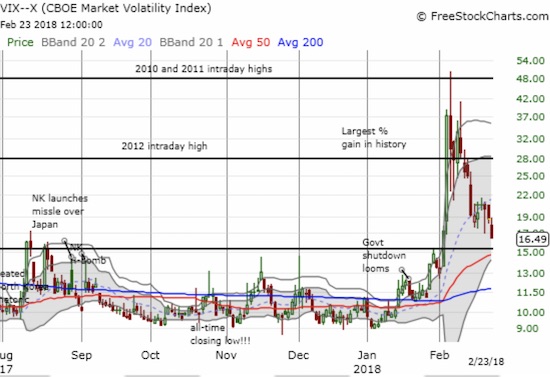
VIX = 16.5
Short-term Trading Call: neutral (awaiting confirmation of bullish breakout)
Commentary

Something woke the bulls and buyers back up enough to get the steamroller warmed up again. The bears have had plenty of time to sidestep what looks like a freshly bullish bumrush.
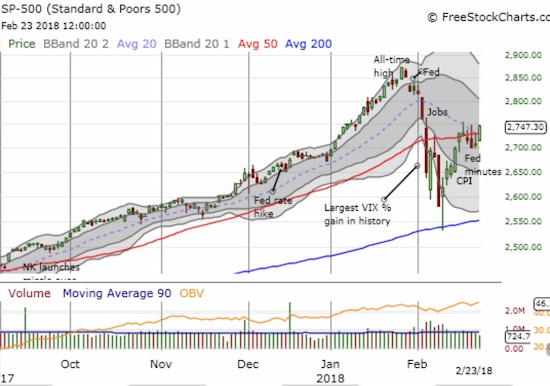
The S&P 500 (SPY) jumped higher by 1.6% for its highest close during this recovery from oversold trading conditions. The index is once again above its 50-day moving average (DMA), and this time looks ready to confirm the breakout.
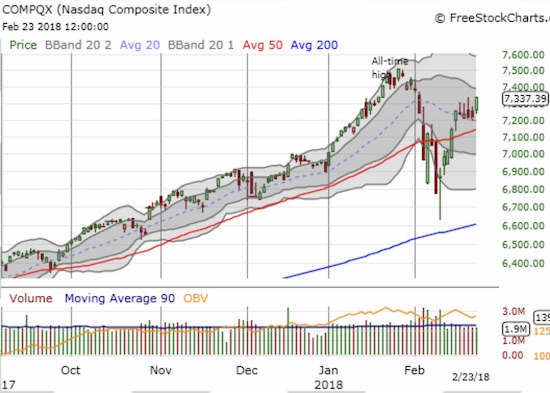
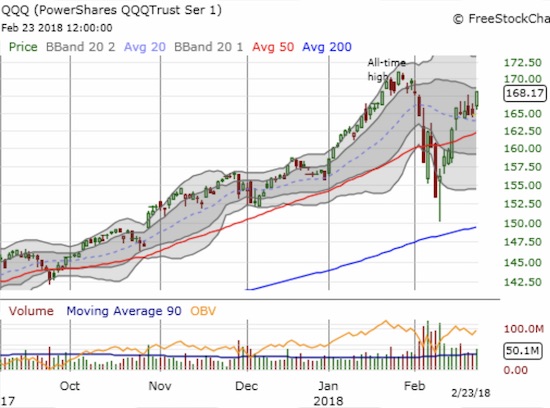
The NASDAQ gained 1.8% and closed even with the intraday high of this recovery period. The PowerShares QQQ ETF (QQQ) gained 2.0% and made its highest high of the recovery period. The tech-laden ETF even looks ready to challenge its all-time high in the coming week. QQQ is also even with its price that opened February.
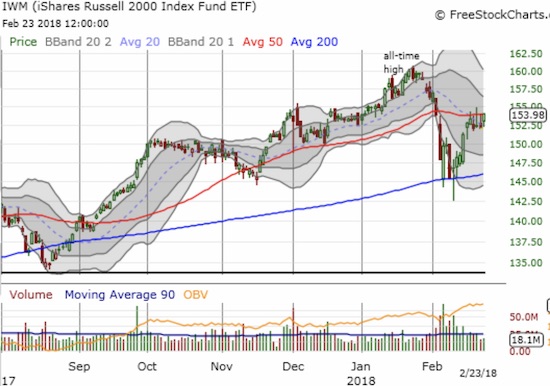
The iShares Russell 2000 ETF (IWM) continues to lag. While IWM made its highest close of the recovery period, the index is still wrestling with 50DMA resistance.
The strong buying pressure had the expected impact on the volatility index, the VIX. The VIX finished a complete reversal of all its gains since the largest percentage jump in its history. The current implosion should be no surprise to anyone who has looked at historical data and especially the recent data. For a refresher, see my last post on the topic: “Periods of Extremely Low Volatility Remain Bullish – Now With Fresh Footnotes.”
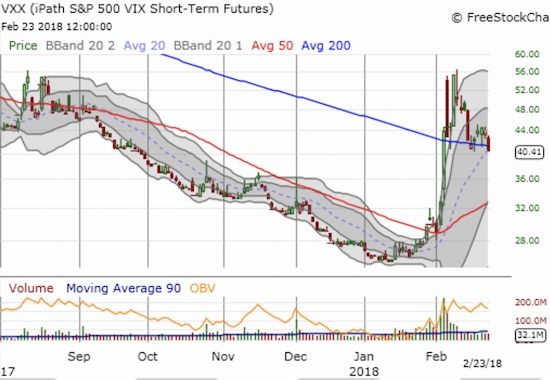
The VIX lost 11.2% on Friday and closed at 16.5. Interestingly, the iPath S&P 500 VIX ST Futures ETN (VXX) has yet to reverse even half its gain on the day when the VIX experienced its largest ever percentage gain. I strongly suspect a lot of “catch-up” is going to happen in the coming weeks. So instead of looking to fade VXX, I may add to my short VXX position on weakness.
AT40 (T2108), the percentage of stocks trading above their respective 40DMAs, made its highest close of the recovery period at 36.2%. AT200 (T2107), the percentage of stocks trading above their respective 200DMAs, finally closed above 50% at 50.4%. Another close above the 50% mark in the coming days will become sufficient reason to expect even more healing for the market.
I left my short-term trading call at neutral even though I am very biased to buy. I will flip the trading call back to bullish once/if the S&P 500 confirms its 50DMA breakout.
CHART REVIEWS
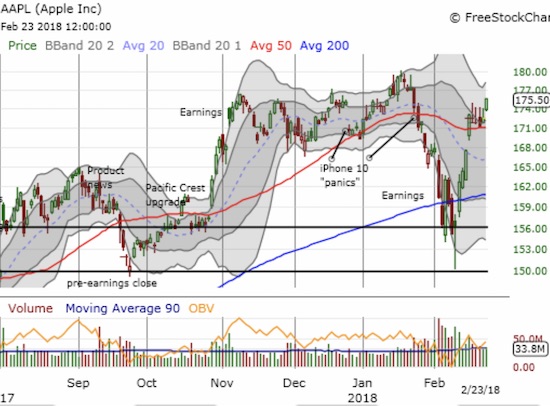
Apple (AAPL)
Nothing says a change in mood like AAPL confirming a 50DMA breakout. AAPL has not only reversed all its post-earnings loss, but also the stock has little overhead resistance between here and its all-time high. I failed to make my weekly play on call options, but I will do so on the first dip on Monday…if one comes!
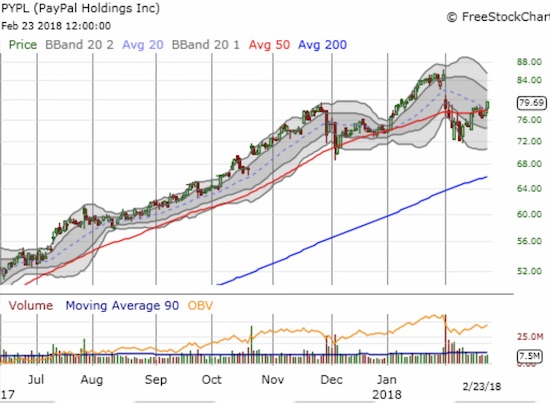
Paypal (PYPL)
In what looks like a breakout period for the market, stocks like PYPL become ripe for trading long. The stock broke out above its 20 and 50DMAs and has a post-earnings gap to fill. The stop loss points are simple and can be set based on risk tolerance. The tightest stop is around $76 below the recent congestion around the 50DMA. A more aggressive stop is under the most recent low around $71. A close at that level would be bearish as a (re)confirmation of a 50DMA breakdown.
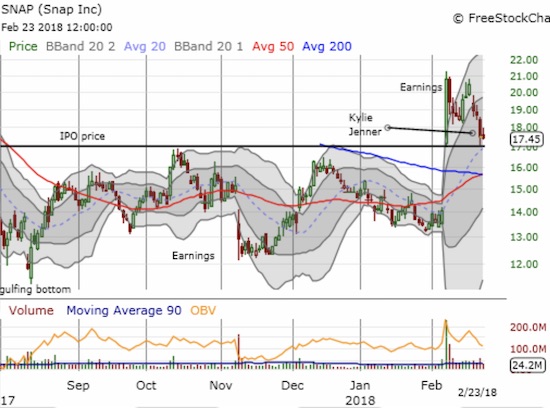
Snap (SNAP)
SNAP travelled in the opposite direction of the stock market. The stock ended the previous week on a high note with a run-up that looked like the triumphant return of post-earnings momentum. Citigroup drained that rising tide with a sell rating to start the holiday-shortened week. Sellers hardly took a pause from there except to allow a breather for an obligatory bounce off the $17 IPO price. A tweet from Kylie Jenner, star Olympian Caitlyn Jenner‘s mega (former teen) celebrity daughter, greased the skids: she expressed her dislike for the new user interface (UI)…
sooo does anyone else not open Snapchat anymore? Or is it just me… ugh this is so sad.
— Kylie Jenner (@KylieJenner) February 21, 2018
With 363,000 likes (hearts), 5,100 comments, and 74,000 retweets, Kylie’s tweet seems to validate Citigroup’s sell rating. However, I duly noted Kylie said nothing about what she will use instead – stick with Instagram? Twitter? I think the “Kylie panic” is worth buying into as the negative endorsement can easily be reversed and/or fixed. For example, the quick trigger media seemed to miss Kylie’s follow-up tweet later the same day which reversed the star’s initial rant…
still love you tho snap … my first love
— Kylie Jenner (@KylieJenner) February 21, 2018
My last shares of SNAP were called away on the previous expiry week, so I did feel fortunate after the Citi downgrade. I used the subsequent selling to accumulate call options and lastly to buy a covered call position for good measure. As before, I am fine with the shares getting called away. If the shares survive expiry, I will sell calls again. I am assuming given SNAP’s strong earnings performance the stock can and will at worst pivot around its $17 IPO price for now.
Trades related to previous posts: Sold TGT shares
— – —
FOLLOW Dr. Duru’s commentary on financial markets via email, StockTwits, Twitter, and even Instagram!
“Above the 40” uses the percentage of stocks trading above their respective 40-day moving averages (DMAs) to assess the technical health of the stock market and to identify extremes in market sentiment that are likely to reverse. Abbreviated as AT40, Above the 40 is an alternative label for “T2108” which was created by Worden. Learn more about T2108 on my T2108 Resource Page. AT200, or T2107, measures the percentage of stocks trading above their respective 200DMAs.
Active AT40 (T2108) periods: Day #6 over 20%, Day #2 under 30%, Day #13 under 40%, Day #13 under 50%, Day #14 under 60%, Day #20 under 70%
Daily AT40 (T2108)
")
Black line: AT40 (T2108) (% measured on the right)
Red line: Overbought threshold (70%); Blue line: Oversold threshold (20%)
Weekly AT40 (T2108)

*All charts created using freestockcharts.com unless otherwise stated
The charts above are my LATEST updates independent of the date of this given AT40 post. For my latest AT40 post click here.
Related links:
The AT40 (T2108) Resource Page
You can follow real-time T2108 commentary on twitter using the #T2108 or #AT40 hashtags. T2108-related trades and other trades are occasionally posted on twitter using the #120trade hashtag.
Be careful out there!
Full disclosure: short VXX, long SPY call spread, long SNAP shares and short a call, long SNAP calls, long PYPL shares
*Charting notes: FreeStockCharts.com uses midnight U.S. Eastern time as the close for currencies. Stock prices are not adjusted for dividends.