
AT40 = 28.0% of stocks are trading above their respective 40-day moving averages (DMAs)
AT200 = 47.4% of stocks are trading above their respective 200DMAs
VIX = 20.0
Short-term Trading Call: neutral (downgrade from cautiously bullish)
Commentary
Buyers are starting to look exhausted.
Based on the topsy-turvy reaction to the minutes from the last meeting of the Federal Reserve, that cloud hanging over the stock market this week was Fed-related anxieties. For example, this thinly veiled warning about rich valuations and high debt levels could reasonably cause some pause…
“Regulatory actions and improved risk management in recent years had put the financial system in a better position to withstand adverse shocks, such as a substantial decline in asset prices, than in the past. However, amid elevated asset valuations and an increased use of debt by nonfinancial corporations, several participants cautioned that imbalances in financial markets may begin to emerge as the economy continued to operate above potential. In this environment, increased use of leverage by nonbank financial institutions might be difficult to detect in a timely manner. It was also noted that the Committee should regularly reassess risks to the financial system and their implications for the economic outlook in light of the potential for changes in regulatory policies over time.”
The initial response to the minutes was one of excitement as the S&P 500 (SPY) quickly raced to its high of the day. Right at 2:30pm Eastern, the sellers stepped in and barely paused to rest until the close.
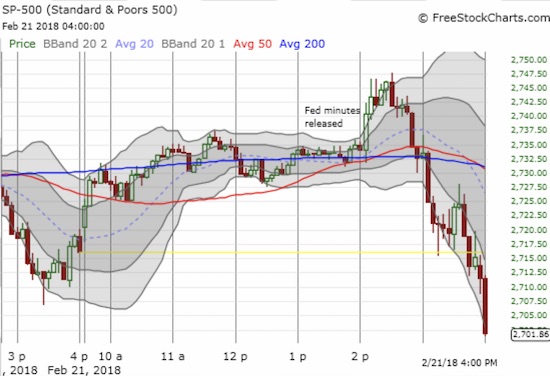
The end result on the daily chart was another failure at the 50-day moving average. With a lower closing low, the S&P 500 confirmed the previous day’s 50DMA failure. Sellers also significantly pushed the index off its intraday high for the third day in a row. Buyers are suddenly looking exhausted.
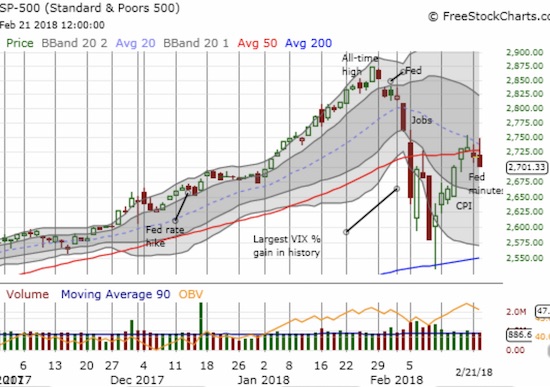
The NASDAQ and the PowerShares QQQ ETF (QQQ) are both still trading above their respective 50DMAs, but the toppy behavior looks the same as it looks on the S&P 500. The iShares Russell 2000 ETF (IWM) managed to close the day with a fractional gain, so it just barely avoided confirming a failure at 50DMA resistance.
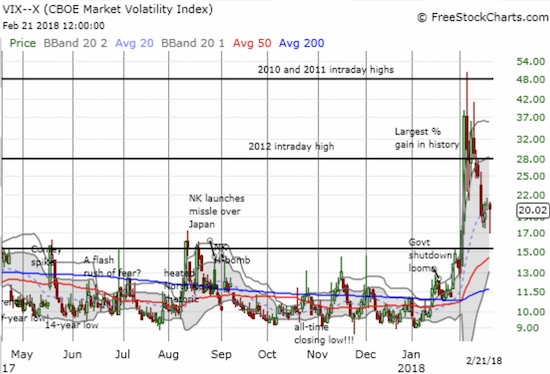
The volatility index, the VIX, was on its way to continuing its implosion off this month’s historic surge before sellers took control of the market. The VIX dropped as low as 17.0 before rebounding to 20.0. So volatility remains “elevated.”
AT40 (T2108), the percentage of stocks trading above their respective 40DMAs, traded as high as 35.7% but closed at its low of the day at 28.0%. The reversal was significant and confirmed the weakness of buyers. Combining the 50DMA resistance of the S&P 500 with the resilience of the VIX and the confirming reversal of AT40 forced me to downgrade my short-term trading call to neutral. If AT40 was not so close to oversold conditions, I would just go ahead and flip bearish. Bears have a good risk/reward window here where follow-through selling from the failure at resistance could be sizable compared to the stop-loss set just above this week’s intraday highs (or even tighter just above the 50DMA).
The currency market is also still flashing red to me. The Australian dollar (FXA) versus the Japanese yen (FXY) displayed fresh weakness and challenged the lows from the recent sell-off. The currency pair is still saying “risk off”, so a new low will really ring my alarm bells.
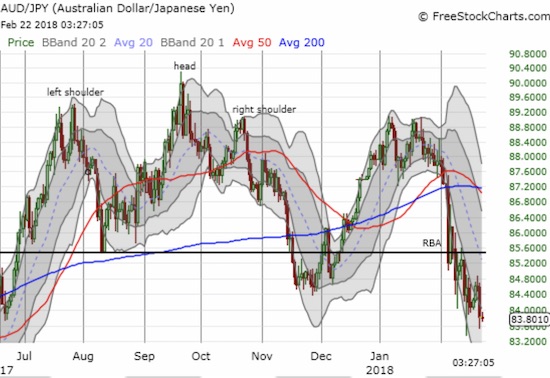
CHART REVIEWS
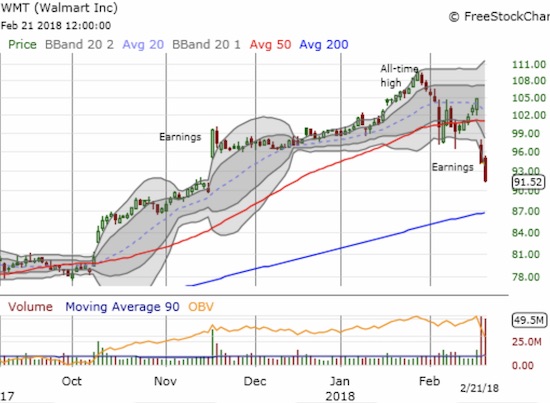
Walmart (WMT)
The retail trade for 2018 took a serious blow from a poor response to WMT earnings. The stock gapped down below its 50DMA and ended the day with a 10.2% loss. Today, the sellers piled on for another 2.8% loss that took WMT even further below its lower-Bollinger Band (BB). With WMT filling the gap UP from November earnings, I daresay the top is in for WMT for now. I will have to start reducing my retail exposure starting with locking in profits on Target (TGT) given its similarity to WMT.
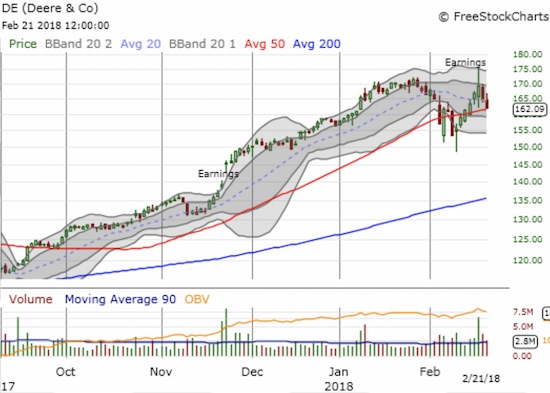
Deere & Co. (DE)
DE reported earnings to start the week. The stock ranged from just above its 50DMA support to a new intraday all-time high. I have tracked it ever since and looked at the drift back toward 50DMA support as a buying opportunity for a swing trade. However, the weak close makes a 50DMA breakdown very likely along with a retest of the closing low of the recent sell-off. In other words, DE is now at risk of a blow-off top.
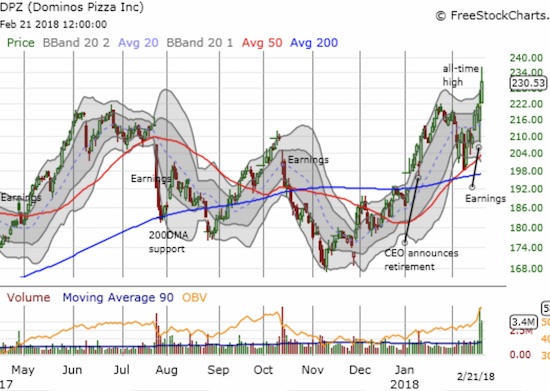
Dominos Pizza (DPZ)
On Tuesday, sellers initially dominated the post-earnings action in DPZ. Thinking the stock was headed to a test of 50DMA support and worse, I bought a put option as a fade of an intraday bounce. But as the bounce continued, I searched for additional news. Briefing.com reported on buyout rumors. While DPZ has been the object of numerous such rumors over the years, the latest rumor seemed to sufficiently explain the rebound. So when DPZ turned green on the day, I changed my trade to a strangle (put and call) to play a potentially big move either up (rumor true) or down (rumor false). Today, the stock closed up 4.1% in a display of relative strength. It closed at an all-time high on strong volume and was up as much as 6.6%. This is a stock to watch. Well, it has actually been a stock to watch for years given it traded below $3 a little over 9 years ago!
Trades related to previous posts: almost 2 weeks ago sold shares in iPath Bloomberg Coffee SubTR ETN (JO) ahead of dissolution of ETN,
— – —
FOLLOW Dr. Duru’s commentary on financial markets via email, StockTwits, Twitter, and even Instagram!
“Above the 40” uses the percentage of stocks trading above their respective 40-day moving averages (DMAs) to assess the technical health of the stock market and to identify extremes in market sentiment that are likely to reverse. Abbreviated as AT40, Above the 40 is an alternative label for “T2108” which was created by Worden. Learn more about T2108 on my T2108 Resource Page. AT200, or T2107, measures the percentage of stocks trading above their respective 200DMAs.
Active AT40 (T2108) periods: Day #6 over 20%, Day #2 under 30%, Day #13 under 40%, Day #13 under 50%, Day #14 under 60%, Day #20 under 70%
Daily AT40 (T2108)
")
Black line: AT40 (T2108) (% measured on the right)
Red line: Overbought threshold (70%); Blue line: Oversold threshold (20%)
Weekly AT40 (T2108)

*All charts created using freestockcharts.com unless otherwise stated
The charts above are my LATEST updates independent of the date of this given AT40 post. For my latest AT40 post click here.
Related links:
The AT40 (T2108) Resource Page
You can follow real-time T2108 commentary on twitter using the #T2108 or #AT40 hashtags. T2108-related trades and other trades are occasionally posted on twitter using the #120trade hashtag.
Be careful out there!
Full disclosure: short VXX, long SPY call spread, long DPZ call and put, long TGT
*Charting notes: FreeStockCharts.com uses midnight U.S. Eastern time as the close for currencies. Stock prices are not adjusted for dividends.