
AT40 = 72.0% of stocks are trading above their respective 40-day moving averages (DMAs) – overbought day #12
AT200 = 60.1% of stocks are trading above their respective 200DMAs
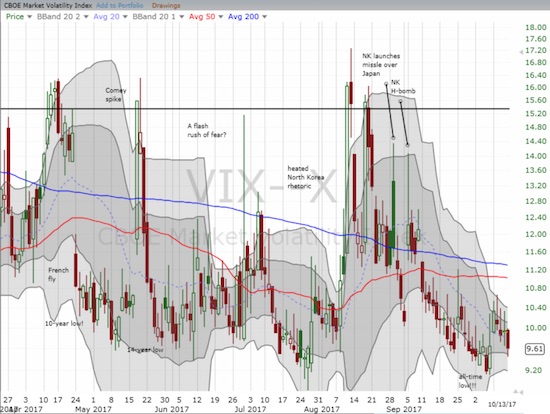
VIX = 9.6
Short-term Trading Call: bullish
Commentary
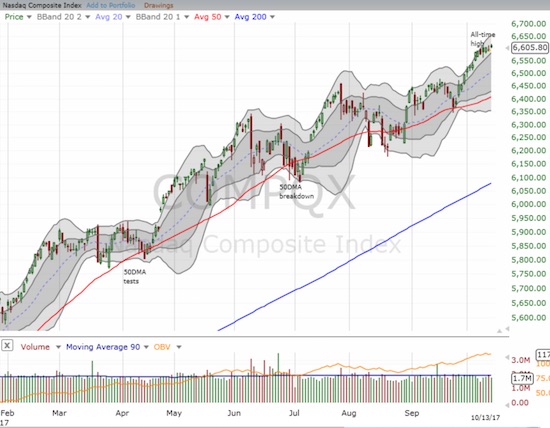
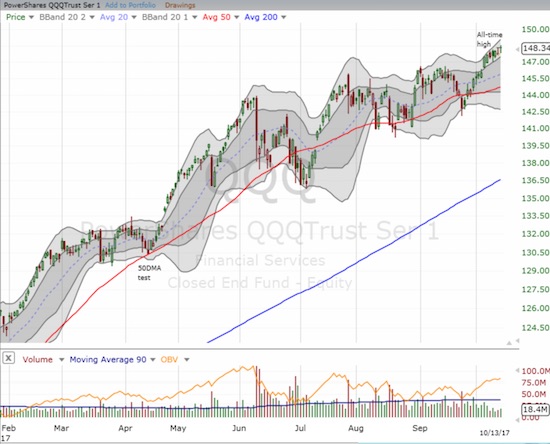
A week ago I described “lift-off” for an extended overbought period for the stock market. However, the market failed to follow-up as the S&P 500 (SPY) only gained 4 points, the NASDAQ gained 15 points, and the PowerShares QQQ ETF (QQQ) could not even gain a point.
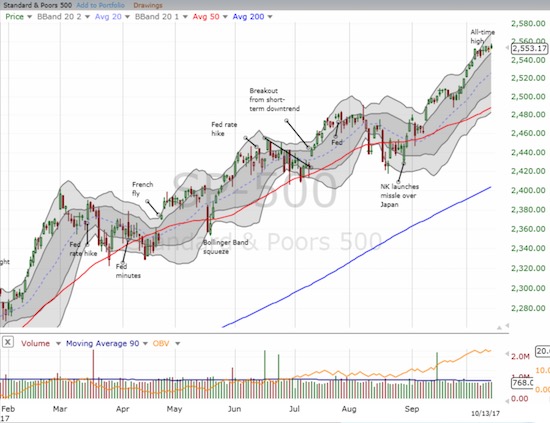
Moreover, AT40 (T2108), the percentage of stocks trading above their respective 40-day moving averages (DMAs), drifted downward from 73.8% to 72.0%. AT40 is back to the edge of overbought territory. The volatility index, the VIX, started to show more excitement with a gap up on Monday but, as usual, the volatility faders got busy and managed to push the VIX all the way back to flat for the week.
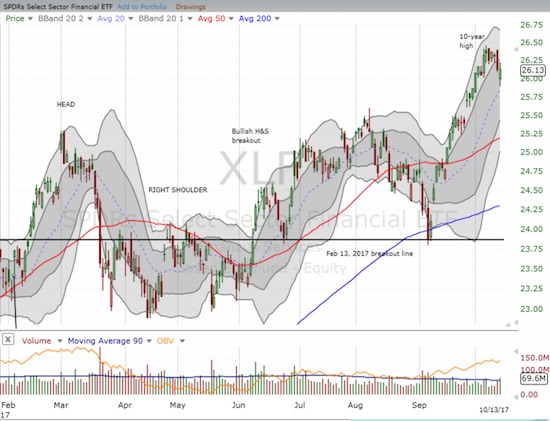
The financials were a big disappointment. The Financial Select Sector SPDR ETF (XLF) came off a 10-year high as key bank earnings failed to inspire the market. More key earnings form financials are coming this week. I am particularly on watch for Goldman Sachs (GS) and Morgan Stanley (MS).
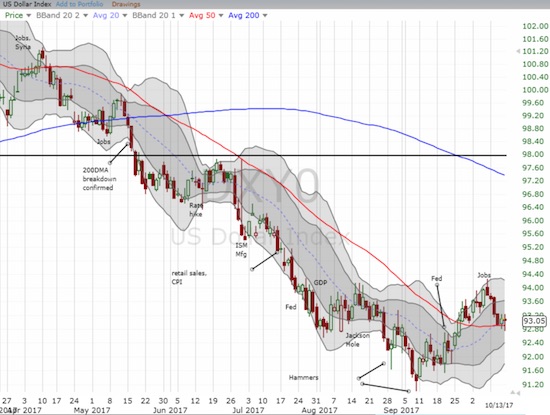
The U.S. dollar is of interest as well as it tests 50DMA support. The dollar weakened after the jobs report for September. I am looking for a bounce from its current level.
STOCK CHART REVIEWS
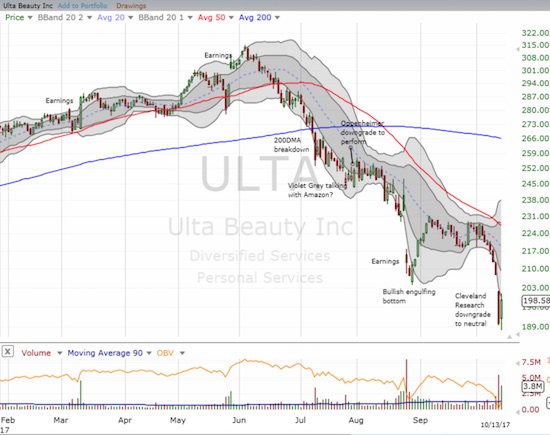
Ulta Beauty (ULTA)
Last Thursday, I noted ULTA had become ultra ugly. I put in a new trade as a hedge because ULTA looked very oversold. Sure enough, buyers rushed into ULTA on Friday. At the highs, ULTA reached Thursday’s open. I used the surge to lock in profits on my call option. So, at worst, I partially paid for a bet on an eventual continuation in the selling.
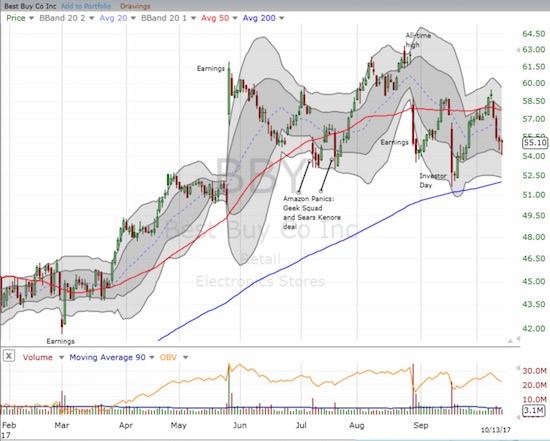
Best Buy (BBY)
BBY ended the previous week with a promising breakout above its 50DMA. Yet, it was another case where I felt a hedged play was the best way to go. I overloaded a bit on calls since it seemed the odds favored a continuation of upward momentum. Remarkably, BBY turned right around and sold off for the week. I decided to lock in profits on the puts so that I have the call options partially covered. If BBY breaks below the low for last week, I may short shares to ride what should next be a test of 200DMA support.
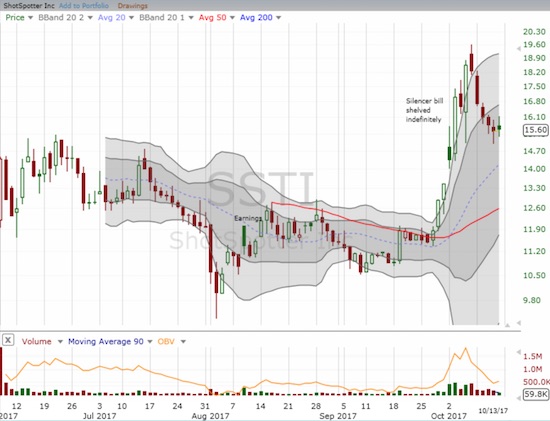
ShotSpotter (SSTI)
SSTI provides a great example of how I move differently for short-term versus longer-term trades. Almost two weeks ago, I wrote about SSTI after a great catalyst from Congress. The stock was short-term overbought but managed to push a bit higher. Normally, I would have sold my position somewhere along this rally. However, given my longer-term analysis suggests that SSTI could trade one day a lot higher, I held my position. As I would expect under normal circumstances, SSTI cooled off. So much so, that the gain from the Congress-inspired surge is now almost entirely gone. With buyers pulling SSTI off its lows three days in a row and slowing the selling momentum, I added to my position. From a fundamental standpoint, it turns out that silencers are probably not as big a deal for SSTI as I thought. So this pullback makes even more sense.
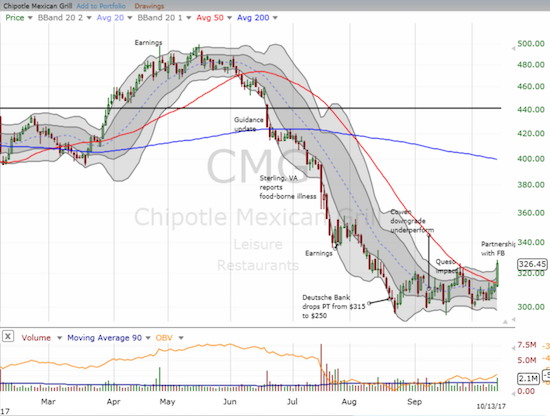
Chipotle Mexican Grill (CMG)
On Friday, CMG surged 3.9% on news of a partnership with Facebook for direct food ordering. I was surprised at the strength of the move, especially given other restaurants did not benefit nearly as much. However, CMG is heavily shorted (18% of float) and has shaken out a lot of sellers, so the reaction could be part of a trigger-finger rush to buy. Still, I cannot ignore the 50DMA breakout on strong volume at the tail-end of a 2-month long base formation. So, I bought a few shares which I will drop if CMG makes new lows. I will also look for my next entry for call options.
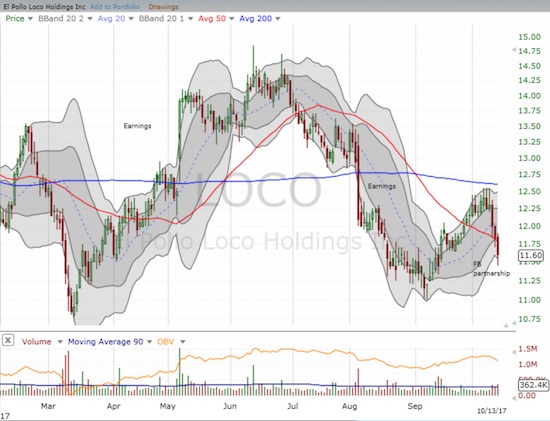
One of the restaurants partnered up with Facebook is El Polo Loco Holdings (LOCO). LOCO received zero love as it lost 1.7% on the day on heavy trading volume. This looks like a great time for another round of speculation on shares as a part of the “chicken trade” I wrote about earlier this year.
Intel (INTC)
All eyes on semiconductors! INTC goes in my “big miss” bucket. I typically play INTC between earnings, but I sold my last tranche of calls as INTC bounced from a 50DMA breakdown to a 200DMA test. I failed to buy the 200DMA breakout and did not move when INTC surged above August’s high. This neglect is called plain ol’ “not paying attention!”
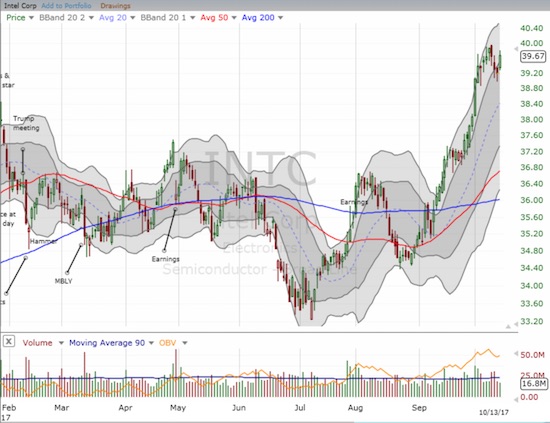
If earnings impress this month, or at least do not disappoint, I will have to start accumulating a longer-term position. INTC is “cheap” with a 15.1 trailing P/E, 12.8 forward P/E, and a 2.8% dividend yield.
— – —
FOLLOW Dr. Duru’s commentary on financial markets via email, StockTwits, Twitter, and even Instagram!
“Above the 40” uses the percentage of stocks trading above their respective 40-day moving averages (DMAs) to assess the technical health of the stock market and to identify extremes in market sentiment that are likely to reverse. Abbreviated as AT40, Above the 40 is an alternative label for “T2108” which was created by Worden. Learn more about T2108 on my T2108 Resource Page. AT200, or T2107, measures the percentage of stocks trading above their respective 200DMAs.
Active AT40 (T2108) periods: Day #412 over 20%, Day #226 over 30%, Day #26 over 40%, Day #25 over 50%, Day #21 over 60%, Day #12 over 70% (overbought)
Daily AT40 (T2108)
")
Black line: AT40 (T2108) (% measured on the right)
Red line: Overbought threshold (70%); Blue line: Oversold threshold (20%)
Weekly AT40 (T2108)

*All charts created using freestockcharts.com unless otherwise stated
The charts above are my LATEST updates independent of the date of this given AT40 post. For my latest AT40 post click here.
Related links:
The T2108 Resource Page
You can follow real-time T2108 commentary on twitter using the #T2108 or #AT40 hashtags. T2108-related trades and other trades are occasionally posted on twitter using the #120trade hashtag.
Be careful out there!
Full disclosure: long CMG, long SSTI, long BBY calls, long ULTA put, long XLF calls, long UVXY calls
*Charting notes: FreeStockCharts.com uses midnight U.S. Eastern time as the close for currencies. Stock prices are not adjusted for dividends.