AT40 = 68.2% of stocks are trading above their respective 40-day moving averages (DMAs) (high of 69.4%)
AT200 = 57.2% of stocks are trading above their respective 200DMAs
VIX = 10.2
Short-term Trading Call: cautiously bullish
Commentary
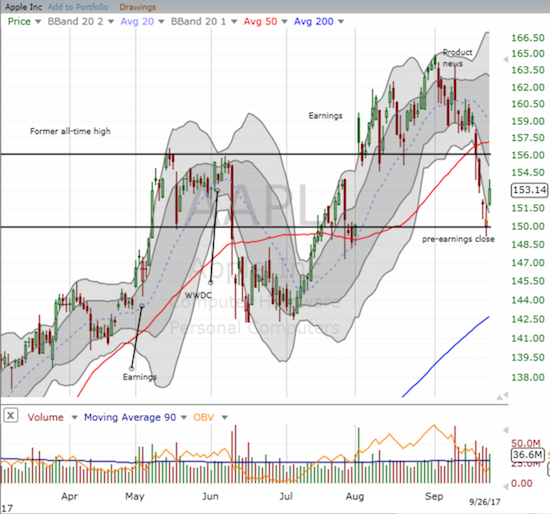
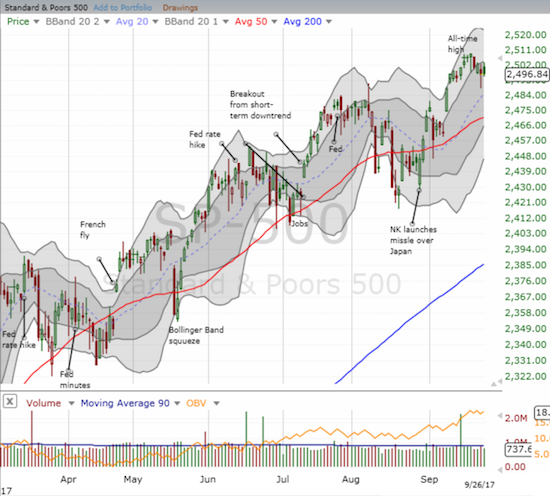
In my last Above the 40 post, I noted how the stock market bent but stubbornly refused to break after Apple (AAPL) fell from the tree. Two trading days later, AAPL staged a classic rebound after completing a reversal of its post-earnings gap up. Yet, the day’s gain of 1.7% was met with an S&P 500 (SPY) which yawned and closed flat.


The jump in AAPL was also notable because big cap tech stocks, many of the usual suspects, tumbled hard the day before. It almost looked like AAPL’s fall finally triggered sympathetic and synchronized sell programs. The NASDAQ cracked its support at its 50-day moving average (DMA) but bounced back. The PowerShares QQQ ETF (QQQ) was not so lucky as it opened Monday trading below 50DMA support and still trades there. While I failed to add to my AAPL calls on Monday (by design), I did buy three of the usual suspects: Facebook (FB), Netflix (NFLX), Amazon.com (AMZN). I topped off the buying with NVIDIA (NVDA) on Tuesday. On the flip side, I locked in profits on my last tranche of AAPL call options.
AT40 (T2108), the percentage of stocks trading above their respective 40DMAs, added mightily to the intrigue. While Monday felt like sellers were getting serious, AT40 jumped to its highest close in two months. AT40 followed that up with a close encounter with the overbought threshold of 70%. In other words, the underlying health of the market IMPROVED even as big cap tech stocks swooned. If what happened was just another of those rotations, the return of money to scoop up the dips in big cap tech could finally push AT40 into overbought territory for the first time since January of this year – all at a time that is supposed to be seasonally weak for stocks.
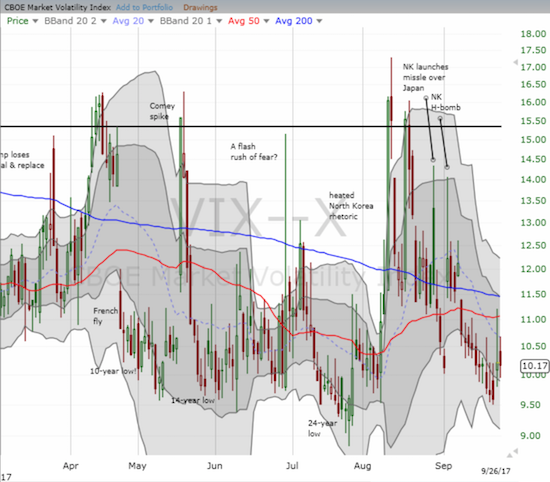
On Monday, the volatility index, (the VIX), briefly came to life. The VIX gapped up and the throngs of volatility sellers went right to work. However, another hour later, the VIX quickly rallied until midway through lunch when the volatility sellers took control once more. The VIX ended the day near its open. On Tuesday, the VIX staged a much smaller rally and was, again, met with sellers.

Interestingly, traders took note of a big volatility trade on Tuesday. A large block crossed in the VIX futures on an October/December calendar spread that protects against trouble in October. I am guessing his trade was likely a hedge rather than a prediction of trouble. The video below from Business First: Stocking Up describes the trade.
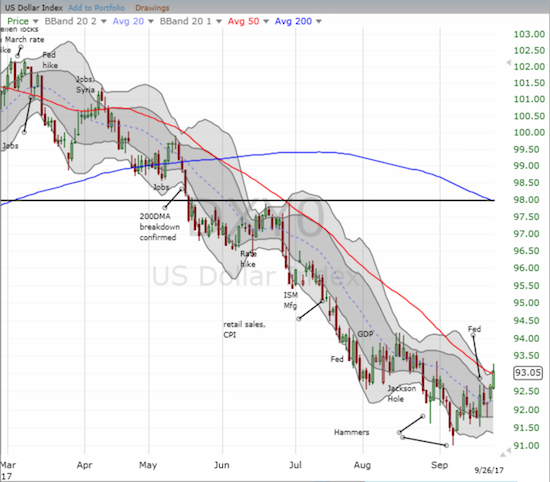
I need to update the outlook on precious metals as the landscape has quickly shifted again. For now, I offer a very brief note. SPDR Gold Shares (GLD) is trying to hold upward trending 50DMA support while the iShares Silver Trust (SLV) broke its 50DMA support. In the past week, the precious metals were weighed down by an announcement on U.S. monetary policy that the market interpreted as a bit hawkish. On Monday, the precious metals spiked higher along with the VIX but were able to hold onto their gains until the next day. A chart of the U.S. dollar says a LOT. The U.S. dollar index cracked its downtrending 50DMA resistance for the first time since April. A quick look at various dollar pairs gives me the impression that the dollar may actually be forming a bottom here – I am particularly a lot less short-term bullish on the euro as EUR/USD cracked 50DMA support starting last Friday. Stay tuned!

— – —
FOLLOW Dr. Duru’s commentary on financial markets via email, StockTwits, Twitter, and even Instagram!
“Above the 40” uses the percentage of stocks trading above their respective 40-day moving averages (DMAs) to assess the technical health of the stock market and to identify extremes in market sentiment that are likely to reverse. Abbreviated as AT40, Above the 40 is an alternative label for “T2108” which was created by Worden. Learn more about T2108 on my T2108 Resource Page. AT200, or T2107, measures the percentage of stocks trading above their respective 200DMAs.
Active AT40 (T2108) periods: Day #399 over 20%, Day #213 over 30%, Day #13 over 40%, Day #12 over 50%, Day #8 over 60% (overperiod), Day #159 under 70%
Daily AT40 (T2108)

Black line: AT40 (T2108) (% measured on the right)
Red line: Overbought threshold (70%); Blue line: Oversold threshold (20%)
Weekly AT40 (T2108)

*All charts created using freestockcharts.com unless otherwise stated
The charts above are my LATEST updates independent of the date of this given AT40 post. For my latest AT40 post click here.
Related links:
The T2108 Resource Page
You can follow real-time T2108 commentary on twitter using the #T2108 or #AT40 hashtags. T2108-related trades and other trades are occasionally posted on twitter using the #120trade hashtag.
Be careful out there!
Full disclosure: long NVDA call option, long AMZN call spread, long and short various dollar currency pairs, long NFLX call option, long GLD, long SLV, long FB calls
*Charting notes: FreeStockCharts.com uses midnight U.S. Eastern time as the close for currencies. Stock prices are not adjusted for dividends.
