
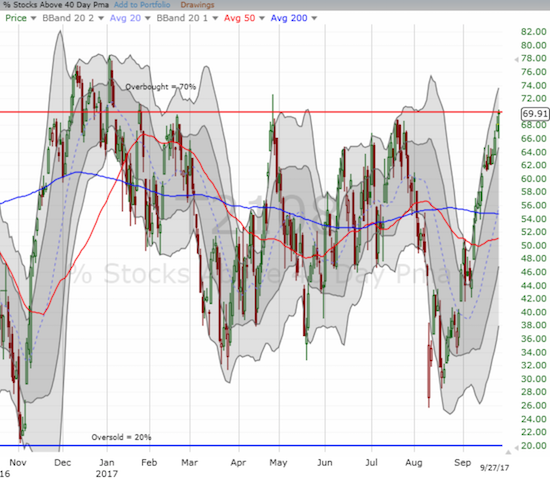
AT40 = 69.9% of stocks are trading above their respective 40-day moving averages (DMAs)
AT200 = 58.8% of stocks are trading above their respective 200DMAs
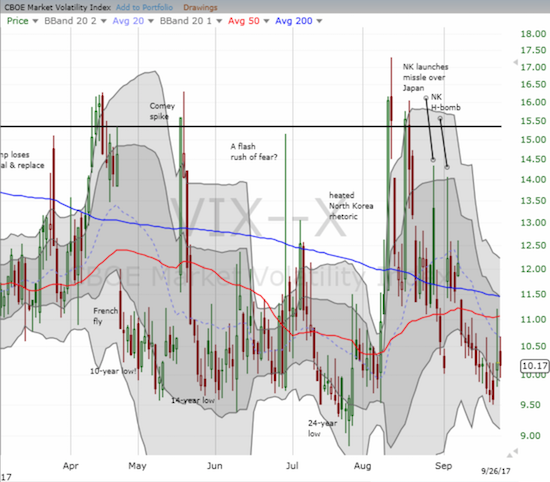
VIX = 9.9
Short-term Trading Call: cautiously bullish
Commentary
This was one of those days where I have to assume some trading algorithm is having fun with technical indicators.
AT40 (T2108), the percentage of stocks trading above their respective 40-day moving averages (DMA), closed exactly at 69.91%. My favorite technical indicator stopped just short of the 70% threshold that defines overbought trading conditions. AT40 crossed 70% several times during the trading day.
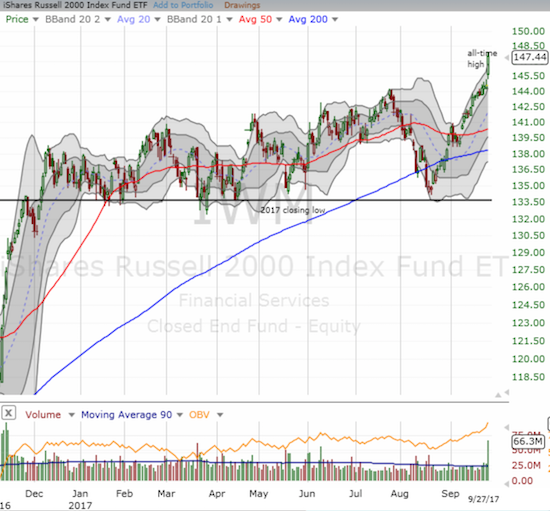
While I wait to upgrade my short-term trading call from cautiously bullish, small cap stocks signaled a confirmation of the underlying strength in the market. The iShares Russell 2000 ETF (IWM) soared 2.0% and closed at a fresh all-time high.
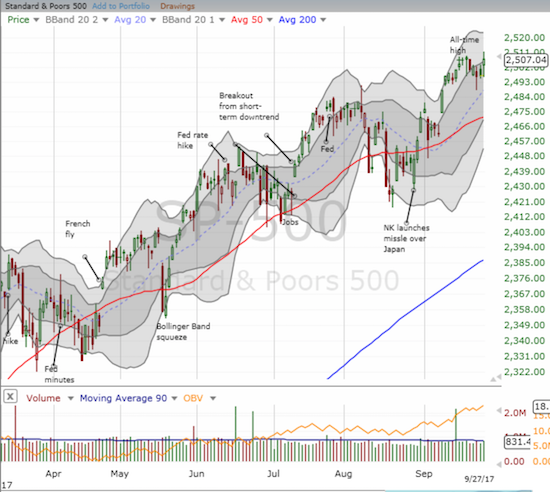
The S&P 500 (SPY) was content to let small caps hog the spotlight. At its high of the day, the index made a new marginal all-time high, but it closed just below that high.
The volatility index, the VIX, added its confirmation of the bullish tone by dropping below 10 again. I have not yet reset my timeline for the duration of the bullish implications of extremely low volatility, but at the current rate the market will not be “due” for even a 5% pullback until next Spring or later!
With September set to go out on a relatively benign, even bullish note, October stands ominously ahead as the last of the three seasonally weak months for the stock market. The month will be filled with news vying to be catalysts for market angst and celebrations: from North Korea to tax reform to the economic costs and recovery from one major natural disaster after another. All eyes and prayers are on Puerto Rico now. The latest issue: a shortage of money – hard cash. If you have not done so already, please consider donating a small portion of your trading/investing profits (or even your time) to at least one of the several on-going relief efforts.
Tweets by NationalVOAD
— – —
FOLLOW Dr. Duru’s commentary on financial markets via email, StockTwits, Twitter, and even Instagram!
“Above the 40” uses the percentage of stocks trading above their respective 40-day moving averages (DMAs) to assess the technical health of the stock market and to identify extremes in market sentiment that are likely to reverse. Abbreviated as AT40, Above the 40 is an alternative label for “T2108” which was created by Worden. Learn more about T2108 on my T2108 Resource Page. AT200, or T2107, measures the percentage of stocks trading above their respective 200DMAs.
Active AT40 (T2108) periods: Day #400 over 20%, Day #214 over 30%, Day #14 over 40%, Day #13 over 50%, Day #9 over 60% (overperiod), Day #160 under 70%
Daily AT40 (T2108)
")
Black line: AT40 (T2108) (% measured on the right)
Red line: Overbought threshold (70%); Blue line: Oversold threshold (20%)
Weekly AT40 (T2108)

*All charts created using freestockcharts.com unless otherwise stated
The charts above are my LATEST updates independent of the date of this given AT40 post. For my latest AT40 post click here.
Related links:
The T2108 Resource Page
You can follow real-time T2108 commentary on twitter using the #T2108 or #AT40 hashtags. T2108-related trades and other trades are occasionally posted on twitter using the #120trade hashtag.
Be careful out there!
Full disclosure: long NVDA call option, long AMZN call spread, long and short various dollar currency pairs, long NFLX call option, long GLD, long SLV, long FB calls
*Charting notes: FreeStockCharts.com uses midnight U.S. Eastern time as the close for currencies. Stock prices are not adjusted for dividends.