
AT40 = 49.5% of stocks are trading above their respective 40-day moving averages (DMAs)
AT200 = 55.6% of stocks are trading above their respective 200DMAs
VIX = 10.4 (volatility index)
Short-term Trading Call: cautiously bullish
Commentary
Here we go again.
Last week, the S&P 500 slipped but did not fall off the edge. In my “Above the 40” post describing the trading action, I recounted the multitude of times this year that AT40 (T2108) – the percentage of stocks trading above their respective 40-day moving averages (DMAs) – faded from overbought conditions and the nature of the subsequent selling. AT40 has faded again, and again the nature of the selling is different from past episodes. The S&P 500 did not respond to the first fade, but took a quick intraday dive on the same day as the second fade. AT40 has continued to slide since then, yet the S&P 500 is holding firm.
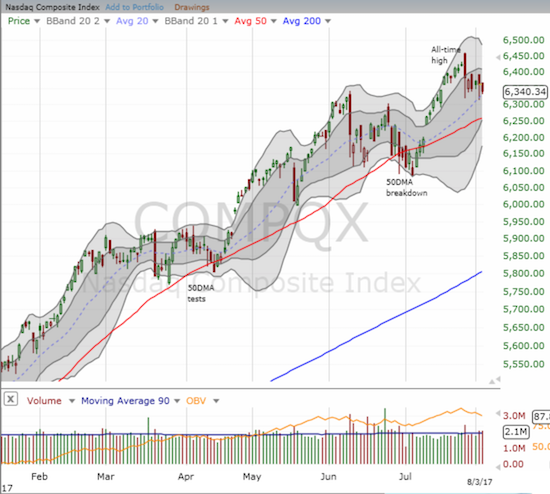
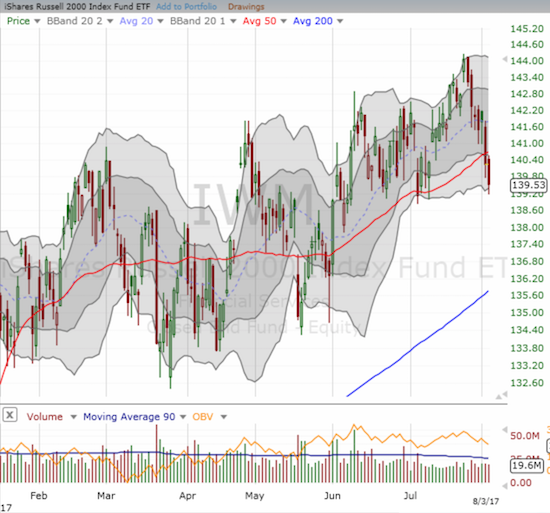
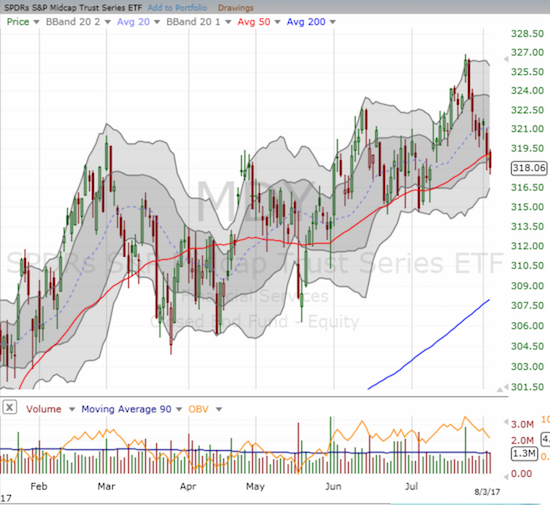
In fact, AT40 has slipped all the way from 66.8% to 49.5% while BOTH the S&P 500 and the NASDAQ have held their ground; ditto for the PowerShares QQQ Trust (QQQ) which has a chart similar to the NASDAQ. It appears small caps and mid-caps are suffering the brunt of the current selling pressure.
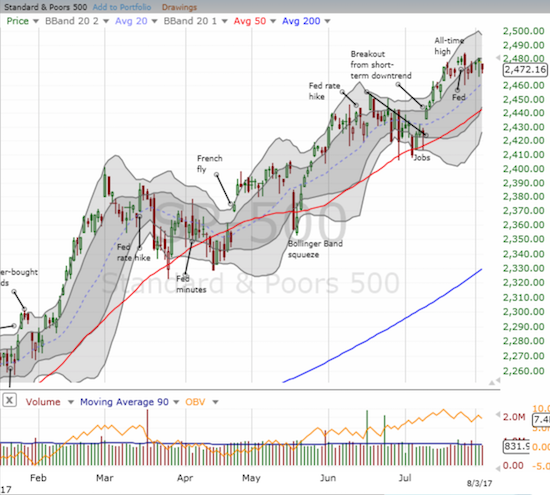
The danger level as measured by the volatility index, the VIX, has barely come off the recent 24-year closing low and all-time intraday lows.
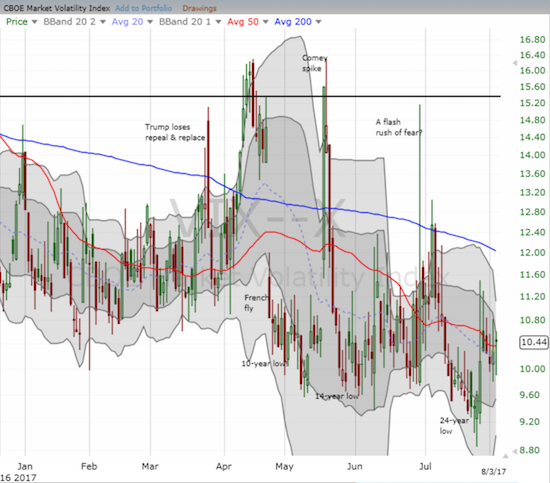
With volatility so low and AT40 sinking into a bearish divergence with the S&P 500, I decided the time was ripe to get back into buying call options on ProShares Ultra VIX Short-Term Futures ETF (UVXY). Since I am keeping my short-term trading call at “cautiously bullish,” I consider this trade as a hedge and NOT a bet on a big bearish outcome. In other words, I will be treating dips in the short-term as buying opportunities and not just confirmation of my earlier claim that the S&P 500 has precious little additional upside from here for the next few months. My UVXY call option expires in 2 weeks. Over the next week I will add to it if it gets cheaper. I currently plan to continue this roughly 2 week cycle through October.
With the major indices holding their ground so far, AT40 could swing toward oversold levels very quickly without much additional selling. In other words, I find it difficult to get bearish under these conditions. Come September, I will likely change my tune. Recall that my last projection for a significant pullback timed such a move for September. The analysis was based on the surprisingly (short-term) bullish implications of extremely low volatility.
Now some drama in individual stocks…
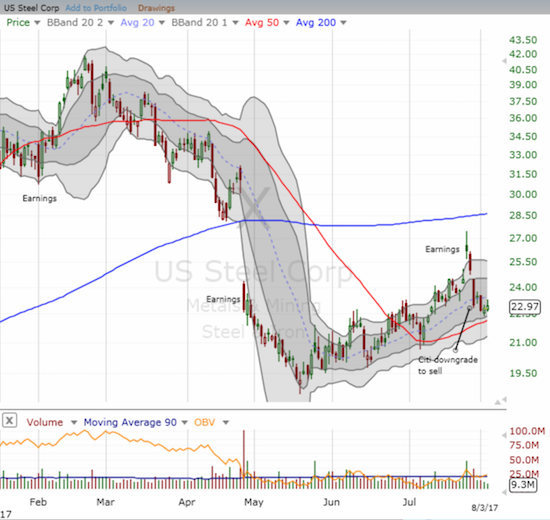
U.S. Steel (X)
As I expected last week, X sellers have pushed the stock into a retest of 50DMA support. I like a speculative buy here. I will even tolerate a small breach of the 50DMA under the assumption that the July low will hold.
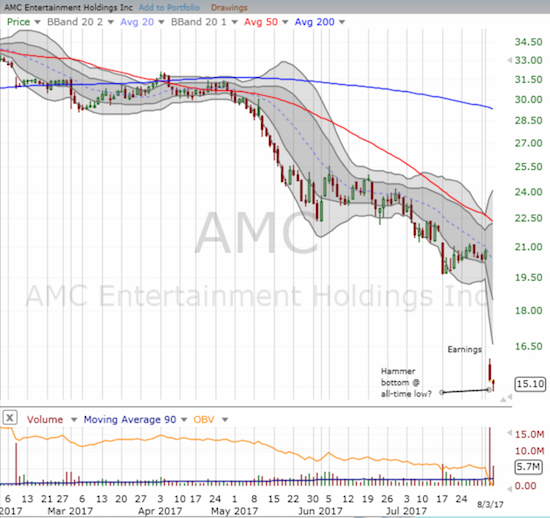
AMC Entertainment Holdings (AMC)
Investors trashed AMC after it reported earnings this week. I considered a buy based on the close so far below the lower-Bollinger Band (BB), but the all-time lows dissuaded me. In after hours AMC released news that it authorized a $100M buyback. Suddenly, this stock looks like low-hanging fruit for a major reversal and recovery. I will be making a move to buy quickly. With shorts comprising 19% of the float, I think there is plenty of rocket fuel here.
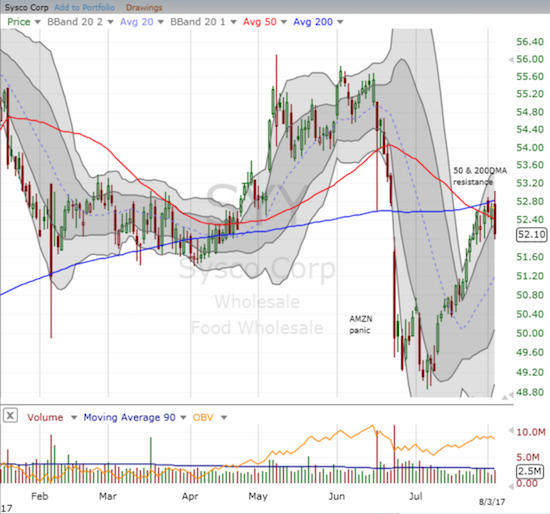
Sysco Corporation (SYY)
“Amazon Panic” is receding fast for many stocks. SYY is a stock I pounced on in the immediate wake of an Amazon Panic by first buying shares (which I have since sold for a profit) and then selling a put option. I am likely to keep holding the put option through at least the next earnings report (August 14th) at which time I expect a lot more premium to implode.
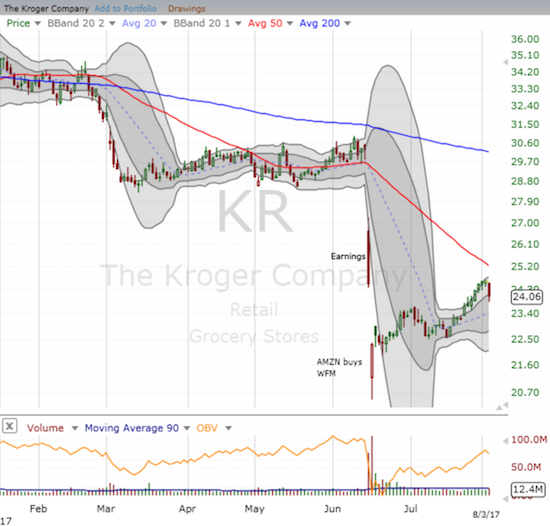
Kroger (KR)
Like SYY, KR recently overcame Amazon Panic. However, the stock has an even bigger challenge in making a dent on its initial post-earnings loss. I see lots of potential upside, so I am going to keep holding the put option I sold short. KR made such a clean bottom that I never got the opportunity to accumulate a larger position at cheaper prices.
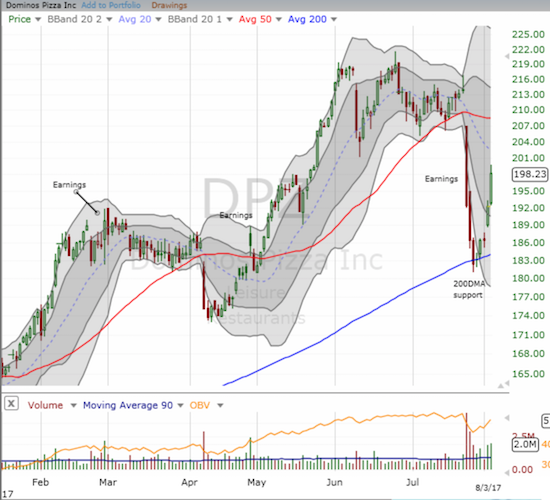
Dominos Pizza (DPZ)
DPZ put on a technical clinic. The stock bounced near perfectly off the 200DMA support that I noted last week and delivered my second best trade of the week. I locked in profits on my call options with the stock up another 2.5% on the day and ended up leading yet more money on the table as DPZ closed with a 3.1% gain (an 8.2% gain since the 200DMA test).
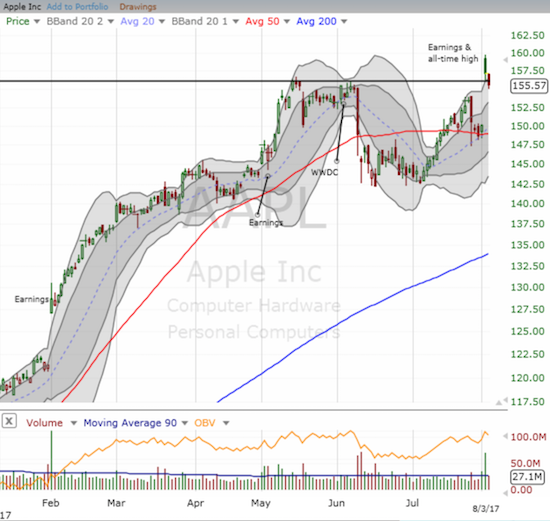
Apple (AAPL)
AAPL was my best trade of the week and one of my best of the year (similar in magnitude to the trade on Whole Foods Market (WFM)). I returned to trading the stock from the bullish side just in time. My latest tranche started as a pre-earnings trade. A bit surprised by the continued weakness on Monday, I decided to triple down on the position (from one to three call options): the previous week’s sell-off still looked overdone to me. I managed to grit my teeth and hold even as the position soared back to even going into the pre-earnings close. AAPL gapped up around 6% the next day, and I quickly locked in my profits. Sellers have since taken the stock through the previous all-time high as all the usual suspects have stumbled in recent days. Note that AAPL’s gap up is exaggerated by the near panic selling the stock experienced going into earnings. That pullback made a post-earnings surge all the more likely.
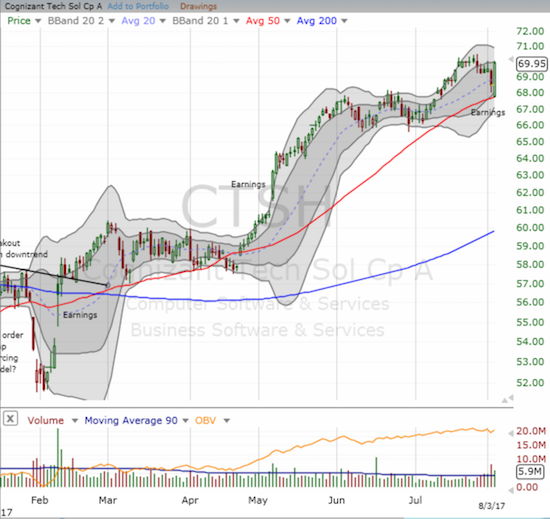
Cognizant Technology (CTSH)
I hoped that CTSH could become more than a quick trade, and the stock has delivered nicely. Its stellar performance has encouraged me to keep holding five months and running. CTSH performed well after reporting earnings. The stock cleanly reversed the previous day’s loss by bouncing off 50DMA support and printing a bullish engulfing pattern.
Next up, the U.S. jobs report!
— – —
FOLLOW Dr. Duru’s commentary on financial markets via email, StockTwits, Twitter, and even Instagram!
“Above the 40” uses the percentage of stocks trading above their respective 40-day moving averages (DMAs) to assess the technical health of the stock market and to identify extremes in market sentiment that are likely to reverse. Abbreviated as AT40, Above the 40 is an alternative label for “T2108” which was created by Worden. Learn more about T2108 on my T2108 Resource Page. AT200, or T2107, measures the percentage of stocks trading above their respective 200DMAs.
Active AT40 (T2108) periods: Day #370 over 20%, Day #184 over 30%, Day #51 over 40%, Day #1 under 50% (underperiod ending 19 days over 50%), Day #7 under 60%, Day #130 under 70%
Daily AT40 (T2108)
")
Black line: AT40 (T2108) (% measured on the right)
Red line: Overbought threshold (70%); Blue line: Oversold threshold (20%)
Weekly AT40 (T2108)

*All charts created using freestockcharts.com unless otherwise stated
The charts above are my LATEST updates independent of the date of this given AT40 post. For my latest AT40 post click here.
Related links:
The T2108 Resource Page
You can follow real-time T2108 commentary on twitter using the #T2108 or #AT40 hashtags. T2108-related trades and other trades are occasionally posted on twitter using the #120trade hashtag.
Be careful out there!
Full disclosure: long CTSH, long UVXY call option, short KR put option, short SYY put option
*Charting notes: FreeStockCharts.com uses midnight U.S. Eastern time as the close for currencies.
Hi Dr,
I read most of your published blog and i noticed from last more than a month one line in every blog:
Short-term Trading Call: cautiously bullish
I cant see cauiously here , everytime after reading weekly or published article dow is fly high infact record high.
TIme to develop another tool but please let us know if you can figure out anything.
THanks,
Brijesh Patel
Maybe some pullback here but I think the reflation trade looks to have legs until year end so US Steel may have legs.
Took a punt on the dollar weakness meme having a pullback and shorted eur.usd into NFP. Will collect on that next week.
With nzd.usd, I am starting to think rbnz does hike in the next 6 minutes months after the election. So only a small punt shorting nzd.usd before the election. Unfortunately, despite the large spec positioning, the ducks don’t like be up for a large short position,even with the election.
What I have my eyes on is usd.jpy. I am waiting for some dollar strength to buy yen. One of 2 things will happen- either the BoJ will go crazy and print bonds or they will scale back QE. An ex-BOJ board member commented that they will run out of business nds to buy mid next year without outright make money printing. My thought is they will not resort to the latter as they haven’t to date and there certainly isn’t any need currently. If they do make money print UJ would go back to 125 and beyond. With QE tapering, possibly 90, without risk aversion. The icing is that spec positioning is still moderately short yen and structurally very short. Also if there is any risk aversion in the period, that would be a big bonus. I am looking to buy yen with the overdue pullback in dollar weakness next week.
Excuse the grammatical and word errors. Damn spellchecker
One thing the CB’s have sorted this time compared to 2014 is that they will probably organise coordinated hikes with fed tightening to prevent dollar strength. Nobody really wants too much dollar strength as it reduces liquidity and that causes EM and Chinese problems.
The Chinese have added to deficit spending and juiced up growth in the last 6 months. The Feds end of the bargain would be to reduce balance sheet before hiking rates. ROW would be expected to coordinate hiking to prevent dollar strength, particularly ECB. Can’t see why this doesn’t play out for a while as it is also in each individual countries best interests
Good observation, Brijesh. My caution has to do with my expectation of a pullback in September. I will have to clarify that from time-to-time. I am avoiding getting bearish until the sellers actually prove something. I am avoiding going to bullish until the buyers display something more definitive.
Note that I do not follow the Dow as it is not representative of the stock market, and its pricing formula is out-dated and misleading.
SN – the pullback I am expecting should be a buying opportunity. But I am willing to see how the general context looks at the time.
Nice trade on shorting EUR/USD! I was late to that game. I am surprised you didn’t take profits. I think USD weakness will pick back up soon.
I like the yen trade as a double-play on CB action and some coming risk aversion. I have also been focusing more on yen longs. But I am long USD/JPY as a double-hedge against my on-going USD bearishness and my thinking yen weakness is overdone.
I am still not sure about the notion of worldwide CB coordination except during crisis situations. But it makes sense that dollar strength is not in the interest of too many!
As always, god luck on the NZD trades!
Unfortunately, I went to bed before NFP so didn’t have a chance to close earlier but did so in the early Asian session. I actually reentererd short around 1.1805 again because I think this countertrend may be had at least a few days.
Too many people are extrapolating the recent move to eur.usd 1.30. The recent NFP and euro data is actually quite usd positive. I think eur is safe to short from 1.18 to 1.2.
1.2 should be a major battle ground
I think the Friday NFP and an in line CPI reading this week will seal the deal for balance sheet reduction. This will start to be anticipated in the Sept 19 FOMC and there will start to be pricing it gets announced then.
I had thought this would be a non event but with the peaking in euro PMI’s, there could be a significant dollar rally. I am looking to hold a short euro position for 1-2 weeks. Also this recent dollar weakness has been non stop for 4 weeks and is due for a pullback.
EUR/USD at 1.30 is way too high under current conditions. Need to see evidence of a major recovery underway in the eurozone and/or a Fed that declares it is done with tightening for 3 years!