
(T2108 measures the percentage of stocks trading above their respective 40-day moving averages [DMAs]. It helps to identify extremes in market sentiment that are likely to reverse. To learn more about it, see my T2108 Resource Page. You can follow real-time T2108 commentary on twitter using the #T2108 hashtag. T2108-related trades and other trades are occasionally posted on twitter using the #120trade hashtag. T2107 measures the percentage of stocks trading above their respective 200DMAs)
T2108 Status: 64.9% (ends 7-day overbought period)
T2107 Status: 62.7%
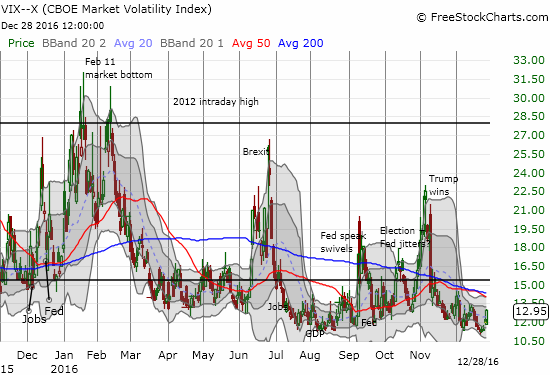
VIX Status: 13.0
General (Short-term) Trading Call: cautiously bearish
Active T2108 periods: Day #215 over 20%, Day #35 over 30%, Day #34 over 40%, Day #32 over 50%, Day #26 over 60% (overperiod), Day #1 under 70% (underperiod, ended 7-day overbought period)
Commentary
Suddenly the trading environment looks a lot less benign than what I was expecting for the Santa Claus rally period.
As I noted in the last T2108 Update, the market’s enthusiasm notably waned going into the Santa Claus rally period. Today’s drop in the market essentially confirms that enthusiasm has disappeared. The S&P 500 (SPY) dropped 0.8% to close at a near 3-week low.
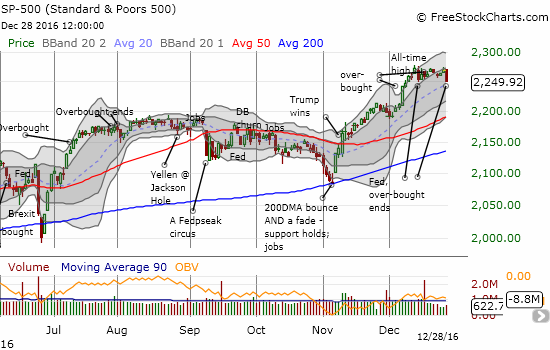
While trading volume was as low as ever (typical for the holiday period), I cannot ignore the warning signals now emanating brighter from T2108, the percentage of stocks trading above their 40-day moving averages (DMAs), and T2107, the percentage of stocks trading above their 200-day moving averages (DMAs). T2108 fell to 64.9% and ended what was a 7-day overbought period. This is the second sharp drop from overbought conditions in December, and the last overbought period was quite weak. The S&P 500 managed to lose 0.9% over this time. T2107 is yet more ominous as it has trended downward since December’s high – a high that fell far short of 2016’s high and printed right at the former post-recession downtrend line.

Even the volatility index, the VIX, perked up and took note.
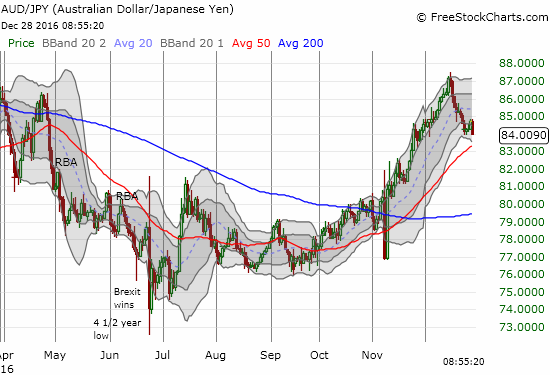
The Japanese yen (FXY) gained more strength on the day and sealed my bearish interpretation of the trading action. In particular, the Australian dollar (FXA) against the yen, AUD/JPY, declined sharply in a move that resumes the drop toward a critical test of 50DMA support.
Connecting all the dots, I triggered my T2108 trading rules for overbought conditions and flipped the short-term trading call to cautiously bearish. I am not outright bearish because of 1) the light trading volume and 2) the S&P 500 is still clinging to the bottom of a brief consolidation period. I will not flip this trading call even to neutral until/unless the index makes a new all-time high.
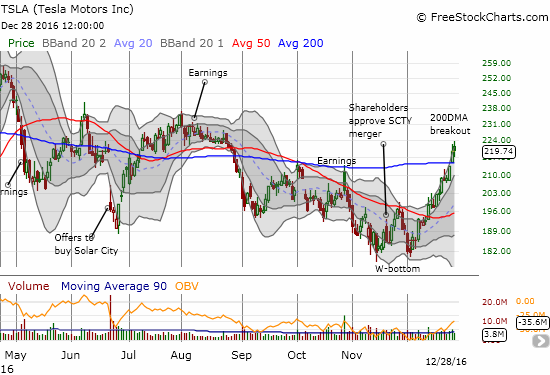
Ironically, Tesla Motors (TSLA) broke through 200DMA resistance in a very bullish move and held that breakout today. In my last T2108 Update, I promised to follow TSLA in the direction of this critical test. Yet, I now find myself torn by the bearish trading call…so now I wait a little-bit-longer.
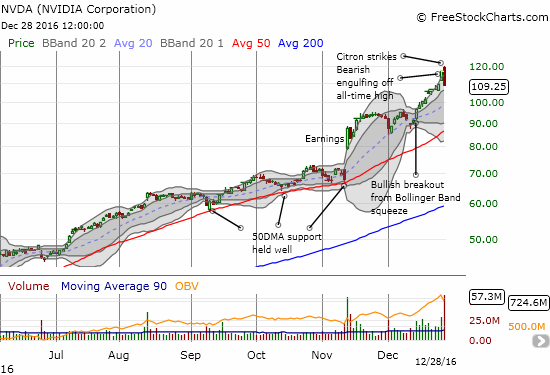
Nvidia (NVDA) was probably the chart of the day. The stock has had a monster gain this year (231% year-to-date) and the buying resumed in near relentless form after the last earnings announcement. However, today, an ominous sign appeared. On a day featuring light trading volume for the stock market, sellers came out in droves on NVDA to the tune of a 6.9% loss. Trading volume was almost 5 times the 90-day moving average; a move that provided an exclamation mark on a long string of post-earnings trading days with above average volume.
Technically, NVDA produced a bearish engulfing pattern that signaled a major top especially since it came off an all-time high. A bearish engulfing pattern occurs when a stock opens above the high of the previous day and closes below the low of the previous day. At the end of an uptrend, the pattern represents a rapid exhaustion of buyers and a transition from euphoria to some kind of letdown. Given NVDA’s selling was apparently driven off the bearish call of one analyst shop (the notorious Citron Research), the top requires major confirmation. Such a confirmation would come from a complete reversal of the last breakout and definitely below the last major low around $84. Stay tuned on this one given its hyper-darling status.
Citron readers know we have long been fans of $NVDA,but now the mkt is disregarding headwinds. In 2017 we will see $NVDA head back to $90 pic.twitter.com/n4U7f6eV7G
— Citron Research (@CitronResearch) December 28, 2016
Nightly Business Report also covered NVDA as THE top stock of 2016 and included a quick reference to the Citron note (start at the 12:25 mark).
— – —
FOLLOW Dr. Duru’s commentary on financial markets via email, StockTwits, Twitter, and even Instagram!
Daily T2108 vs the S&P 500
")
Black line: T2108 (measured on the right); Green line: S&P 500 (for comparative purposes)
Red line: T2108 Overbought (70%); Blue line: T2108 Oversold (20%)
Weekly T2108

*All charts created using freestockcharts.com unless otherwise stated
The charts above are the my LATEST updates independent of the date of this given T2108 post. For my latest T2108 post click here.
Related links:
The T2108 Resource Page
Be careful out there!
Full disclosure: long SDS, short AUD/JPY, long NVDA call option