(T2108 measures the percentage of stocks trading above their respective 40-day moving averages [DMAs]. It helps to identify extremes in market sentiment that are likely to reverse. To learn more about it, see my T2108 Resource Page. You can follow real-time T2108 commentary on twitter using the #T2108 hashtag. T2108-related trades and other trades are occasionally posted on twitter using the #120trade hashtag. T2107 measures the percentage of stocks trading above their respective 200DMAs)
T2108 Status: 37.8%
T2107 Status: 61.5%
VIX Status: 13.5
General (Short-term) Trading Call: neutral
Active T2108 periods: Day #173 over 20%, Day #29 over 30% (overperiod), Day #1 under 40% (underperiod), Day #17 under 50%, Day #33 under 60%, Day #59 under 70%
Commentary
Last week, I pointed out the weakness of the S&P 500’s bounce from near oversold levels. The S&P 500 (SPY) still looks feeble as it continues to look uninterested in breaking through critical overhead resistance at its 50-day moving average (DMA). The index is effectively meandering it way into the latest earnings season.
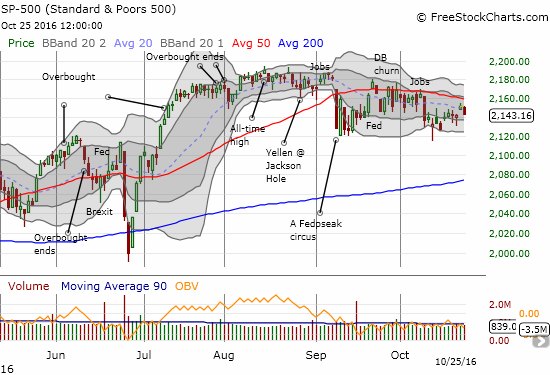
Perhaps we should just expect the current trading range to stay in place until the U.S. Presidential election gets resolved in two weeks.
T2108, my favorite technical indicator, took its biggest fall in almost two weeks: it dropped from 43.2% to 37.8%. T2108 also looks like it is under the spell of 50DMA resistance.
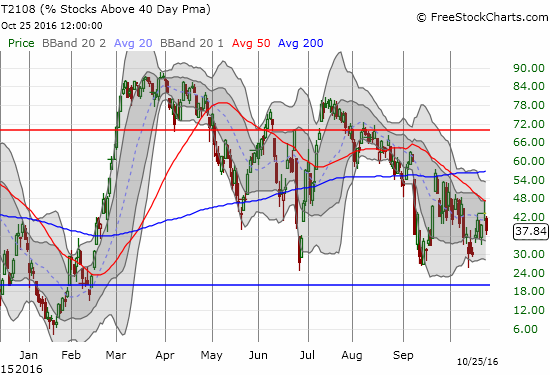
As the weeks wear on, the divergence between the sagging T2108 and a stubbornly resilient S&P 500 becomes ever more striking. If a selling catalyst arrives, it should deliver quite a wallop to the stock market.
The volatility index, the VIX, perked up today. The VIX produced its first gain in six trading days. The complacency going into earnings is also quite striking.
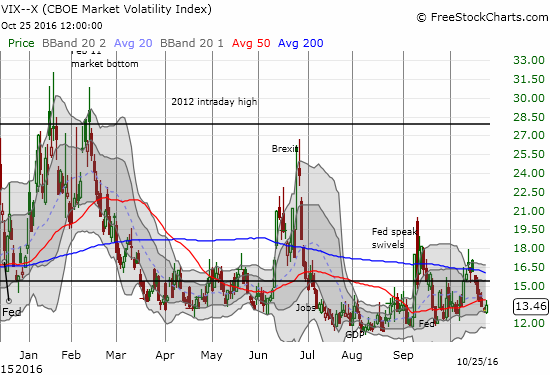
Of course, low volatility does not leave individual stocks off the hook. The most striking post-earnings sell-off on the day was Whirlpool (WHR). The stock lost 10.8% in what was described as one of WHR’s worst one-day losses as a public company. WHR’s gap down confirmed a double-top and the converged 50 and 200DMAs as resistance.
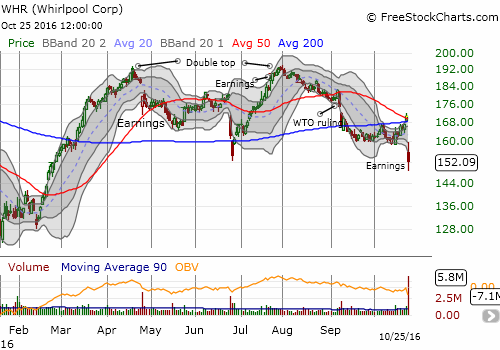
This drop is full of irony. In the immediate wake of Brexit, I pointed to WHR as a shorting opportunity. I doubted that 200DMA support would hold at that time. The 200DMA did indeed break down the very next day. However, I had to back off quickly after WHR rushed to reassure investors that all was well. As a reminder, from the press release at the time:
“The Company regularly performs risk assessments as part of the operational planning cycle and has prepared for either outcome of the vote. In the past, the Company has utilized a variety of approaches to manage volatility, including financial hedging. The Company plans to execute a previously-announced cost based price increase in the third quarter and expects to continue with strong ongoing cost productivity programs to lower overall costs in the EMEA region.
‘As we have done in the past in all markets, we are prepared to take swift actions to offset the negative impact to our EMEA operations,’ Fettig added. ‘We will continue to monitor the situation closely to determine if additional actions may be required.'”
The stock gapped up over 4% on this news and rallied nearly non-stop right through July earnings. By that time, Brexit seemed like a distant (bad) memory. The word “Brexit” only made it ONCE in that earnings call and not until the Q&A session (from the Seeking Alpha transcript):
“And as you also know the British pound for the quarter average has deteriorated, but obviously particularly post Brexit, the decline has been significant and it has a significant effect on our margins.”
WHR management went on multiple times to reassure investors that cost-based price increases would compensate for margin impacts. The warning sign came one week after earnings when WHR’s rally came to a halt right at the 2016 high made in April ahead of a poorly received earnings report. The stock sold off for a month straight and then resumed after an unfavorable ruling form the World Trade Organization (WTO). The latest earnings report indicated that WHR’s price hikes failed to address the post-Brexit problem of a collapsed currency (from the Seeking Alpha transcript):
“Consistent with what we’ve seen since the Brexit decision, currency continues to be a headwind and demand in the UK remained soft, causing our previously-announced cost base price increase to be implemented slower than anticipated.”
WHR named three main headwinds – all reportedly resolvable in the near future:
“There are exactly three moving pieces which we referred to: we had a temporary slowdown in U.S. demand, we had a promotional environment in washers, and the Brexit-related impact. We don’t have any other issues going on; these three. By definition, some of that drag we expect also in Q4 even to a less extent. So we do see a slight recovery of U.S. demand in Q4, not as bad as in Q3. The promotional environment in U.S. it’s probably going to last in Q4 but not beyond. The U.K. will be less but still somewhat impact in Q4, so that’s from a macro level.”
Judging from the market’s response, investors are not believing the relatively sanguine assessment this time around. I want to short WHR here with a tight stop on a post-earnings close that exceeds today’s intraday high (or even tighter above the open around $156).
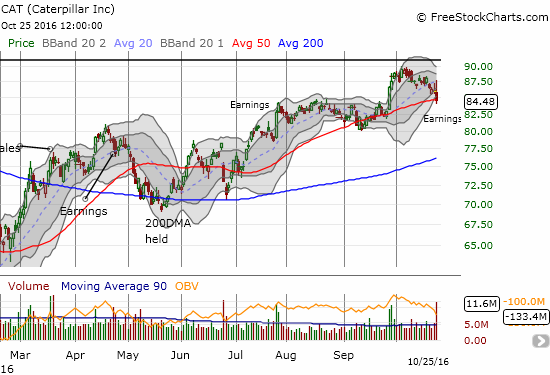
Caterpillar (CAT) was also in focus for its post-earnings reaction. CAT initially rallied on results that included reduced 2016 guidance and news that 2017 would be little better. I decided to play the intraday momentum with a limit order on November call options. It executed, but I soon had buyer’s remorse as a swell of selling took CAT down for the count. The stock even briefly cracked its 50DMA support. With a Bollinger Band (BB) squeeze building, CAT could be in for significant downside from here if support gives way.
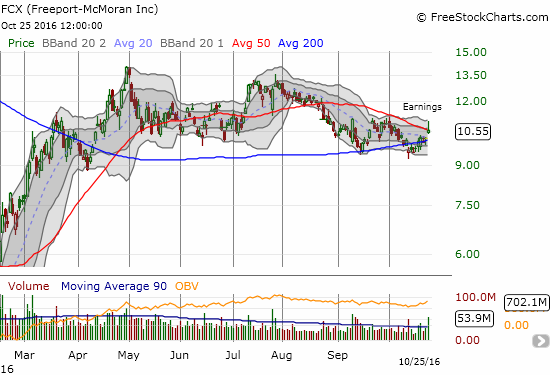
I still have my eye on Freeport-McMoRan Inc. (FCX) and its slow motion test of recent support. With the stock jumping off 200DMA support with a 3.6% post-earnings gain, the stage may finally be set for FCX to travel at least to the top of its near year-long trading range.
This earnings cycle, I am entirely focused on post-earnings reactions as opposed to pre-earnings setups. So, next up is Apple (AAPL)…
— – —
FOLLOW Dr. Duru’s commentary on financial markets via email, StockTwits, Twitter, and even Instagram!
Daily T2108 vs the S&P 500

Black line: T2108 (measured on the right); Green line: S&P 500 (for comparative purposes)
Red line: T2108 Overbought (70%); Blue line: T2108 Oversold (20%)
Weekly T2108

*All charts created using freestockcharts.com unless otherwise stated
The charts above are the my LATEST updates independent of the date of this given T2108 post. For my latest T2108 post click here.
Related links:
The T2108 Resource Page
Be careful out there!
Full disclosure: long SDS, long UVXY shares and short UVXY call, long CAT call options, net long the British pound
