
(T2108 measures the percentage of stocks trading above their respective 40-day moving averages [DMAs]. It helps to identify extremes in market sentiment that are likely to reverse. To learn more about it, see my T2108 Resource Page. You can follow real-time T2108 commentary on twitter using the #T2108 hashtag. T2108-related trades and other trades are occasionally posted on twitter using the #120trade hashtag. T2107 measures the percentage of stocks trading above their respective 200DMAs)
T2108 Status: 56.0%
T2107 Status: 59.5%
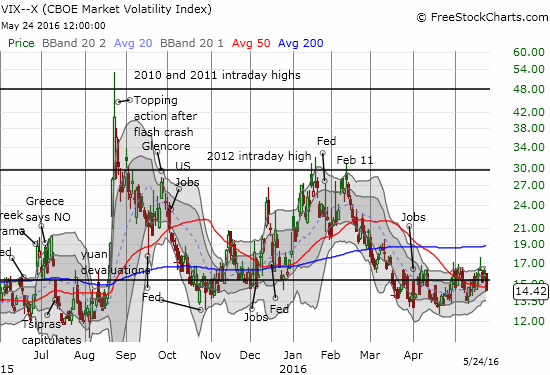
VIX Status: 14.4
General (Short-term) Trading Call: neutral
Active T2108 periods: Day #71 over 20%, Day #70 over 30%, Day #67 over 40%, Day #1 over 50% (ending 5 days under 50%) (overperiod), Day #9 under 60% (underperiod), Day #16 under 70%
Commentary
Just like that, sellers melted away from the market and the bulls ran wild. The buyers and bulls have forced bears and sellers to stand down.
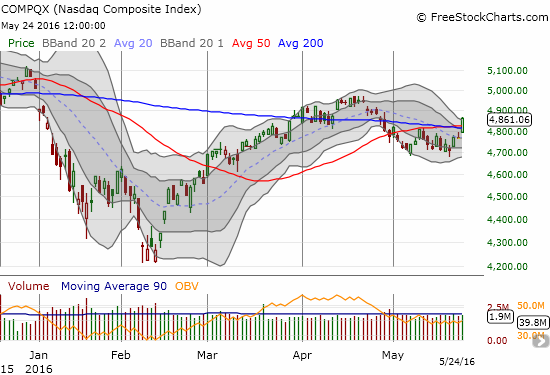
In the last T2108 Update, I stayed cautiously bearish as the major indices remained in a chopfest under key 50-day moving average resistances. Today, May 24, 2016, that resistance melted away simultaneously as the S&P 500 (SPY) and the NASDAQ (QQQ) punched through resistance and re-entered bullish territory.
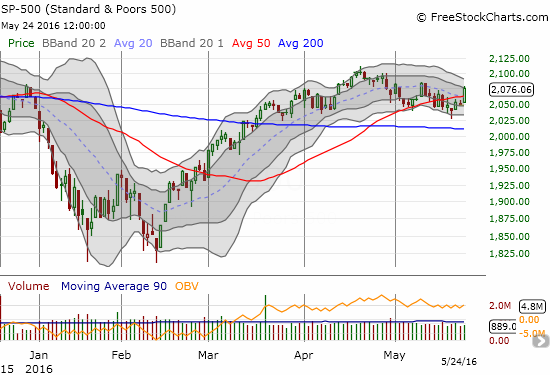
As my assumption of an extended “chopfest” gets challenged, this quick potential switch from a bearish to a bullish trading bias is consistent with the whiplash that a chopfest can dish out. My trading bias has moved from “cautiously bearish” to neutral to recognize the imminent switch to a bullish bias.
T2108, the percentage of stocks trading above their respective 40DMAs, fully confirmed today’s rally. T2108 soared from 48% to 56%. T2107, the percentage of stocks trading above their respective 200DMAs, could easily hit a new high in short order given the current momentum.
The volatility index, the VIX, receded with the bears and sellers. Once again the VIX treated the 15.35 level as a pivot.
Several stocks demonstrate my changed thinking.
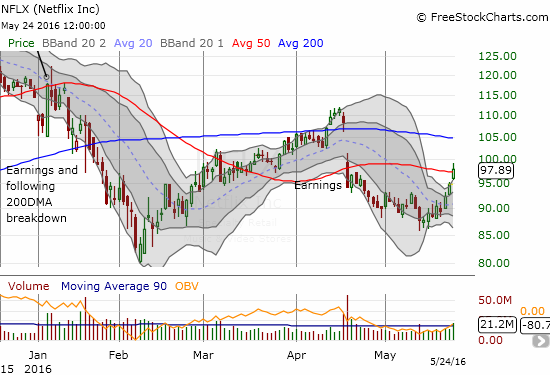
Netflix (NFLX) is a stock that was poised for a big breakdown or breakout from a Bollinger Band (BB) squeeze. With my bearish bias, I assumed the top of the recent range would hold, and NFLX would hurtle quickly downward from there. I was clearly thinking too many steps ahead. NFLX has gained about 10% in just three days. It is over-stretched above its upper-Bollinger Band (BB) and faded from its high to close on its 50DMA. Normally, I would expect a pullback from here to at least the upper-BB, but this is a stock on fire with INCREASING buying volume. The over-stretched trend could continue a lot further with this kind of momentum.
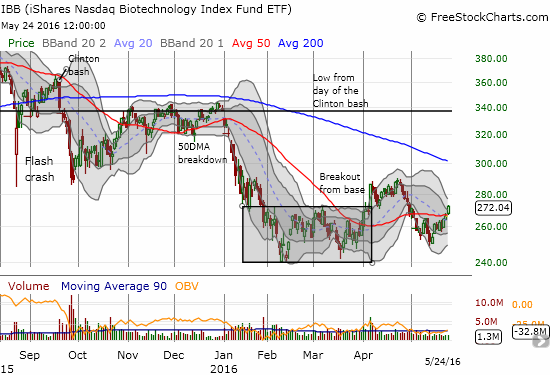
The iShares Nasdaq Biotechnology ETF (IBB) broke out above its 50DMA resistance and goes from bearish to bullish all over again. I started this month lamenting how IBB completely disappointed me by failing to deliver much follow-through to April’s (initially) impressive breakout.
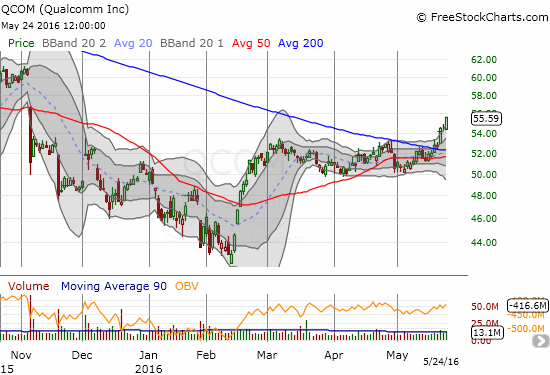
Qualcomm (QCOM) broke out last week above its 200DMA. The buying has accelerated and put QCOM at a new high for 2016. The stock is definitely in a bullish position.
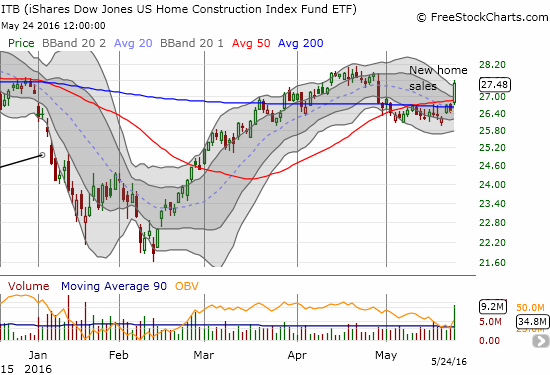
Even home builders joined the breakout party. I wrote about the bullish implications in housing in my latest Housing Review for May, 2016.
This is an interesting time for the market to get a fresh boost. The rally comes right on the heels of selling that was presumed to come from rate hike fears. The odds of a rate hike in July are as strong as ever but so is the market. Even if I switch back to a bullish bias, I will remain bearish on dollar-sensitive plays (excluding gold and silver) as long as Fed Fund futures project an imminent rate hike.
— – —
Reference Charts (click for view of last 6 months from Stockcharts.com):
S&P 500 or SPY
U.S. Dollar Index (U.S. dollar)
EEM (iShares MSCI Emerging Markets)
VIX (volatility index)
VXX (iPath S&P 500 VIX Short-Term Futures ETN)
EWG (iShares MSCI Germany Index Fund)
CAT (Caterpillar).
IBB (iShares Nasdaq Biotechnology).
Daily T2108 vs the S&P 500
")
Black line: T2108 (measured on the right); Green line: S&P 500 (for comparative purposes)
Red line: T2108 Overbought (70%); Blue line: T2108 Oversold (20%)
Weekly T2108

*All charts created using freestockcharts.com unless otherwise stated
The charts above are the my LATEST updates independent of the date of this given T2108 post. For my latest T2108 post click here.
Related links:
The T2108 Resource Page
Expanded daily chart of T2108 versus the S&P 500
Expanded weekly chart of T2108
Be careful out there!
Full disclosure: long UVXY call options, long SSO put options