
(T2108 measures the percentage of stocks trading above their respective 40-day moving averages [DMAs]. It helps to identify extremes in market sentiment that are likely to reverse. To learn more about it, see my T2108 Resource Page. You can follow real-time T2108 commentary on twitter using the #T2108 hashtag. T2108-related trades and other trades are occasionally posted on twitter using the #120trade hashtag. T2107 measures the percentage of stocks trading above their respective 200DMAs)
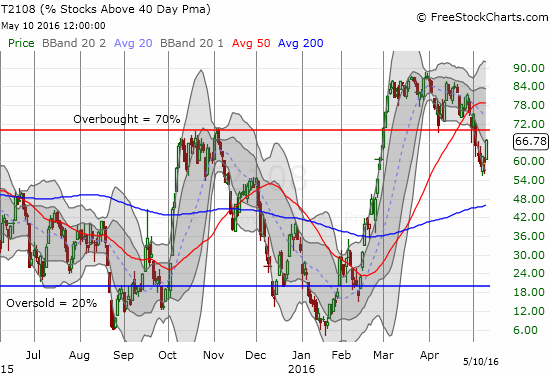
T2108 Status: 66.8%
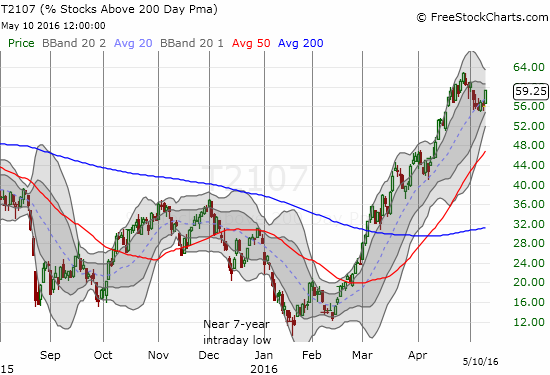
T2107 Status: 59.3%
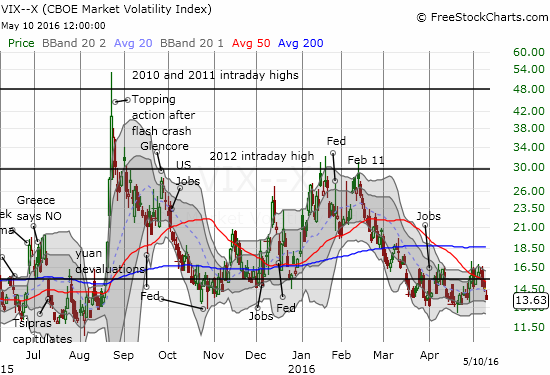
VIX Status: 13.6
General (Short-term) Trading Call: cautiously bearish
Active T2108 periods: Day #61 over 20%, Day #60 over 30%, Day #57 over 40%, Day #54 over 50%, Day #1 over 60% (overperiod), Day #6 under 70%
Commentary
The case for the buyers suddenly got a little stronger. The line in the sand they drew last week just got a little deeper.
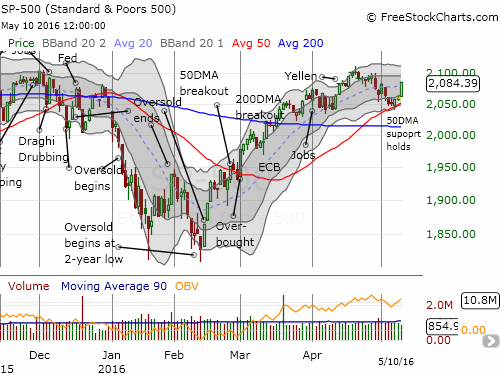
T2108, the percentage of stocks trading above their respective 40-day moving averages (DMAs), closed at 66.8%, a mere stone’s throw from overbought status (above 70%). T2107, the percentage of stocks trading above their respective 200DMAs, jumped up to 59.3%. Together, these indicators helped confirm the bullish move of the S&P 500 (SPY) which gained 1.3% and confirmed 50DMA support.
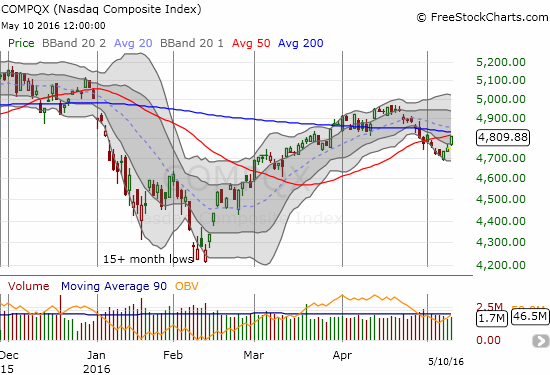
The rally day delivered a strong 1.3% gain to the NASDAQ (QQQ). This third day of gains positioned the tech-heavy index for a test of MAJOR resistance converging at its 20, 50 AND 200DMAs. This is a critical test as a breakout would confirm a return of advantage to the buyers.
The volatility index, the VIX, fell from the 15.35 pivot and closed just above recent lows. This move demonstrates the power of buyers but also puts the VIX back in an area from which it has tended to bounce.
This rally caught me a bit off-guard. Technically, I should have bought the open for the S&P 500 given the apparent confirmation of 50DMA support. However, my short-term trading call was “cautiously bearish”, so I was watching for a fresh breakdown of support instead. I felt better after watching Tuesday’s segment for Nightly Business Report (NBR) where Dominic Chu reported that floor traders were baffled by the day’s rally. OF course, he and the producers did consult the charts which provided a potentially simple answer. Chu tossed oil into the ring just because it is a usual suspect. Traders reached for a narrative resting on a slightly better than expected earnings season. The most interesting and perhaps compelling reach for an answer: McDonald’s (MCD), Johnson & Johnson (JNJ), and Home Depot (HD). These three stocks all hit new all-time highs, are major components of the Dow Industrials (DIA), AND sport yields higher than the 2% offered by 10-year Treasuries. Yep, THAT is how hard it was to find a good headline to explain today’s rally.
Maybe a bounce from support is explanation enough? You can see the segment called the “Head-Scratching Rally” around the 5:00 mark in the video below.
I now turn to my favorite explanations: the stock charts.
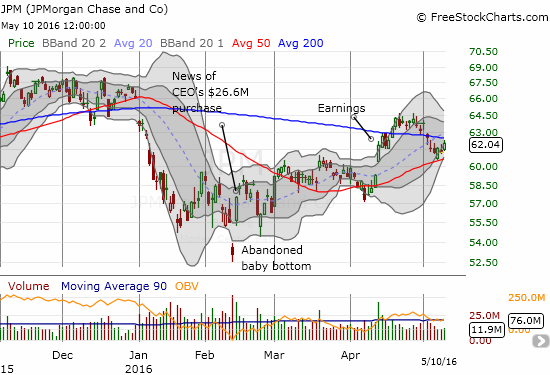
I start with JP Morgan Chase (JPM) since the rally off February lows marked “the JPM bottom.” JPM broke out above 200DMA resistance after last month’s earnings only to fall back down again. Last Friday, JPM surived a test of 50DMA support and looks energized enough for another 200DMA breakout. Note well that the stock is clinging to post-earnings gains which started with a breakout from previous consolidation. In other words, this is a decent spot to buy into a sustained breakout for JPM…assuming the buyers are indeed back in the market.
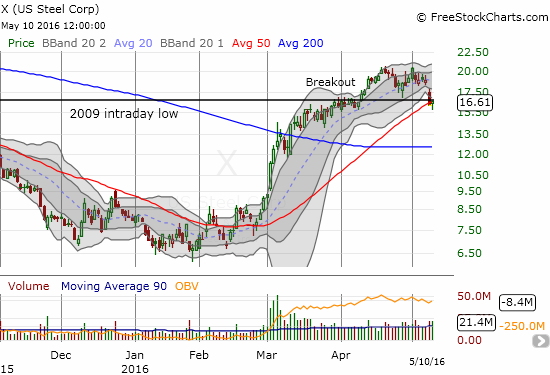
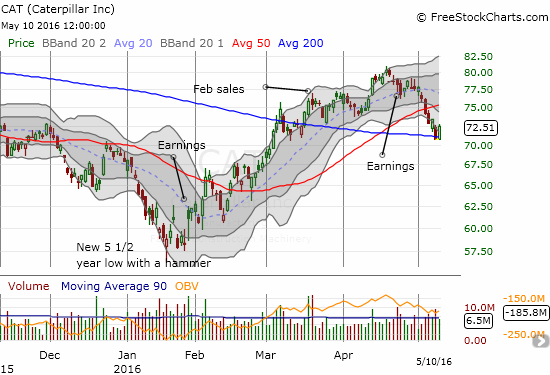
Materials and commodity-related stocks were hit hard the previous two days. Many of them became darlings in Tuesday’s rally. U.S. Steel (X) printed a bottoming hammer right at its 50DMA support which now also happens to coincide with the 2009 intraday low; that line held tough as resistance for much of March. Caterpillar (CAT) came roaring back from Monday’s loss to print a bounce off what now looks like 200DMA support (for now).
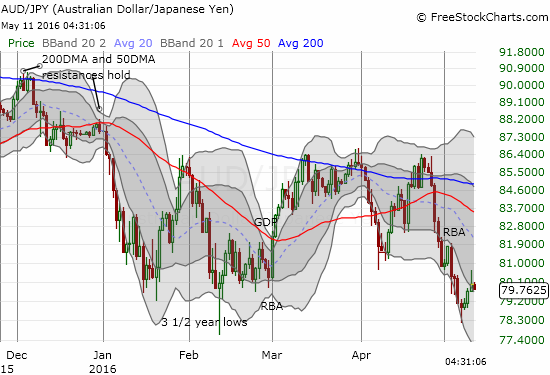
The Australian dollar (FXA) versus the Japanese yen (FXY) has supported the rally with its own gains. However, at the time of writing, AUD/JPY looks like it is finally losing steam. This pullback suggests a weak open is coming for Wednesday. I will continue watching AUD/JPY for clues on the sustainability of this nascent turn-around.
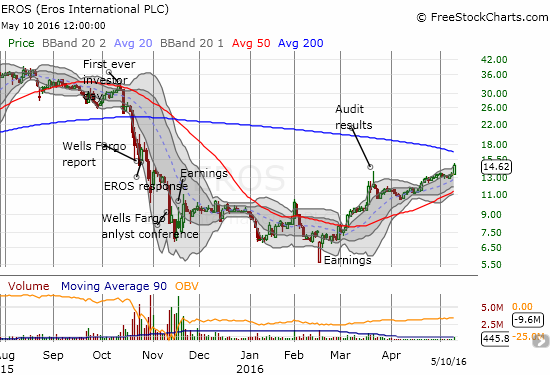
I am long overdue for an update on Eros International (EROS). This stock has rebounded nicely from the time of my last post almost 6 months ago! In March, EROS published audit results that presumably cleared its name of previous charges of financial chicanery. The rally that day was faded from the high, and the stock is only just now setting a new high. EROS looks good to test 200DMA resistance now. The next earnings report is still a month from now. I am hoping EROS can keep chugging along until then irrespective of the market’s bear/bull signals. Fresh complaints from analysts probably present the biggest potential landmines for the next month or so.
The tides have definitely turned in favor of the buyers, but I am leaving my trading call at “cautiously bearish.” If (when?) the NASDAQ breaks out from resistance, I will immediately switch to bullish even if T2108 has not yet re-entered overbought territory. Re-entry into over-bought status, accompanied with gains in T2107, make me a bull convert all over again even if the NASDAQ has yet to cooperate by then.
— – —
For readers interested in reviewing my trading rules for an oversold T2108, please see my post in the wake of the August Angst, “How To Profit From An EPIC Oversold Period“, and/or review my T2108 Resource Page.
Reference Charts (click for view of last 6 months from Stockcharts.com):
S&P 500 or SPY
U.S. Dollar Index (U.S. dollar)
EEM (iShares MSCI Emerging Markets)
VIX (volatility index)
VXX (iPath S&P 500 VIX Short-Term Futures ETN)
EWG (iShares MSCI Germany Index Fund)
CAT (Caterpillar).
IBB (iShares Nasdaq Biotechnology).
(Reload page and/or click on the image, if it is not correct. At time of writing, server is having cache issues)
Daily T2108 vs the S&P 500
")
Black line: T2108 (measured on the right); Green line: S&P 500 (for comparative purposes)
Red line: T2108 Overbought (70%); Blue line: T2108 Oversold (20%)
Weekly T2108

*All charts created using freestockcharts.com unless otherwise stated
The charts above are the my LATEST updates independent of the date of this given T2108 post. For my latest T2108 post click here.
Related links:
The T2108 Resource Page
Expanded daily chart of T2108 versus the S&P 500
Expanded weekly chart of T2108
Be careful out there!
Full disclosure: long CAT put spread and options, short AUD/JPY