
(T2108 measures the percentage of stocks trading above their respective 40-day moving averages [DMAs]. It helps to identify extremes in market sentiment that are likely to reverse. To learn more about it, see my T2108 Resource Page. You can follow real-time T2108 commentary on twitter using the #T2108 hashtag. T2108-related trades and other trades are occasionally posted on twitter using the #120trade hashtag. T2107 measures the percentage of stocks trading above their respective 200DMAs)
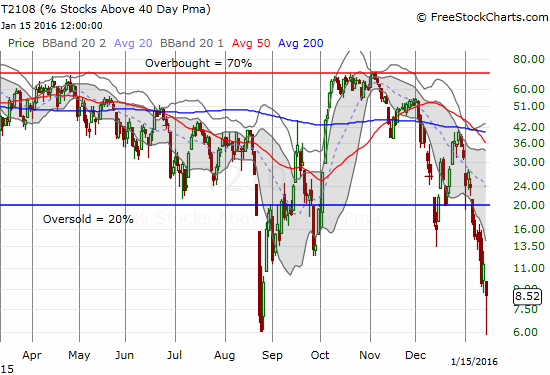
T2108 Status: 8.5% (went as low as 5.8%, marginally below August flash crash low and a level last seen March, 2009)
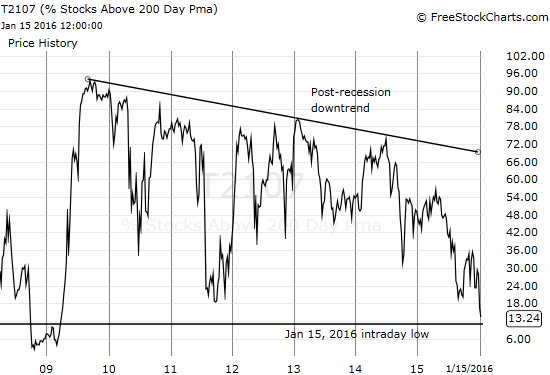
T2107 Status: 13.2% (went as low as 11.1%, a level last seen April, 2009)
VIX Status: 27.0% (went as high as 31.0 and then faded below 2012 intraday low)
General (Short-term) Trading Call: bullish
Active T2108 periods: Day #7 under 20%, Day #10 under 30%, Day #26 under 40%, Day #30 below 50%, Day #45 under 60%, Day #386 under 70%
Commentary
With 3-day weekend coming for US, I am assuming at best $SPY escapes flat. #VIX should rise again on fear of what's next from China $UVXY
— Dr. Duru (@DrDuru) January 15, 2016
This guess turned out to be a HUGE understatement of the market’s mood. I figured the relief rally on Thursday that sent volatility tumbling and the S&P 500 (SPY) surging 1.7% was enough to keep the market relatively calm for Friday. Instead, panic resumed.
%stocks>40DMA = ~6.6%. Retesting the insane low from last August. %stocks>200DMA=12.3%. Testing insane low from 2011. #T2108 #T2107 $SPY
— Dr. Duru (@DrDuru) January 15, 2016
I happened to send out that tweet right around the bottom for the day. T2108, the percentage of stocks trading above their respective 40-day moving averages (DMAs), jumped a bit from there and closed at 8.5%. This move held the lows from the August Angst as support. T2107, the percentage of stocks trading above their respective 200-day moving averages (DMAs), closed at 13.2%. At its lowest, T2107 hit 11.1%, a level last seen April, 2009! The bounce did not return T2107 to the lows from the August Angst and is still a 4+ year low. The S&P 500, now pushing further in extreme oversold conditions, closed at 1880 after briefly cracking the August Angst closing low of 1868. Here are the related charts:
(Jan 17: adjusted above chart to arithmetic scale and a line chart for more clarity)
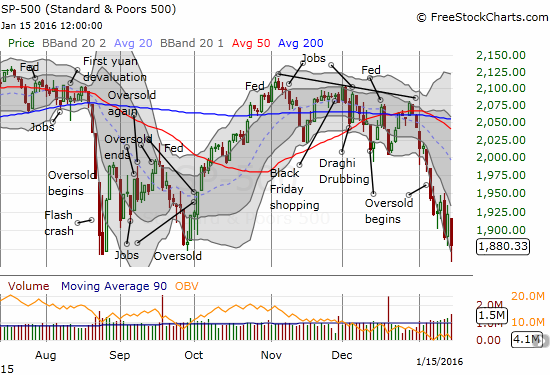
So the sellers remain quite serious and intent on stampeding out of the market. Even with T2107 and T2108 at intense extremes, the S&P 500 barely showed enthusiasm for avoiding a major breakdown to a new 15-month low. I now need to update my piece in early September “How The S&P 500’s Current Breakdown Increases The Odds Of Further Selling“: the 200DMA signal described in that piece demonstrated the need for caution going forward but the odds of another significant drawdown were cloudy. A clean breakdown of the August Angst lows will put the S&P 500 at tremendous risk for a substantial extension of this sell-off. Fortunately, the immediate odds favor a good bounce before a resumption of selling.
In the last T2108 Update, I provided an update on the history of T2108 oversold periods. Now that T2108 has closed in single-digits again, we should expect this oversold period to last around 10 days. This oversold period currently sits at day #7. A 10-day oversold period qualifies as the “long” oversold period I feared in that T2108 Update. Only one other oversold period has lasted 10 days and 12 have lasted longer. This count is out of 70 oversold periods since 1987.
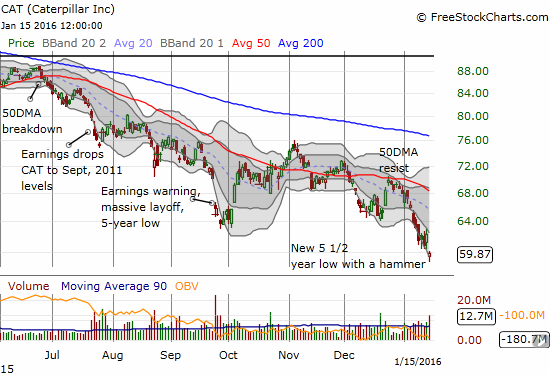
Adding to the warning flags are Caterpillar (CAT) and the Australian dollar (FXA) trading against the Japanese yen (FXY). CAT last traded at current levels in the summer of 2010. As my favorite equity hedge against bullishness, CAT is doing a great job of reflecting the roar of the bear. This stock will be at the top of my list for fading as soon as this oversold period ends. The stock printed a neat hammer-like bottom on Friday. A hammer bottom is created in the middle of a downtrend where sellers first take a stock down well off the open and buyers return fire by taking the stock back up to or toward the high on the day. If CAT gaps up to start trading on Tuesday, I will become much bolder in expecting an imminent end to this oversold period.
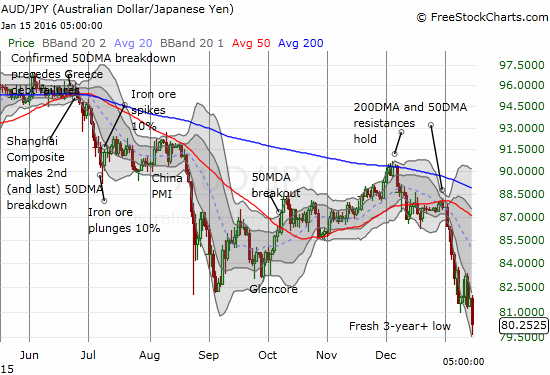
AUD/JPY made a clean and bearish break of recent lows to print a fresh 3+ year low. No hammer here, just a fresh confirmation of the on-going retreat from risk in financial markets. I decided to hold onto my latest short position on AUD/JPY. Hopefully I can “comfortably” close it out after Asia starts trading. In the meantime, I continue to watch this currency pair closely. The oversold period will not likely end with AUD/JPY this low.
Even with this bearish backdrop, I stayed focus on the T2108 trading rules. The primary directive here is to avoid any NEW bearish positions. As bad as things look, this is a classic setup for a bear trap. I know from experience: 1) struggle hard to stay optimistic, 2) finally give up hope and turn to the dark side of the bears… 3) just in time to find out that fellow sellers have finally exhausted themselves and buyers happily rush into the sentiment vacuum, 4) cling to bearish sentiment because it felt so strong just days ago, 5) finally give up on bearish positions just in time to find out that buyers have now exhausted themselves. Rinse and repeat…
Here is a summary of my trading actions on the day as a concrete example of my thinking:
- Bought more shares on ProShares Short VIX Short-Term Futures (SVXY) and put options on ProShares Ultra VIX Short-Term Futures (UVXY).
- Closed out my second to last bearish position and maximized my discomfort.
- Closed out my call spread on iShares 20+ Year Treasury Bond (TLT) at a loss wishing I had at least another month to hold onto this prescient position. The current 200DMA breakout on TLT looks much stronger than the previous two.
- Added more shares and call options on ProShares Ultra S&P500 (SSO). I have shifted expirations of most options all the way out to February 19th.
- For good measure, bought call options on PowerShares QQQ ETF (QQQ) for the first time.
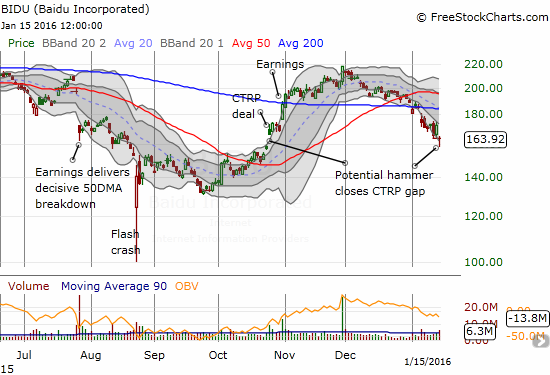
- Bought call options on Baidu (BIDU) and then decided to lock in profits at the close.
- SOLD a put option on ProShares Ultra VIX Short-Term Futures (UVXY). On the surface, this looks like violation of rule against new shorts. However, this bet combines a hedge against a broad volatility implosion in all UVXY options with a hedge that by Feb 19th, volatility will experience an even greater surge than the current one. I took in a large premium on this position.
Here are some charts of interest with brief commentary:
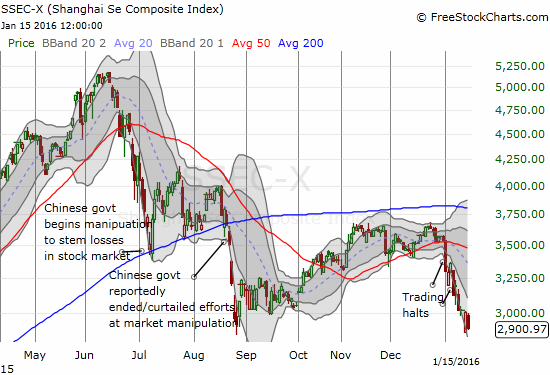
Yes, the sky is still falling in China…
Baidu (BIDU) is trying to make a bottom at an opportune spot. BIDU used to be one of my favorite go-to stocks for bullish moments. I am itching to put it back on the list and a gap up from here would do the trick.
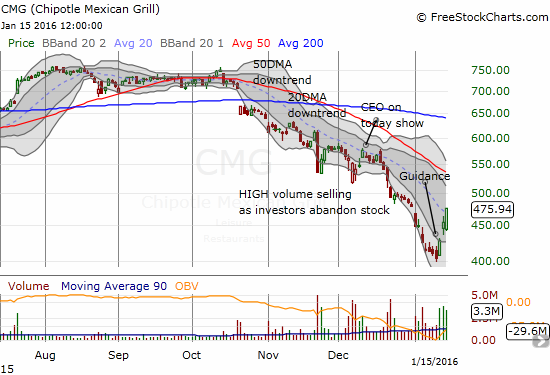
Impressive recovery from lows and relative strength for $CMG. On watch as it appears sellers finally exhausted.
— Dr. Duru (@DrDuru) January 15, 2016
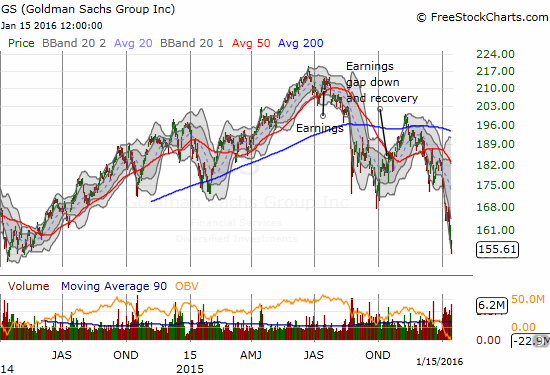
Goldman Sachs (GS) looks ripe for a bounceback at least to the top of the downtrend channel. Regardless, GS is a prime target for a buy on an improvement in market sentiment. Of course, at this point, MANY stocks have very similar setups.
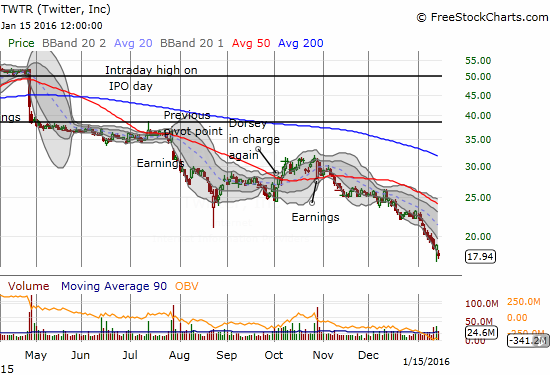
During the August Angst I shorted a Twitter (TWTR) put in trade I described in “How to Buy Twitter’s Stock for Less Than $20/Share.” The bottom I thought came with the August Angst has now completely failed. I am sticking with the trade for now…
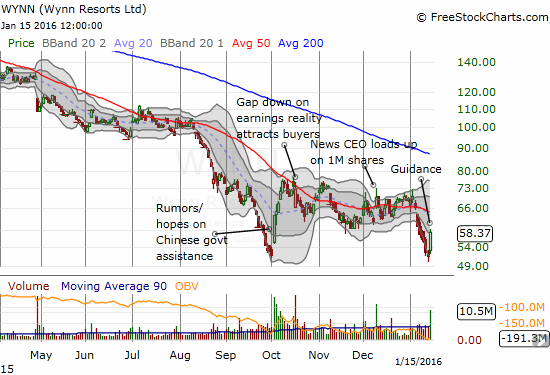
Wynn Resorts (WYNN) was on the verge of a major breakdown before issuing guidance on Friday. The news in of itself was subpar dragged down by operations in Macau…
“For the full year, net revenues are expected to be in the range of $1,609 million to $1,617 million, compared to $1,636.9 million generated in 2014. On a GAAP basis, operating income for 2015 is expected to be in the range of $215 million to $223 million, compared to $270.5 million in 2014. For 2015, adjusted property EBITDA is expected to be in the range of $473 million to $481 million, compared to $515.2 million for 2014.”
…but I guess the results were not as bad as feared. Whatever the reason, WYNN put on an impressively successful retest of support. The CEO’s purchase of shares in early December my yet be made whole again.
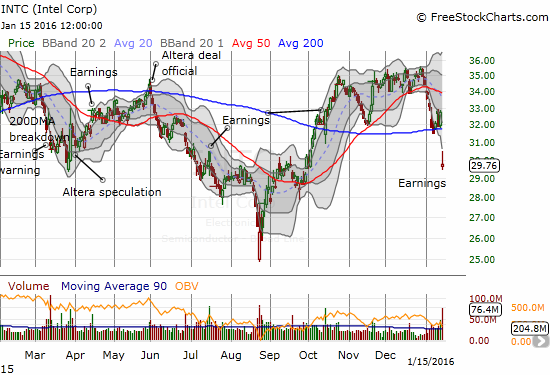
Throughout earnings season, I expect more sharp bounces in beaten down stocks. Sentiment is extremely negative and as such tends to amplify the fear already abundant in names buffeted earlier by bad news. Yet, earnings season is still a precarious time to bet on individual stocks as plays on oversold conditions, especially on stocks that have so far survived the recent sell-off in good (technical) shape. Intel (INTC) was valiantly clinging to 200DMA support ahead of reporting better than expected results and in-line guidance. The market took the stock down in a very bearish 200DMA breakdown. I like to buy and sell INTC between earnings. However, given the upside may be capped by 200DMA resistance, I am going to sit tight for now.
For readers interested in reviewing my trading rules for T2108, please see my post in the wake of the August Angst, “How To Profit From An EPIC Oversold Period“, and/or review my T2108 Resource Page.
Reference Charts (click for view of last 6 months from Stockcharts.com):
S&P 500 or SPY
U.S. Dollar Index (U.S. dollar)
EEM (iShares MSCI Emerging Markets)
VIX (volatility index)
VXX (iPath S&P 500 VIX Short-Term Futures ETN)
EWG (iShares MSCI Germany Index Fund)
CAT (Caterpillar).
IBB (iShares Nasdaq Biotechnology).
Daily T2108 vs the S&P 500
")
Black line: T2108 (measured on the right); Green line: S&P 500 (for comparative purposes)
Red line: T2108 Overbought (70%); Blue line: T2108 Oversold (20%)
Weekly T2108

*All charts created using freestockcharts.com unless otherwise stated
The charts above are the my LATEST updates independent of the date of this given T2108 post. For my latest T2108 post click here.
Related links:
The T2108 Resource Page
Expanded daily chart of T2108 versus the S&P 500
Expanded weekly chart of T2108
Be careful out there!
Full disclosure: long SVXY shares, long UVXY put options, long SSO call options, long SSO shares, short AUD/JPY, long CMG shares, long CMG put options, short TWTR put option