
To start the new year, I wrote a piece titled “The Japanese Yen Flashes Red for 2016.” At the time, I used charts of the Japanese yen (FXY) trading against various currencies to demonstrate how the yen was asserting itself in currency markets. Two weeks later, speculators have provided confirmation of the increasing interest in getting long the yen.
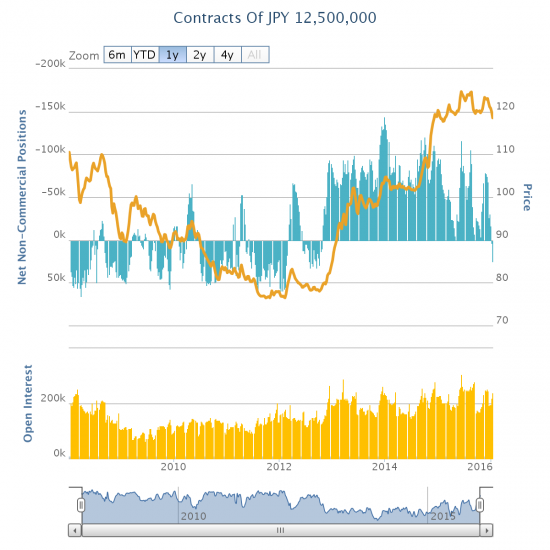
Source: Oanda’s CFTC’s Commitments of Traders
If recent history serves as a guide, the switch from net bearishness to net bullishness on the yen is just getting started. The yen’s jockeying for center stage attention has large implications for risk appetite in financial markets. As a traditional “safe haven” currency, the yen’s surge suggests that equity markets will struggle to sustain upward momentum for the time being. The last significant bout of yen strength coincided with 2011’s large sell-off in 2011 when the U.S. government struggled over the debt ceiling. The yen regained favor briefly during the two subsequent and smaller sell-offs in 2012.
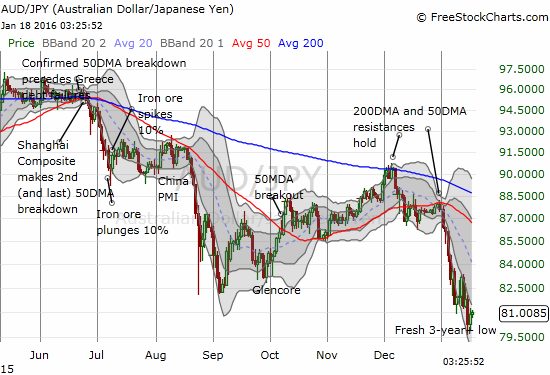
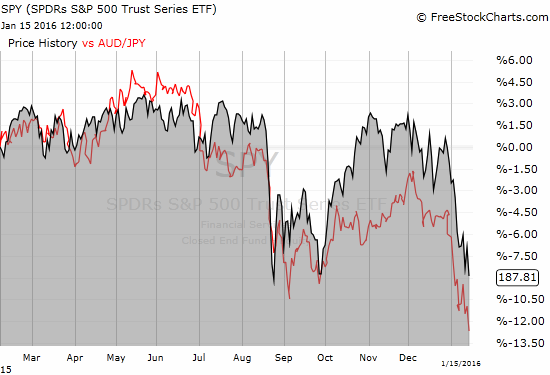
The Australian dollar (FXA) versus the Japanese yen, AUD/JPY, is the clearest example of tightened correlation between the yen’s success and the stock market’s lack of success. AUD/JPY has broken down to fresh 3+ year lows. The drop from the highs of December and then sharp year-to-date plunge match the accelerating weakness in the S&P 500 (SPY). The charts below show AUD/JPY by itself and then SPY overlayed by AUD/JPY to show the recent tight correlation.
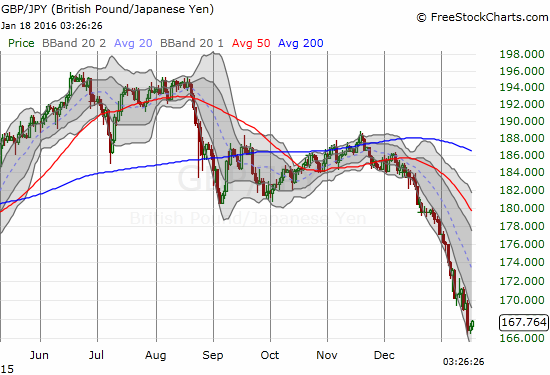
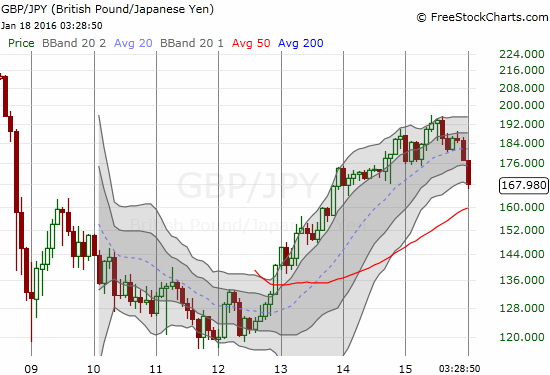
The strength of the yen shows up even more dramatically against the likes of the British pound (FXB). The pound has been mercilessly sold since early December. Even with this sharp decline for GBP/JPY, the monthly chart reminds us that there remains PLENTY of potential for GBP/JPY to decline a lot further. If risk aversion and a rush back to the yen take hold, a sustained trend could last a lot longer.
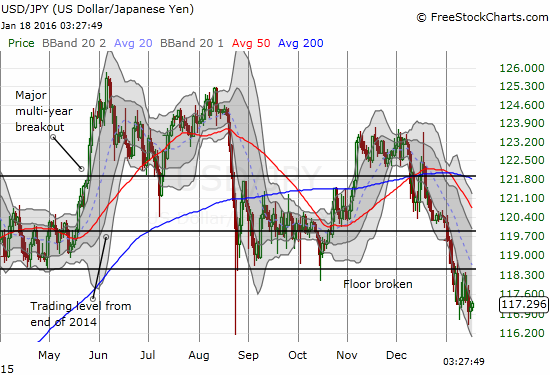
The yen’s gains over the U.S. dollar are not as dramatic. While USD/JPY has steadily trended downward since December, the currency pair has yet to print severe breakdown. USD/JPY trades at levels last seen in February, 2015.
Source for charts: FreeStockCharts.com
With the Japanese yen vying for center stage, equity traders would do well to monitor the currency for a check on market sentiment and risk appetites. Currency traders looking to ride trends may find a friend in the yen. The yen is flashing more red than it has done in quite some time…
Be careful out there!
Full disclosure: long and short various currencies against the Japanese yen and British pound; net long the U.S. dollar index; net short the Australian dollar