
(T2108 measures the percentage of stocks trading above their respective 40-day moving averages [DMAs]. It helps to identify extremes in market sentiment that are likely to reverse. To learn more about it, see my T2108 Resource Page. You can follow real-time T2108 commentary on twitter using the #T2108 hashtag. T2108-related trades and other trades are posted on twitter using the #120trade hashtag)
T2108 Status: 61.5%
VIX Status: 12.4%
General (Short-term) Trading Call: Hold (Bullish)
Active T2108 periods: Day #301 over 20% (includes day #280 at 20.01%), Day #15 over 40%, Day #13 over 50% (overperiod), Day #40 under 60%, Day #41 under 70%
Reference Charts (click for view of last 6 months from Stockcharts.com):
S&P 500 or SPY
SDS (ProShares UltraShort S&P500)
U.S. Dollar Index (volatility index)
EEM (iShares MSCI Emerging Markets)
VIX (volatility index)
VXX (iPath S&P 500 VIX Short-Term Futures ETN)
EWG (iShares MSCI Germany Index Fund)
CAT (Caterpillar).
Commentary
Post-summer trading is still crawling along but excitement continues to roil under the covers. This T2108 is more of a quick chart update given T2108, the S&P 500 (SPY), and the VIX all barely budged. The S&P 500 actually managed a fresh intra-day all-time high before fading back toward 2000. It remains in a bullish zone.
However, the story starts to get more complicated as soon as I turn the lens to Apple (AAPL). Over the weekend, I updated my sentiment analysis on AAPL and concluded with four points of caution. I did not have a specific day or time for a pullback, but I sure did not imagine one so sharp, sudden, and deep all in one day and well in advance of the September 9th product announcement!
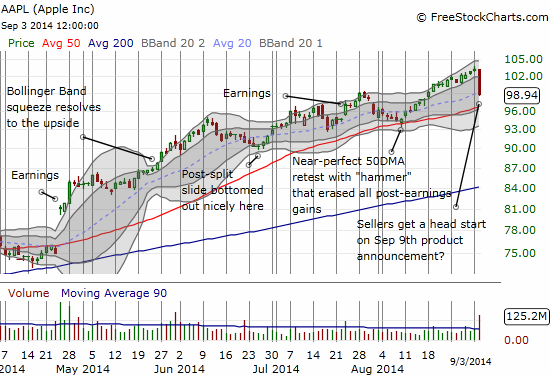
As much as I like Apple, this selling has to be taken seriously no matter the reason. It was an outsized loss at -4.2% that occurred on heavier than usual trading volume. Buyers have a major hurdle to overcome here, and now the bar is REALLY high for AAPL’s product announcement to dazzle and amaze. I purely speculated on a relief bounce by buying up some call options. I am looking for a move at least back toward $100 for this week and a late run-up into September 9th next week. I also bought put options that I flipped very quickly into the selling. I did not use the Apple Trading Model (ATM) for these trades. The ATM is predicting very high odds of follow-through selling for Thursday, so it is very possible I attempt to flip put options again after the open. (The model was invalid for Wednesday given the Monday holiday).
Of course it is far too early to weep over Apple. A steady 50DMA and even stronger 200DMA await below to provide support if needed. If the (near-term) bullish thesis remains intact, Apple will more drift toward support levels rather than plunge into them.
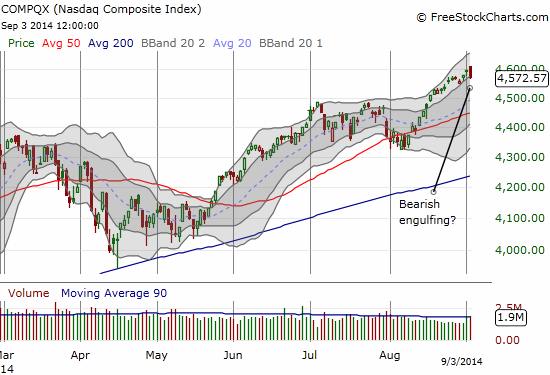
The plunge in Apple (AAPL) was enough to punch a potentially ominous bearish engulfing pattern into the NASDAQ (QQQ), creating a kind of double-trouble for tech. Since the index found support at the bottom of its uptrending trading channel, I am NOT calling a top or changing my trading signal to short. But another close in the red will have me raising a red flag. I just wish T2108 were in overbought territory to make a bearish call easier. After all, the trading action on Tuesday had me convinced that the indices still have a lot more upside immediately ahead.
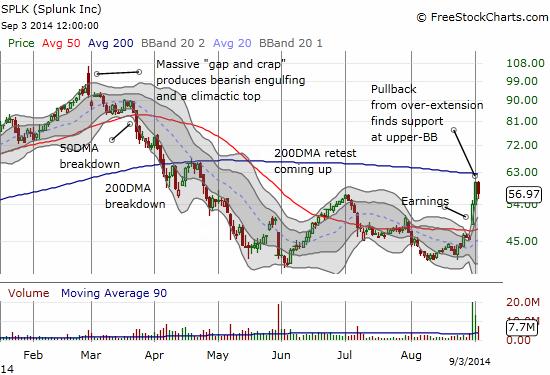
To round out the red side of the ledger, Splunk (SPLK) faded hard on the day, a loss of 4.9% that was as high as 6.5% or so. THIS is the kind of move I expect when a stock runs up so far above its upper-Bollinger Band (BB). Note well how neatly the stock bounced off that upper-BB. While I was supposed to be stopped out of my short position as I attempted a fade a day early, I think the lesson here is to perhaps pace out fades of particularly strong bursts above the upper-BB.
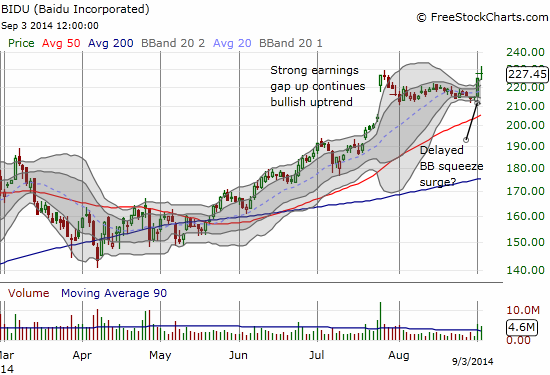
On the more bullish side, Baidu (BIDU) followed-through as I expected from Tuesday’s impressive breakout from a BB-squeeze. Note how BIDU failed to hold the highs after extending well above the upper-BB. Regardless, I was definitely left wishing my limit order to sell my BIDU calls had gone unheeded on Tuesday.
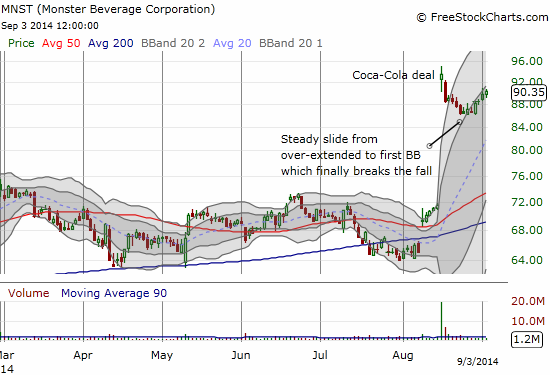
Finally, Monster Beverage Corporation (MNST) is following through almost exactly as I had hoped when I posted about the trade setup on August 25th. As soon as MNST manages to trade on the other side of the first BB, I think its upward momentum should really take off.
Daily T2108 vs the S&P 500
")
Black line: T2108 (measured on the right); Green line: S&P 500 (for comparative purposes)
Red line: T2108 Overbought (70%); Blue line: T2108 Oversold (20%)
Weekly T2108

*All charts created using freestockcharts.com unless otherwise stated
Related links:
The T2108 Resource Page
Expanded daily chart of T2108 versus the S&P 500
Expanded weekly chart of T2108
Be careful out there!
Full disclosure: long AAPL call options, long MNST call options, short SPLK