
(T2108 measures the percentage of stocks trading above their respective 40-day moving averages [DMAs]. It helps to identify extremes in market sentiment that are likely to reverse. To learn more about it, see my T2108 Resource Page. You can follow real-time T2108 commentary on twitter using the #T2108 hashtag. T2108-related trades and other trades are posted on twitter using the #120trade hashtag)
T2108 Status: 61.9%
VIX Status: 12.3%
General (Short-term) Trading Call: Hold (Bullish)
Active T2108 periods: Day #300 over 20% (includes day #280 at 20.01%), Day #14 over 40%, Day #12 over 50% (overperiod), Day #39 under 60%, Day #40 under 70%
Reference Charts (click for view of last 6 months from Stockcharts.com):
S&P 500 or SPY
SDS (ProShares UltraShort S&P500)
U.S. Dollar Index (volatility index)
EEM (iShares MSCI Emerging Markets)
VIX (volatility index)
VXX (iPath S&P 500 VIX Short-Term Futures ETN)
EWG (iShares MSCI Germany Index Fund)
CAT (Caterpillar).
Commentary
The end of summer trading, the post-Labor Day period, disappointed anyone looking for the end of vacations to signal a return of trading volume that would set the tone for the rest of the year. Not only was volume just normal or average, but also the major indices barely budged on the day. Even T2108 was non-committal with a close at 61.9% barely a point lower than Friday’s close. However, look a little closer and under the surface, and we find several points of great interest.
First, the S&P 500 (SPY) managed to come back from trading below the psychologically important 2000 level. The index traded as low as 1994.85 before closing at 2002.28. I am guessing the break of 2000 on the first day of post-Labor Day generated confirmation for some group of bears.
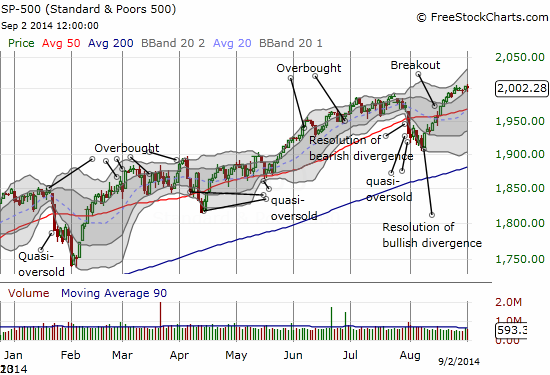
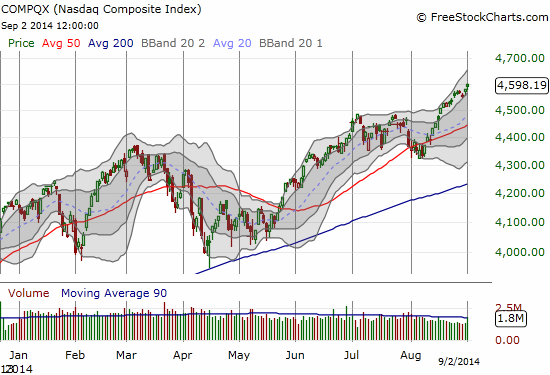
The tech-laden NASDAQ (QQQ) only gained 0.4% on the day, but the fresh 14-year high is another big statement. The index also extended its out-performance against the S&P 500.
While the indices were trading within tight guardrails, I got impressive stock price alerts all day. If I had not known better, I would have thought the stock market was experiencing a tremendous rally. Instead, the various stock surges I saw represented just a sliver of excitement roiling under the covers of a seemingly calm market. Here are some of the charts with brief commentary, including trades and mistakes I made. I think the overall (albeit selective) message here is that the market is ready to continue soaring higher.
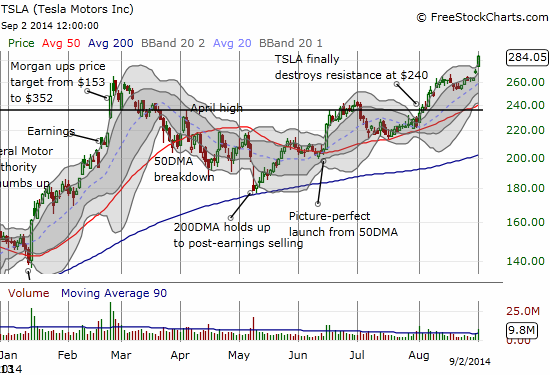
Tesla Motors, Inc. (TSLA)
I wasted no time when I saw TSLA gap up to a fresh all-time high. I consider that a major endorsement of the stock and a signal that the stock is likely to go ever higher. I immediately purchased a call spread. I continue to hold onto a very small short which stays as a hedge for my bumrushes into call options on TSLA.
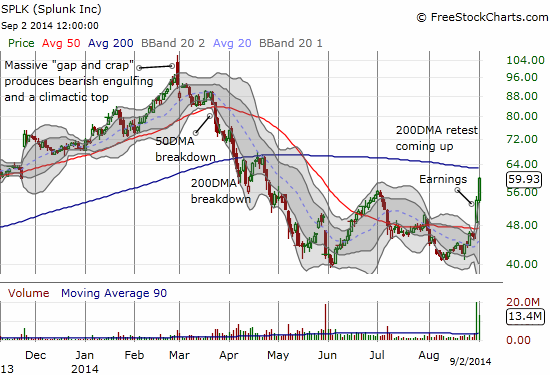
Splunk, Inc. (SPLK)
Woah! SPLK surged mightily on Friday after posting earnings. It stretched well above its upper-Bollinger Band (BB) and set up a trade to fade. I of course checked on the position right at the open. I was relieved to see the stock sitting still and thought all was well. So imagine my surprise when I saw the stock managed to gain another 11%. Imagine my double-dismay after I discovered I neglected to place a stop on the position. Good thing it is a small position. Now I might as well wait to see how things play out at 200DMA resistance.
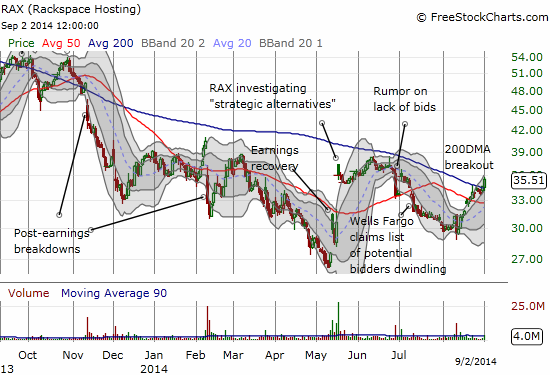
Rackspace Hosting, Inc. (RAX)
One of my favorite trades is the “comeback” trade. This is a situation where a stock surges on some exciting catalyst only to get faded and then reversed on no confirmed news. I sold half my position of call options as RAX retested its 200DMA a little over a week ago. I am gratified to see the stock breaking that resistance now, and I plan to hold the rest as long as I can. Hopefully some deal comes through soon….
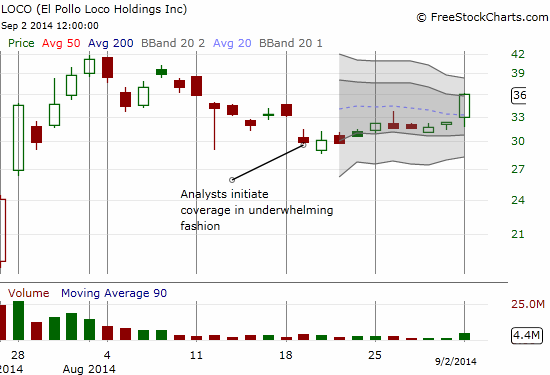
El Pollo Loco Holdings, Inc. (LOCO)
I thought LOCO was “done” after analysts failed to come through with a collective “hurrah” upon initiation on August 19th. The stock gapped down in disappointment. Yet, the next day formed a bottom, and the stock has just bid its time in a small consolidation phase. Today was a big day with an 11.5% surge.
GoPro, Inc. (GPRO)
Here is another hot IPO I thought was “done” after a gap down. This time it was real news: earnings. Sellers had one more good day. After that, buyers have stiffened the upper lips, thumped their chests, and rallied on. Last Thursday, the stock rallied right to its intraday all-time high and pulled back. The stock has since managed two fresh all-time highs above the upper-BB. The buyers are back in full swing. Buy the dips…if you can.
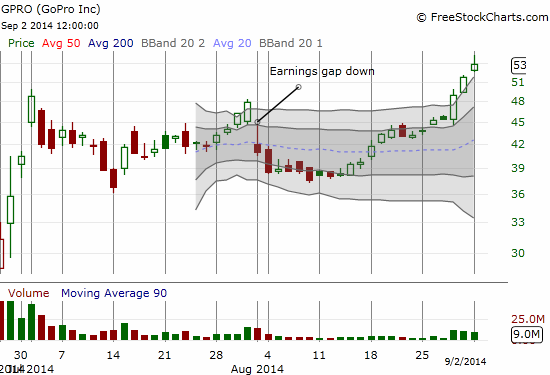
Now a much-needed sidebar on GPRO… A prominent market bear tweeted a link to an article warning that knock-offs are a threat to GPRO. As soon as the stock pulled back $2 from its high, this bear tweeted almost triumphantly. The stock regained half of those losses by the close. It was a bizarre sequence that betrayed what I think is an ever-growing frustration on the bearish side of the fence (or at least THAT bearish side of the fence!) – scratching and scrambling for signs that the market is ready to sell-off or even collapse. To the bears out there, stay cool. Let the market tell you it’s ready and stop trying to over-anticipate, staring at headlines, reading news with a bearish-tinted glasses, etc… I think there is nothing harder than trying to time and predict a top when a market or stock is making multi-year or, even worse, all-time highs. Of course, fundamentalists are looking across a different plain… (Regular readers can probably guess the identity of this prominent bear. I have decided to stop referring to him directly because his tweeting behavior is becoming more bizarre and almost more desperate to me; that is, less and less useful for commentary. He is a stubborn contrarian who himself is becoming a great contrarian signal for the bulls. I even wonder whether at times he is overly focused on generating attention and trying to see whether he can move markets to conform to his on-going “fight the trend” mantra.)
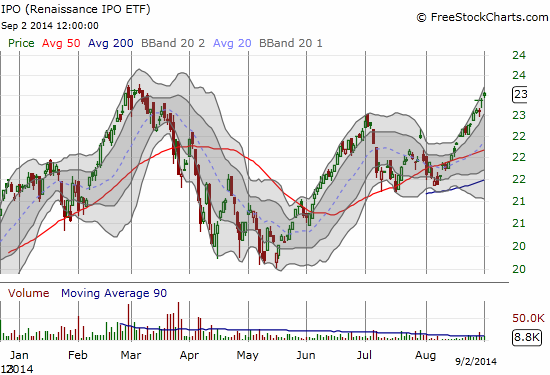
Renaissance IPO ETF (IPO)
This chart is enough said on the market’s opinion toward some of the market’s latest crop of hot stocks. A break to a fresh all-time high will be yet one more feather in the cap of the bulls. Bears should hope that IPO makes a major gap down from here on massive volume…
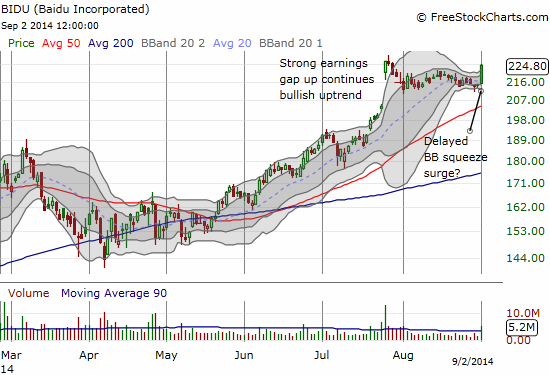
Baidu, Inc. (BIDU)
Until today’s surge, BIDU had been a major disappointment. I have posted (and tweeted) on BIDU several times in anticipation of a quick resumption of its post-earnings momentum. Instead, the stock has churned and dribbled downward in a surprisingly display of under-performance. With the indices still in bullish form, I refused to give up. Today was a huge payoff as my latest tranche of call options triggered a sell and a lock on nice profits (greatly timed to greatly ease the pain of the SPLK mishap!). Looking at the close, I actually half-wish I still had half a position on. The resumption of BIDU’s bullish ways could be mighty swift if the market decides to stay aloft.
Daily T2108 vs the S&P 500
")
Black line: T2108 (measured on the right); Green line: S&P 500 (for comparative purposes)
Red line: T2108 Overbought (70%); Blue line: T2108 Oversold (20%)
Weekly T2108

*All charts created using freestockcharts.com unless otherwise stated
Related links:
The T2108 Resource Page
Expanded daily chart of T2108 versus the S&P 500
Expanded weekly chart of T2108
Be careful out there!
Full disclosure: long TSLA call spread, short TSLA shares, short SPLK, long RAX call options