
(T2108 measures the percentage of stocks trading above their respective 40-day moving averages [DMAs]. It helps to identify extremes in market sentiment that are likely to reverse. To learn more about it, see my T2108 Resource Page. You can follow real-time T2108 commentary on twitter using the #T2108 hashtag. T2108-related trades and other trades are posted on twitter using the #120trade hashtag)
T2108 Status: 56.1%
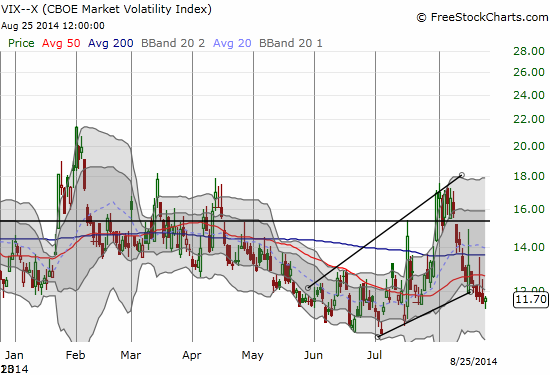
VIX Status: 11.7%
General (Short-term) Trading Call: Hold (Bullish)
Active T2108 periods: Day #295 over 20% (includes day #280 at 20.01%), Day #9 over 40%, Day #7 over 50% (overperiod), Day #34 under 60%, Day #35 under 70%
Reference Charts (click for view of last 6 months from Stockcharts.com):
S&P 500 or SPY
SDS (ProShares UltraShort S&P500)
U.S. Dollar Index (volatility index)
EEM (iShares MSCI Emerging Markets)
VIX (volatility index)
VXX (iPath S&P 500 VIX Short-Term Futures ETN)
EWG (iShares MSCI Germany Index Fund)
CAT (Caterpillar).
Commentary
T2108 has not made much progress since the last T2108 Update on August 19th. However, the S&P 500 (SPY) has. The bounce from oversold conditions continues in nearly a straight line. Today, it made new all-time highs and crossed 2000 for a brief moment (of course, it could not stay above that line on the first visit).
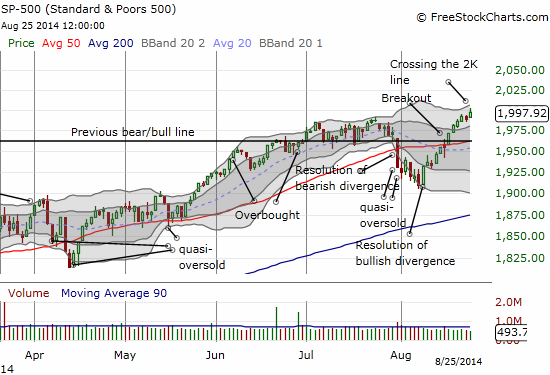
While this move has been sharper than expected, the path toward the top of the Bollinger Band is as expected. Now note how the Bollinger Bands (BB) are opening up. Much to the chagrin of the bears piling on against this move, the S&P 500 could be warming up for even more upside before the next corrective phase. As planned, I sold out my aggressively collected call options on ProShares Ultra S&P500 (SSO). It was a very nice double. Although they did not expire until this Friday, I have no regrets since I believe I made an overall good risk/reward play.
Based on the headlines and tweets I see, I am amazed at how some bears act a lot like the Fed: nothing ever seems to disprove their theories. The Fed insisted that if accommodative policies were not working, it was because they were not accommodative enough. For bears, if the stock market charges to ever higher and higher prices, then the odds of a massive correction/crash/collapse just becomes even more likely. Will it be vindiciation to watch the S&P 500 race up to 2500 in a few years only to finally collapse to 2000 in the next bear market?
Anyway, I understand the pain of the bears since the 5% gain in just three weeks certainly seems like a lot given all the headlines swirling around. I am amazed because August was supposed to be the start of the two-month “danger zone” for the stock market. But price action must be respected nonetheless…and T2108 even more.
With Jackson Hole behind us and Labor Day weekend ahead of us, I am guessing the rest of this week will be a lot of churn and teasing with the 2K level. I will just end things here with a few chart reviews and trade updates.
First, note the VIX, the volatility index, could not hold the presumed upward trading channel. So all bets are off for a phase of steadily rising volatility (all Central Banks groan on cue here). Now the VIX could just as easily drop back to multi-year lows.
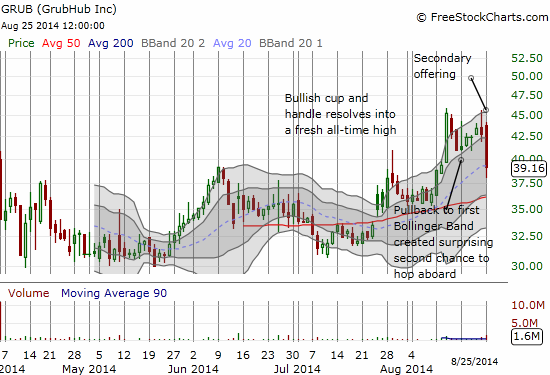
GrubHub (GRUB)
“Ugh” is the best way to describe this one. The technical setup delivered for me for a brief moment on Friday, August 22, but I chose not to sell. I wanted to try to hold on for follow-through since the stock market is in such a bullish mood. Instead, I got a nasty surprise today with a stock halt, news of a secondary offering, and a takedown that ended in a 8.4% loss on the day. The only slight saving grace is that the uptrend remains intact with the 20 and 50-day moving averages (DMAs). This episode just confirms for me that you can hardly trust hot IPOs for more than a hot minute. I am not hating on the insiders dumping shares here. They SHOULD be. My timing and/or execution was just lacking.
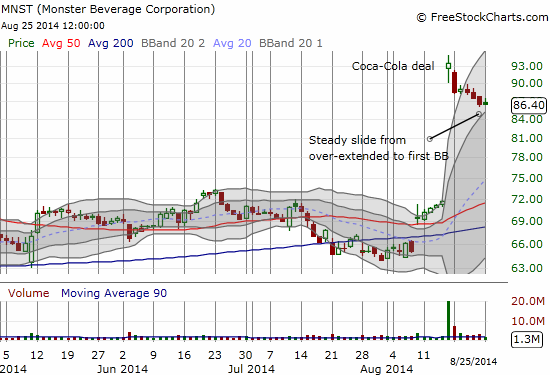
Monster Worldwide Beverage (MNST)
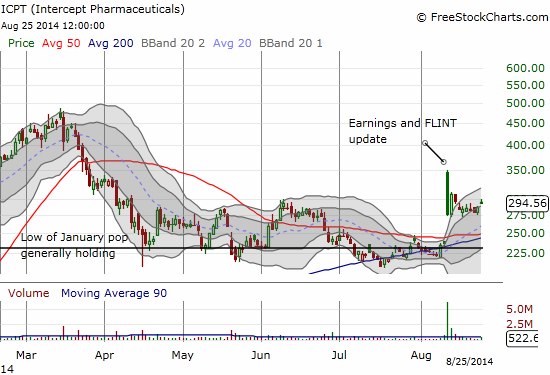
This stock broke out big time on August 15th when a deal with Coca-Cola (KO) was announced. KO also gapped up. KO has kept its gains, MNST has been sliding ever since. I have checked in on the stock every day and finally decided to pounce with some speculative call options. I am guessing the extreme initial move was driven by shorts screaming bloody murder. As regular readers know, extreme moves above the upper-Bollinger Band rarely last and that was the case with MNST. My setup here is a slight slowing in downward momentum at the first Bollinger Band.
Intercept Pharmaceuticals, Inc. (ICPT) is an example of this kind of first BB setup. I earlier anticipated more of a pullback, but buyers readily stepped into the setup. ICPT got a small gap up today above the small consolidation period. I am still NOT a buyer on this one though!
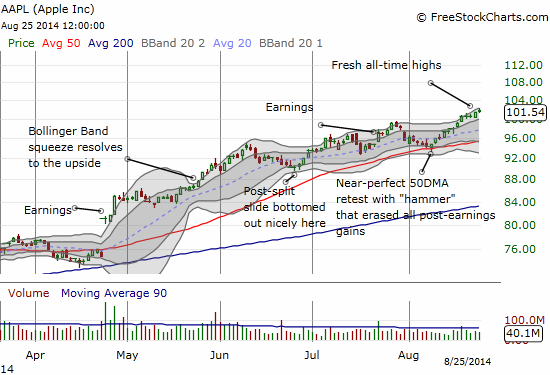
Apple (AAPL)
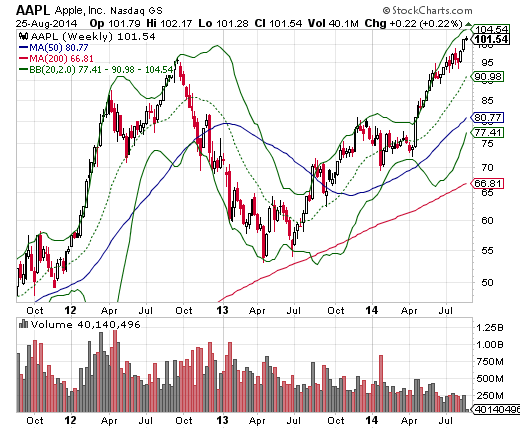
I would be remiss to post without a celebration of new all-time highs on Apple (AAPL). I think of this chart as the culmination of a somewhat brash prediction I made in early May: “A Turnaround In Apple Sentiment Should Push The Stock Back To All-Time Highs.” It is also validation of a call I made a year before that for a bottom in Apple in “An Apple Bottom As Sentiment Finally Turns Southward (Put Buying Soars).” It is definitely time to do another sentiment check and update my expectations if I can.
Daily T2108 vs the S&P 500
")
Black line: T2108 (measured on the right); Green line: S&P 500 (for comparative purposes)
Red line: T2108 Overbought (70%); Blue line: T2108 Oversold (20%)
Weekly T2108

*All charts created using freestockcharts.com unless otherwise stated
Related links:
The T2108 Resource Page
Expanded daily chart of T2108 versus the S&P 500
Expanded weekly chart of T2108
Be careful out there!
Full disclosure: long GRUB, long AAPL call options, long MNST call options