
(T2108 measures the percentage of stocks trading above their respective 40-day moving averages [DMAs]. It helps to identify extremes in market sentiment that are likely to reverse. To learn more about it, see my T2108 Resource Page. You can follow real-time T2108 commentary on twitter using the #T2108 hashtag. T2108-related trades and other trades are posted on twitter using the #120trade hashtag)
T2108 Status: 28.0%
VIX Status: 15.7
General (Short-term) Trading Call: Selective buying for short-term trades. Fade rallies, preferably at or near resistance. Nuances explained in the past five T2108 Updates.
Active T2108 periods: Day #283 over 20% (includes day #280 at 20.01%), Day #7 under 30% and 40% (underperiods), Day #11 under 50%, Day #22 under 60%, Day #25 under 70%
Reference Charts (click for view of last 6 months from Stockcharts.com):
S&P 500 or SPY
SDS (ProShares UltraShort S&P500)
U.S. Dollar Index (volatility index)
EEM (iShares MSCI Emerging Markets)
VIX (volatility index)
VXX (iPath S&P 500 VIX Short-Term Futures ETN)
EWG (iShares MSCI Germany Index Fund)
CAT (Caterpillar).
Commentary
For the July 30th T2108 Update I described a “quiet bearish divergence” between a plunging T2108 and an S&P 500 (SPY) that was barely budging off all-time highs. On July 31st, the S&P 500 made a decisive plunge that sliced right through the previous bear/bull dividing line and 50DMA support for a 2% loss on the day. For the August 7th T2108 Update I described a distinct bullish divergence that was weakened a bit by various caveats. The next day, the S&P 500 jumped a very respectable 1.2% and T2108 surged a very convincing 21.2% to close at 28.0%. I would be bold enough to call this a confirmed bottom if not for a few caveats…yes, again.
Let’s quickly step through the caveats.
The S&P 500 is still locked into a downtrend from the 50DMA breakdown. Friday’s close was strong but it stopped right at the edge of the first Bollinger Band (BB) which currently defines the top of the downtrend channel. Aggressive shorts and determined bears are likely to short/reload here. Shorting here is also consistent with the current trading rule to reserve shorting for rallies into resistance.
As I discussed on ReaMoneyPro on Wednesday I have been waiting for market strength to reestablish a net short position.
Shorted $SPY 193.27
— Douglas Kass (@DougKass) August 8, 2014
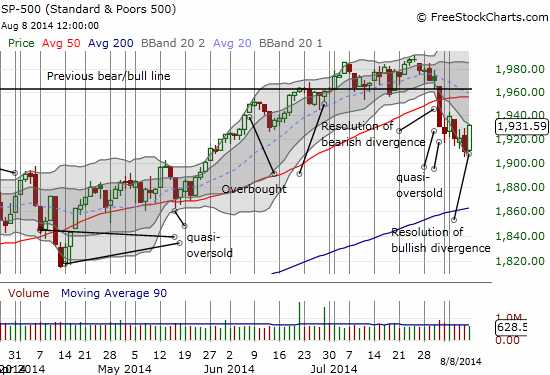
Of course, the most important looming caveat on the S&P 500 is likely overhead resistance at the 50DMA. I will cross that bridge when the market gets there.
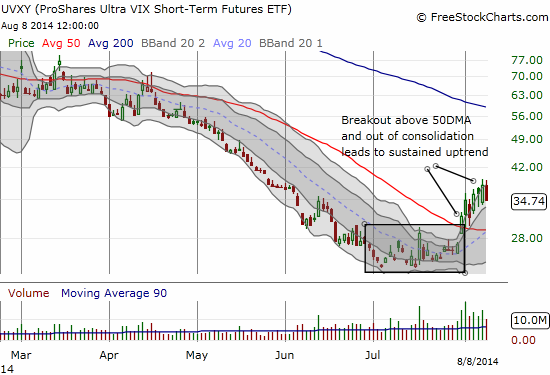
I still prefer NOT to short the S&P 500 and instead buy shares in ProShares Ultra VIX Short-Term Futures (UVXY). My limit order for a small reload filled perfectly at the bottom of the uptrend channel for UVXY. As a reminder, these shares are my hedge on ProShares Ultra S&P500 (SSO) call options. I have been selling my shares as soon as UVXY pops 10% or so. This is my fourth round on UVXY shares. To make matters more complex, I am maintaining longer-term UVXY puts in anticipation of UVXY’s eventual collapse as history suggests is near certain to happen at some point (this assumption also compels me to get in and out of UVXY shares quickly).
The SSO call options were my trade of choice for playing a bounce out of quasi-oversold conditions. The call options expire on Friday, August 16th so time is running out on them. In retrospect, I am recalling that it would have been better to buy SSO shares. All the caveats and uncertainties involved in this episode of back-to-back quasi-oversold conditions followed by a brush with true oversold conditions (below 20%) should have told me patience would be more valuable than strident aggressiveness. Another lesson (re)learned.
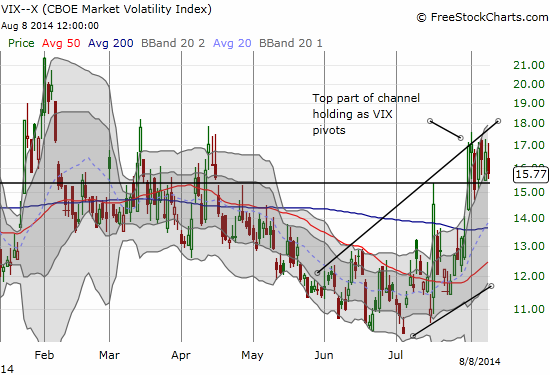
This leads to thhe second major caveat on calling a confirmed bottom. The volatility index, the VIX, plunged on Friday but it stopped short of breaking through the 15.35 pivot. It is still in perfect position to spike higher at anytime into the top of the presumed channel.
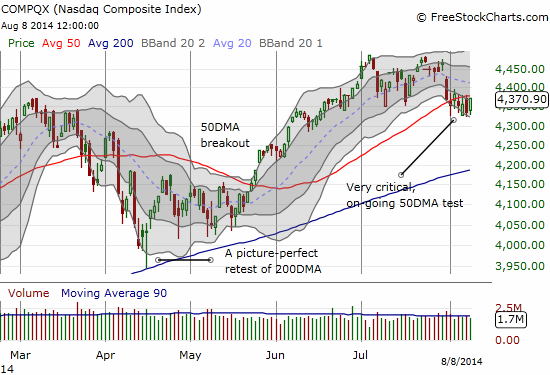
The last caveat comes from the NASDAQ (QQQ). I am watching the tech-laden index moer carefully than ever because it has churned around its 50DMA ever since the current sell-off began in earnest on July 31st. So, it is out-performing the S&P 500 and trying to vie for position as an important indicator for bear/bull follow-through.
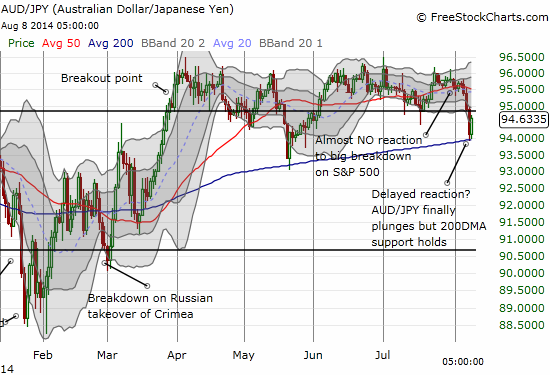
The biggest positive in support of a sustained bottom is my favorite indicator after T2108: the Australian dollar versus the Japanese yen (AUD/JPY). It jumped in convincing fashion off its 200DMA and ended the week near its high for the day. A similar jump on May 21st immediately preceded the S&P 500’s last major breakout to all-time highs. Note well that AUD/JPY was a LAGGING indicator for the current sell-off. Its lack of response on July 31st sent me along the path of aggressively betting on a bounce from (quasi)oversold conditions.
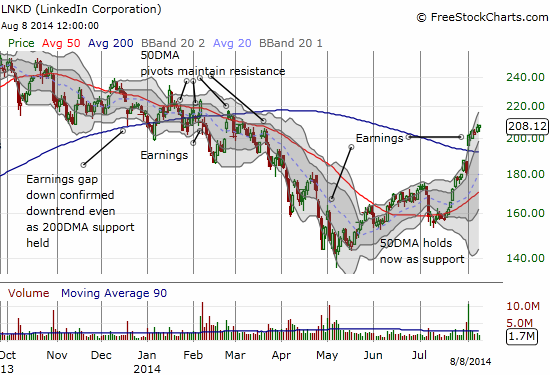
Another positive is the ability for many momentum and high-multiple stocks to stay aloft during the current market selling. We saw the exact opposite from March to May where the S&P 500 barely responded to a near-collapse in many of these stocks. For example, LinkedIn (LNKD) is maintaining its post-earnings strength with fresh highs since gapping neatly over its 200DMA.
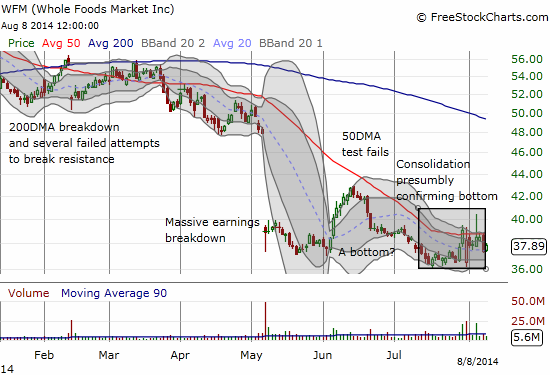
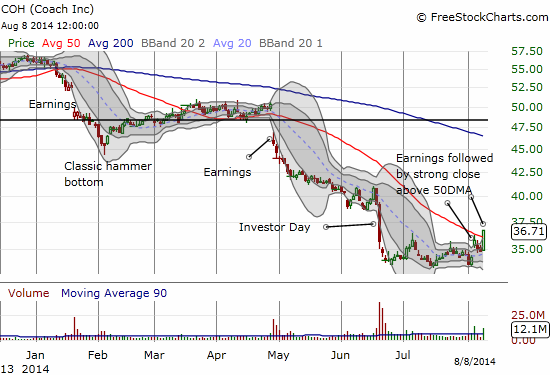
Some important fallen high-multiple/momentum angels like Whole Foods Market (WFM) and Coach (COH) are showing signs of bottoming with extended consolidation turning into what look like bases for future rallies. I have played both of them. I sold my last set of call options on WFM as it surged on rumors of Carl Icahn buying shares. I was of course relieved after I saw the major fade on the stock at the close. I rushed back into call options on Thursday’s selling. I hope Icahn will indeed show up to backstop my growing bullishness on WFM… 🙂
I realize that these examples may appear to be selective. There are of course plenty of stocks that I could find which sold off post-earnings. I have shown some stocks that gave me cause for concern. Most important of these is the on-going fade in Intel (INTC) from what was initially an impressive post-earnings gap up to 12 1/2 year highs. However, the bottoming stocks are important in this case because it is hard to imagine a significant sell-off continuing while such vulnerable stocks are actually holding their own.
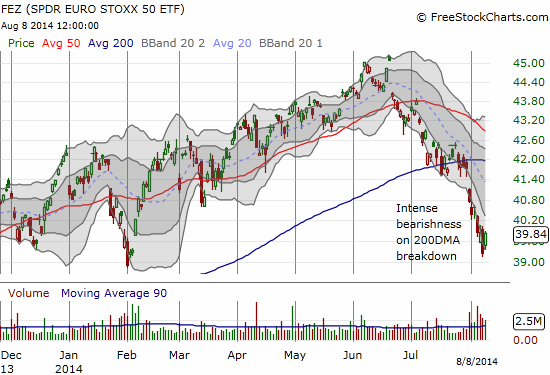
European stocks are increasingly on my radar. As I suspected in my last T2108 Update, the selling in these shares had become over-extended with so many days closing below the lower-BB. Sure enough, SPDR EURO STOXX 50 (FEZ) gapped up and never looked back on Friday in a classic rubber band snapback. I am still holding my puts in iShares MSCI Spain Capped (EWP); I will exit if selling does not resume on Monday.
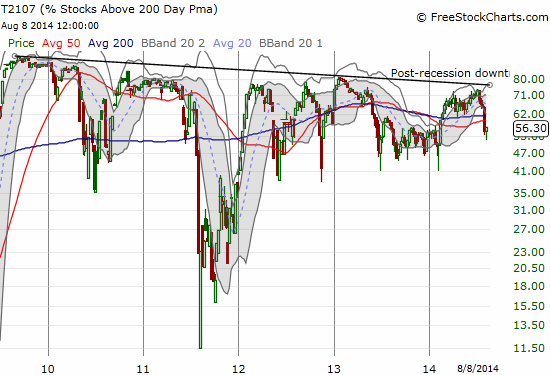
Finally a Twitter follower reminded me to look at T2107, the percentage of stocks trading above their 200DMAs. I do not use T2107 in active trading. I find it more important for making guesses at longer-term trends. The current selling episode neatly confirmed the on-going post-recession downtrend in T2107. T2107 is an on-going enigma. Note the weakness in T2107 through most of 2013, a year where the S&P 500 soared over 20%. As a reminder I am watching for T2107 to break the downtrend as a signal that the overall bull market may be finally in its last stages. Such a breakout preceded the end of the last bull market that ended in the financial crisis.
Daily T2108 vs the S&P 500
")
Black line: T2108 (measured on the right); Green line: S&P 500 (for comparative purposes)
Red line: T2108 Overbought (70%); Blue line: T2108 Oversold (20%)
Weekly T2108

*All charts created using freestockcharts.com unless otherwise stated
Related links:
The T2108 Resource Page
Expanded daily chart of T2108 versus the S&P 500
Expanded weekly chart of T2108
Be careful out there!
Full disclosure: long UVXY shares and puts, long SSO call options, net short the Australian dollar, long WFM call options