Yikes.
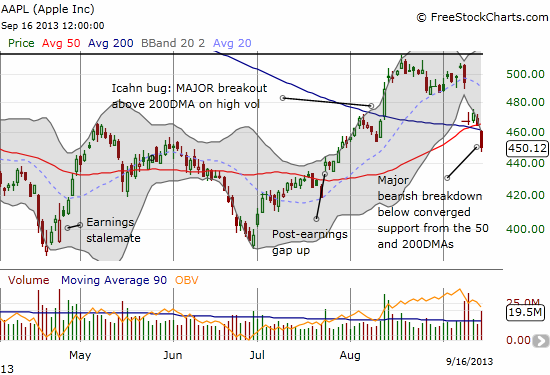
Today was a particularly ugly day for Apple (AAPL) fans and bulls. The stock followed through on weakness from last week’s product event with a MAJOR bearish breakdown below critical support at the 50 and 200-day moving averages (DMAs). This also takes AAPL below its “Icahn support.” (Nightly Business Report blamed news of a reduction in iPhone subsidies from China Telecom. See more details in Bloomberg article “China Unicom Reservations for New IPhones Pass 100,000 Units“).

Source: FreeStockCharts.com
The Apple Trading Model (ATM) had projected a 93% chance of an up close that was very consistent with AAPL’s strong tendency to start the week on a strong note. I confidently bought a weekly call option into Apple’s weak close on Friday based on this history. The first warning sign was seeing AAPL “only” up a point or two even as stock futures were soaring 1% or so. Sure enough, as time ticked into the open, AAPL suddenly went red by around 3 points and a gap down was in full swing.
Given the bullish projection for Monday, I was at first tempted to double down in anticipation of an eventual intraday recovery. However, it occurred to me that this particular breakdown was so bearish that it was invalidating the ATM. Specifically, the ATM does not take into consideration opens, closes, gaps, support, or resistance. It was time to turn the model off for a bit and simply accept the glaringly bearish technicals of a breakdown below critical support. I quickly bought put options. These increased quickly by 30% or so, but went back to flatline as AAPL attempted to stabilize. Unsurprisingly, AAPL’s weakness picked up again and by the close I was selling puts that had doubled in value (weekly puts with a $440 strike). I sold the puts because AAPL is now extended well below its lower-Bollinger Band. While this is a sign of significant downside bias, the odds for a quick (albeit temporary) bounce are high enough to discourage me from daring to hold profits overnight on options expiring in 4 days…especially with a Federal Reserve meeting in between!
I am taking this bearish breakdown very seriously. AAPL is essentially dead in the water until it can EITHER manage to close above extend past what is now resistance at the DMAs and/or sell-off “too far, too fast.” Determining a tradeable oversold condition for AAPL will not be easy; one example might be three straight days closing below the lower-Bollinger Band. In the meantime, I will only trade from the ATM when it predicts a down day. I will also tend to fade any rallies late in the week. Next technical support for AAPL is a fill of the July post-earnings gap up. If/when that happens, I will re-evaluate my approach.
As I promised on twitter earlier in the day, I ran some numbers to see whether I could develop some expectations for the rest of the week for Apple when Monday delivers a down close. All data are for weeks where trading was open for BOTH Monday and Friday. I focused on data since 2010.
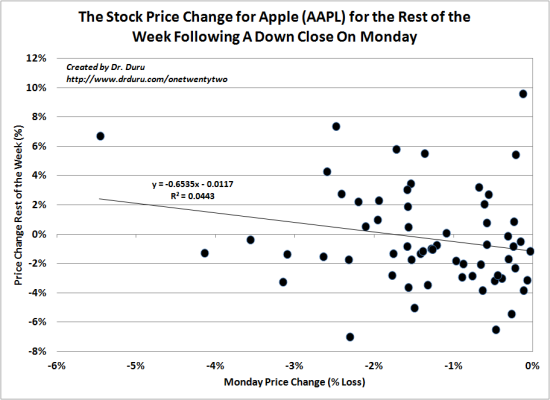
Since 2010, there is no correlation between Apple’s performance on a down Monday and its performance for the rest of the week in any given year. The chart below shows the related scatterplot across all four years (2010 to 2013, inclusive). I included the trendline (regression) and its formula for those interested. Notice the extremely low R^2 value. More importantly, notice how few times Apple has closed as badly as it did on this Monday. The 3.18% loss is only exceeded by three other trading days and two other ones came close. Based on these data, I expect Apple to close this week with approximately another 2% loss from Monday’s close.

Source for Data: Yahoo Finance
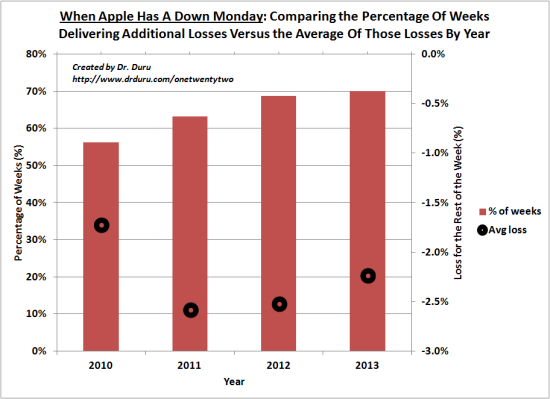
Here is an aggregated way to look at the data. The following chart shows the average loss for the rest of the week after Apple closes Monday on a down note. The bars show what percentage of weeks that start with a negative Monday deliver additional losses by the end of the week (left axis). The dots show the average loss (right axis). Be careful with the vertical axes: the left is positive, the right is negative.

Source for Data: Yahoo Finance
I was really hoping that Apple could hold support and eventually gap UP over the resistance represented by the closing of the gap down from January’s earnings. Instead, a Bollinger Band squeeze formed and this powerful technical formation resolved in a very bearish way for Apple. The damage is done. Apple will now need to find some new, powerful catalysts to resume its upside recovery. I will again be watching the open interest put/call ratio to see whether traders turn in their exuberance for calls into the sobering acceptance of puts. As I have covered in other pieces, Apple has very strong periods (or bouts) where its stock price is inversely correlated to the open interest put/call ratio.
Be careful out there!
Full disclosure: long AAPL shares and call options
