Daily S&P 500 Trading: Monday Under-performance, Tuesday Out-performance And Other Patterns

(This is an excerpt from an article I originally published on Seeking Alpha on May 16, 2013. Click here to read the entire piece.)

On Wednesday, May 15, the venerable Art Cashin on CNBC offered his observations on the strange consistency in the Tuesday trade since the S&P 500 (SPY) printed its low in 2012. {snip}

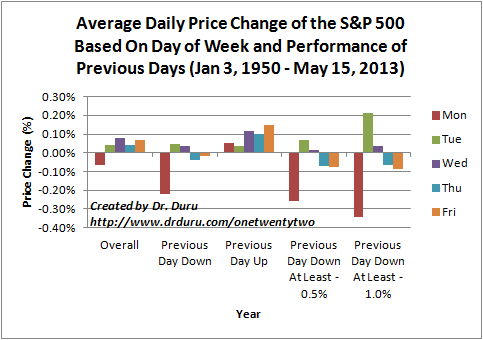
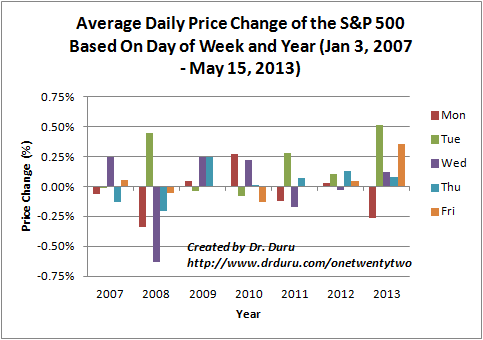
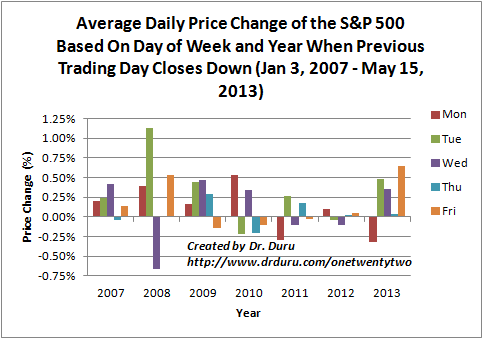
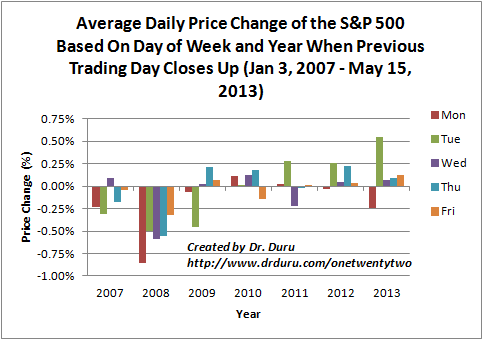
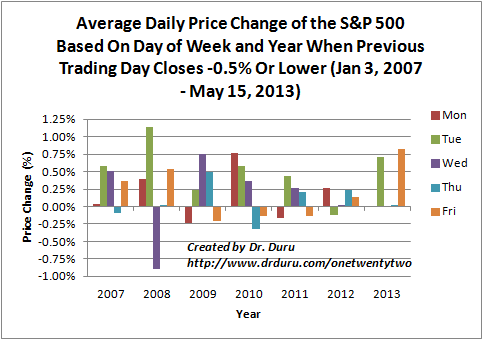
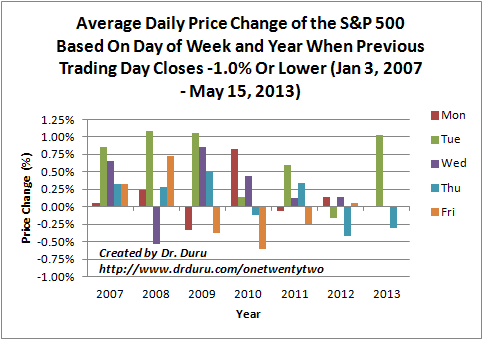
In fact, Tuesdays have an extended history of special behavior. Last year, I read an article from 2011 that discussed this behavior and theorized, like Cashin, that Tuesday’s strength comes somewhat at the expense of Mondays which suffer from weekend political and/or financial drama. A year ago this month, I wrote “S&P 500 Performance By Day Of Week And The Changing Nature Of Trading Tuesdays” to examine the daily trading patterns on the S&P 500 with a particular focus on Tuesdays. {snip}

Although Tuesday’s behavior changes from year-to-year, its relative consistency means that other daily trading scenarios co-exist with notable consistency. In this update, I found that as 2012 progressed the clear patterns from the first 5 months changed and in some cases weakened. I strongly suspect that 2013’s prominent patterns will also morph as the year progresses. Not surprisingly, the overall patterns since 1950 did not change as a result of the last year of trading.

{snip}


Average Daily Price Change of the S&P 500 Based On Day of Week and Performance of Previous Days (Jan 3, 1950 - May 15, 2013)
Average Daily Price Change of the S&P 500 Based On Day of Week and Performance of Previous Days (Jan 3, 1950 – May 15, 2013)

Average Daily Price Change of the S&P 500 Based On Day of Week and Year (Jan 3, 2007 - May 15, 2013)
Average Daily Price Change of the S&P 500 Based On Day of Week and Year (Jan 3, 2007 – May 15, 2013)
Average Daily Price Change of the S&P 500 Based On Day of Week and Year When Previous Trading Day Closes Down (Jan 3, 2007 - May 15, 2013)
Average Daily Price Change of the S&P 500 Based On Day of Week and Year When Previous Trading Day Closes Down (Jan 3, 2007 – May 15, 2013)
Average Daily Price Change of the S&P 500 Based On Day of Week and Year When Previous Trading Day Closes Up (Jan 3, 2007 - May 15, 2013)
Average Daily Price Change of the S&P 500 Based On Day of Week and Year When Previous Trading Day Closes Up (Jan 3, 2007 – May 15, 2013)
Average Daily Price Change of the S&P 500 Based On Day of Week and Year When Previous Trading Day Closes -0.5% Or Lower (Jan 3, 2007 - May 15, 2013)
Average Daily Price Change of the S&P 500 Based On Day of Week and Year When Previous Trading Day Closes -0.5% Or Lower (Jan 3, 2007 – May 15, 2013)
Average Daily Price Change of the S&P 500 Based On Day of Week and Year When Previous Trading Day Closes -1.0% Or Lower (Jan 3, 2007 - May 15, 2013)
Average Daily Price Change of the S&P 500 Based On Day of Week and Year When Previous Trading Day Closes -1.0% Or Lower (Jan 3, 2007 – May 15, 2013)


Be careful out there!

(This is an excerpt from an article I originally published on Seeking Alpha on July 29, 2013. Click here to read the entire piece.)

Full disclosure: no positions

Leave a Comment

This site uses Akismet to reduce spam. Learn how your comment data is processed.