

Stock Market Analysis Summary
|
Stock Market Commentary
There were two major themes that dominated trading in last week’s market. The first theme involved the Federal Reserve, which delivered its last statement on monetary policy for the year. The Fed cut its interest rate just as the market demanded, but the bond market reacted unfavorably. Long-term bond yields increased, and now the stock market faces the exact same scenario from the last Federal Reserve cut. Long-term yields went higher, bond prices went down, and that action weighed on the stock market. In fact, yields have been in a short-term uptrend since the October Fed cut. Now, despite a breakout in market breadth, a tired AI trade may be enough to cap the stock market at its prior peak.
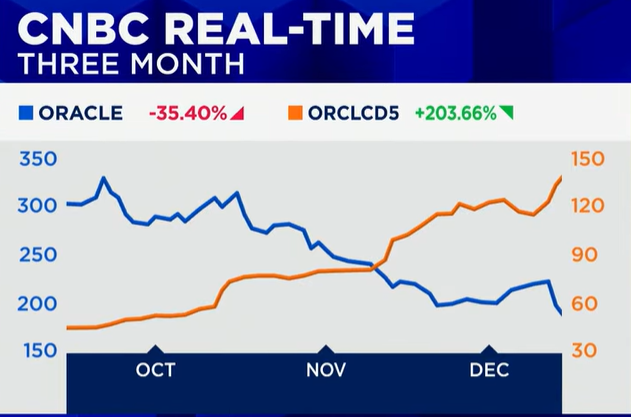
A disastrous response to Oracle’s (ORCL) latest earnings report underscored what increasingly resembles a tired AI trade. ORCL tumbled about 11% post-earnings and suffered follow-through selling on Friday. There is ever-increasing worry about Oracle’s spending commitments to deliver on its massive backlog. If a year-end rally still unfolds, the AI trade may be a notable laggard.
The Stock Market Indices
S&P 500 (SPY)
The S&P 500 (SPY) gained 0.7% in the wake of the Fed rate cut. An intraday pullback the next day did not hold and the index pushed to a marginal all-time high. I thought the S&P 500 survived ORCL’s earnings intact until the sellers took over on Friday to send the index to a 1.1% loss. With the 20-day moving average (DMA) (the dashed line) and the 50DMA (the red line) converged to form support, I am far from bearish on the market. Still, a topping pattern is emerging and subduing my short-term expectations.
")
NASDAQ (COMPQX)
The NASDAQ failed to set a new all-time high before losing 1.7% on Friday and testing 50DMA support. A topping pattern looms even larger for the tech-laden index. Still, I will not consider the top confirmed unless the NASDAQ closes below the November low at 22,078.
")
iShares Russell 2000 ETF (IWM)
The iShares Russell 2000 ETF had a great breakout all week long and printed new all-time highs. However, the 1.5% loss on Friday may have ended momentum for now. I am not ready to call a top, unlike the other two major indices, but I do need to see a positive start to the coming week to keep the year-end rally narrative alive.
")
The Short-Term Trading Call with Rate Cute Tailwinds
- AT50 (MMFI) = 59.7% of stocks are trading above their respective 50-day moving averages
- AT200 (MMTH) = 61.9% of stocks are trading above their respective 200-day moving averages
- Short-term Trading Call: neutral
AT50 (MMFI), the percentage of stocks trading above their respective 50DMAs, closed the week at 59.7%. The day before, my favorite technical indicator broke out above its primary downtrend (see the chart at the end of the post) and closed above 60% for the first time in over two months. The bullish move looked like a launching pad for continuing a year-end rally and even hitting overbought conditions. Friday’s small pullback on the tired AI trade immediately put the breakout in jeopardy. With the S&P 500 and the NASDAQ potentially topping out, a tired AI trade and higher long-term bond yields weighing on the breakout for market breadth, I remain quite comfortable leaving my short-term trading call at neutral.
AT200 (MMTH), the percentage of stocks trading above their respective 200DMAs, looks a little better than AT50. This longer-term indicator of the health of market breadth definitively broke out on Fed day and comfortably held those gains into the end of the week. AT200 trades fractionally below the high of the year set on Thursday.
The Equities: Tired AI Trade
Oracle Corporation (ORCL)
Description: Oracle Corporation provides enterprise software, cloud infrastructure, and database technologies to businesses and organizations worldwide.
Technical status: Oracle Corporation (ORCL) broke below prior all-time high support, failed at its 200DMA, and sold off sharply post-earnings, confirming a bearish breakdown.
Trade commentary: I concluded earlier that once ORCL dropped below its former all-time high, that move was bearish for the stock. ORCL tried to hold 200DMA support, failed, staged a fake rally into earnings, and then dropped 10.8% post-earnings. ORCL’s bearishness deepens with the irony of trading well below its price before the news of the big OpenAI deal sent the stock soaring 36%. Now I suspect ORCL is reaching maximum fear and panic. I bought a $200/$210 call spread expiring Friday as a first test of my hypothesis. ORCL fell another 4.5% on Friday but did not close below support from November’s intraday low. The chart below shows how the price of ORCL credit default swaps (CDSs) have soared since September.
")
Broadcom Inc. (AVGO)
Description: Broadcom Inc. designs and supplies semiconductor and infrastructure software solutions for data center, networking, and broadband markets.
Technical status: Broadcom Inc. (AVGO) sold off sharply after earnings but held near 50DMA support, keeping the uptrend barely intact.
Trade commentary: AVGO lost 11.4% after earnings. The uptrend is still barely holding at the 50DMA, and I am calling this trendline support for now. However, volume was extremely heavy, and I highly doubt AVGO is going to recover in the coming days given an apparently tired AI trade.
")
NVIDIA Corporation (NVDA)
Description: NVIDIA Corporation designs graphics processing units and computing platforms for gaming, data centers, and artificial intelligence applications.
Technical status: NVIDIA Corporation (NVDA) confirmed a double top and failed at 50DMA resistance, resulting in prolonged sideways price action.
Trade commentary: NVDA has “quietly” become dead money, leading the way in the tired AI trade. The double top from October is holding firm, and NVDA has gone essentially nowhere for 5 months. NVDA closed down 3.3% and remains near the lower end of its range. I am not calling NVDA bearish, but there is no actionable trade setup here given the clear failure at 50DMA resistance.
")
VanEck Semiconductor ETF (SMH)
Description: The VanEck Semiconductor ETF provides exposure to companies involved in semiconductor production and equipment.
Technical status: VanEck Semiconductor ETF (SMH) sold off sharply but held 50DMA support, keeping the longer-term uptrend intact.
Trade commentary: SMH dropped 4.5%, likely in sympathy with AVGO. The 50DMA is still holding as support, so SMH is still bullish. Still, such a sharp decline is a negative short-term signal. While SMH may be confirming a tired AI trade (so much of the momentum in the sector is driven by demand for AI-related chips), I am a buyer on a bounce from 50DMA support.
")
Micron Technology, Inc. (MU)
Description: Micron Technology, Inc. manufactures memory and storage solutions for computing and data center markets.
Technical status: Micron Technology, Inc. (MU) pulled back sharply ahead of earnings and may be forming a double top.
Trade commentary: MU fell 6.7% in sympathy with the tired AI trade. Micron will report earnings in the coming week, and I will be closely watching the post-earnings response. I recently took profits on a call spread position.
")
Intel Corporation (INTC)
Description: Intel Corporation designs and manufactures semiconductor chips and computing technologies for personal computers and servers.
Technical status: Intel Corporation (INTC) drifted lower and tested 50DMA support after pulling back from a recent peak.
Trade commentary: INTC has been drifting into a test of 50DMA support after a heady period of positive news flow. I want to get back into INTC for a trade, but I need to see a bounce from 50DMA support first.
")
Abercrombie & Fitch Co. (ANF)
Description: Abercrombie & Fitch Co. operates specialty retail brands offering apparel and accessories for consumers.
Technical status: Abercrombie & Fitch Co. (ANF) surged after earnings and continued a strong rebound despite short-term signs of exhaustion.
Trade commentary: ANF has maintained strong upward momentum ever since a 37.5% post-earnings gain. Sellers have started to show up intraday, so I am on alert after buying a position after opening the week strong. Tuesday’s follow-through to Monday’s positive opening made me realize I would not get my preferred entry at 200DMA support (the blue line).
")
Dollar Tree, Inc. (DLTR)
Description: Dollar Tree, Inc. operates discount retail stores offering a variety of consumer goods at value prices.
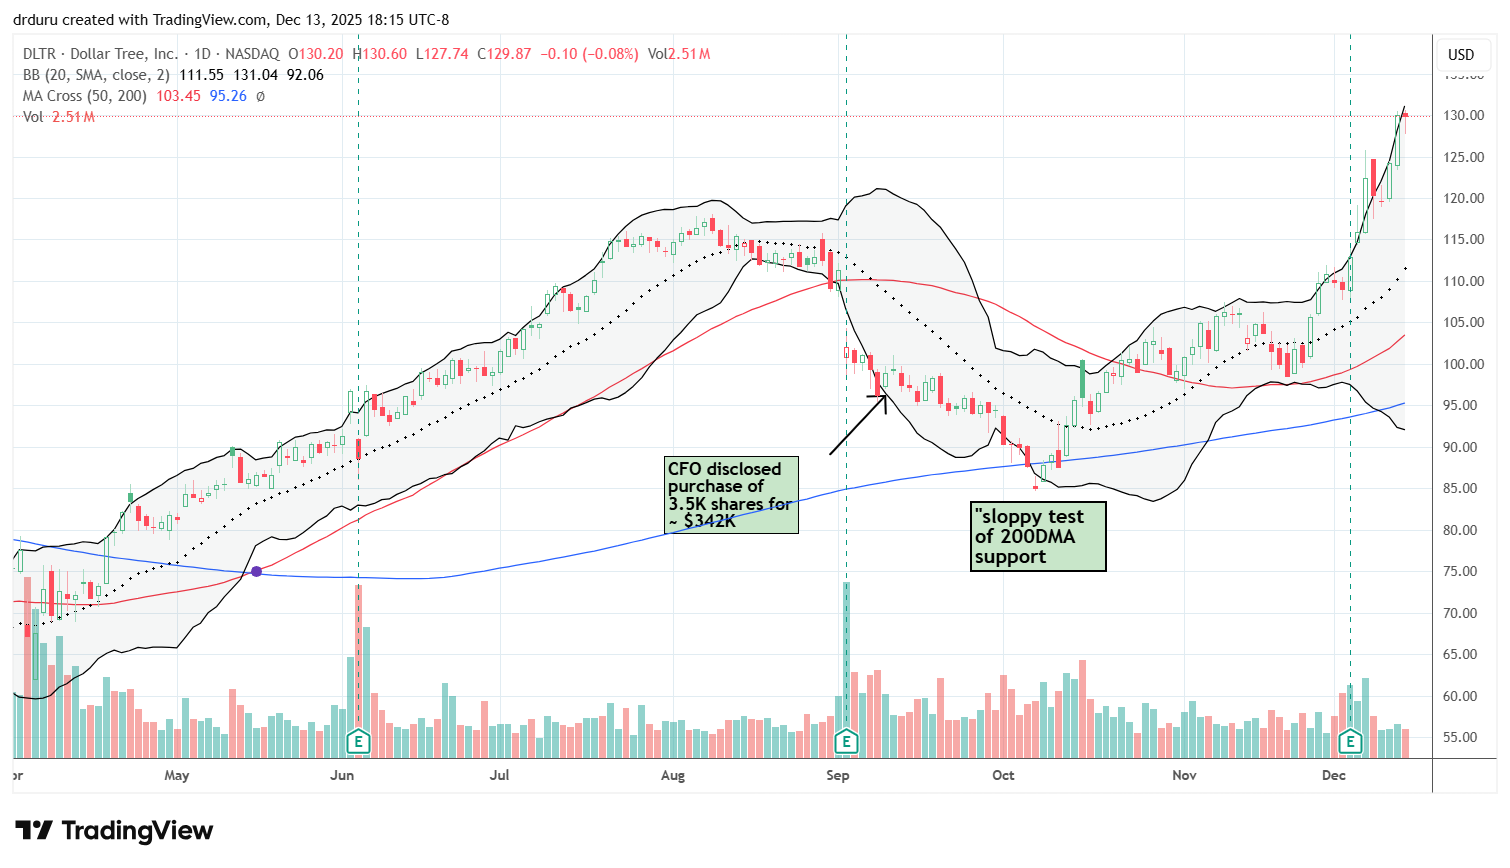
Technical status: Dollar Tree, Inc. (DLTR) pulled back modestly and then resumed its advance, confirming bullish momentum.
Trade commentary: I bought DLTR on a dip as planned. I did not wait for extended weakness given the impressive strength reinforced by the previous week’s post-earnings gains. This is a no-regret trade where I take on a small position in case the stock continues running up but small enough so I am motivated to add to the position on follow-through weakness. Now at 20-month highs, DLTR appears to have confirmed a bearish to bullish turnaround. I made the same trade on Dollar General Corporation (DG).
Shopify Inc. (SHOP)
Description: Shopify Inc. provides a commerce platform that enables businesses to create and manage online and retail storefronts.
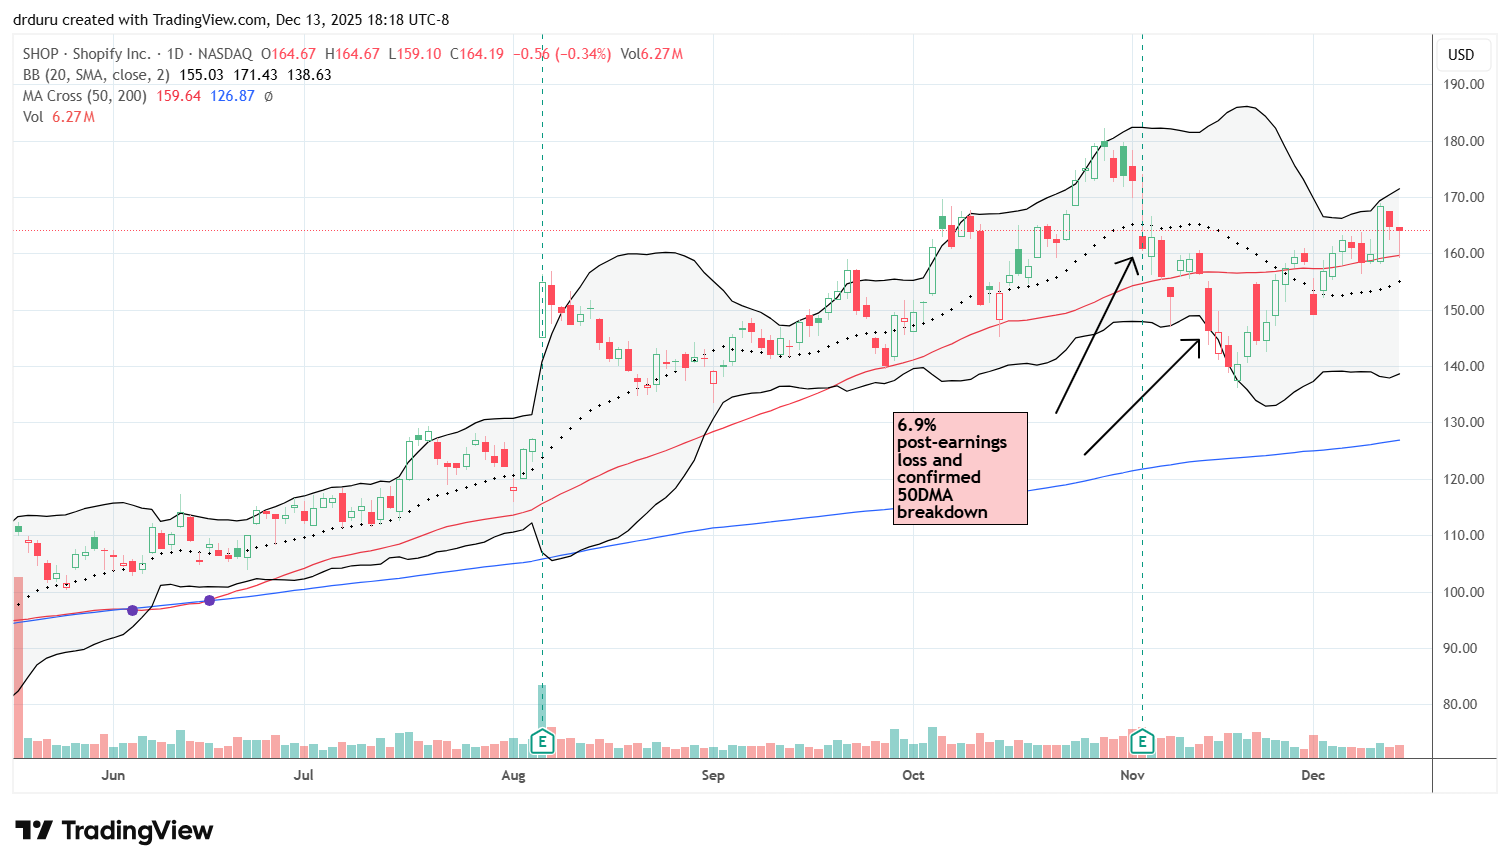
Technical status: Shopify Inc. (SHOP) chopped around its 50DMA, which continues to act as both support and resistance.
Trade commentary: SHOP has been very choppy around its 50DMA. I am in a call spread trade, and although the action has been frustrating, SHOP did rebound intraday off support on Friday. I am looking for a decisive breakout.
Toll Brothers, Inc. (TOL)
Description: Toll Brothers, Inc. designs and builds luxury residential homes in the United States.
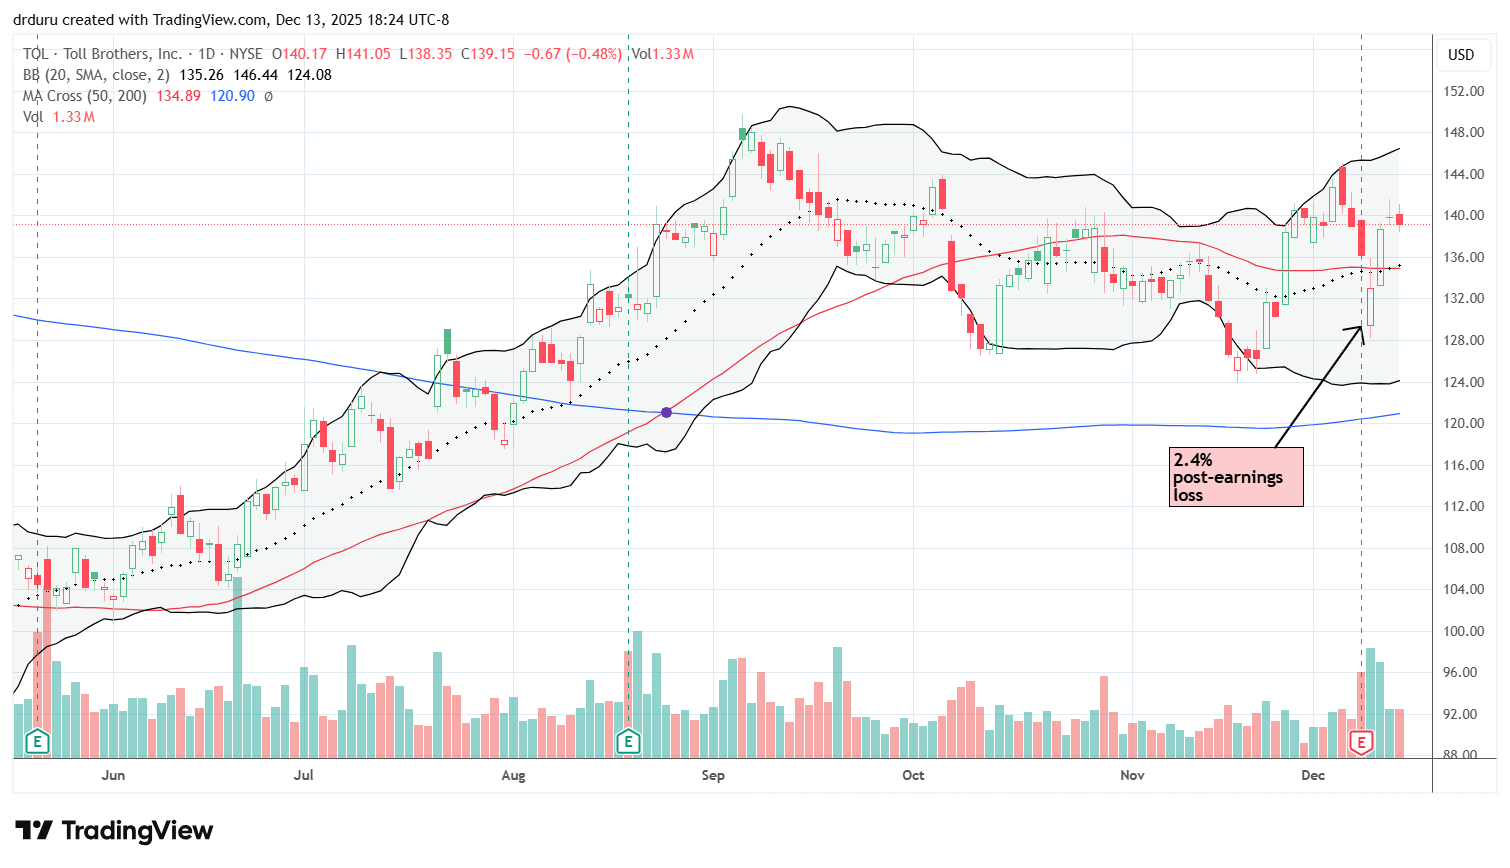
Technical status: Toll Brothers, Inc. (TOL) recovered strongly after a 2.4% earnings-related drop and closed a downside gap, signaling the resiliency of the seasonally strong period for home builder stocks.
Trade commentary: TOL dropped 2.4% initially after earnings but buyers stepped in aggressively. The gap closed, and the recovery confirms that the homebuilder trade remains alive and well.
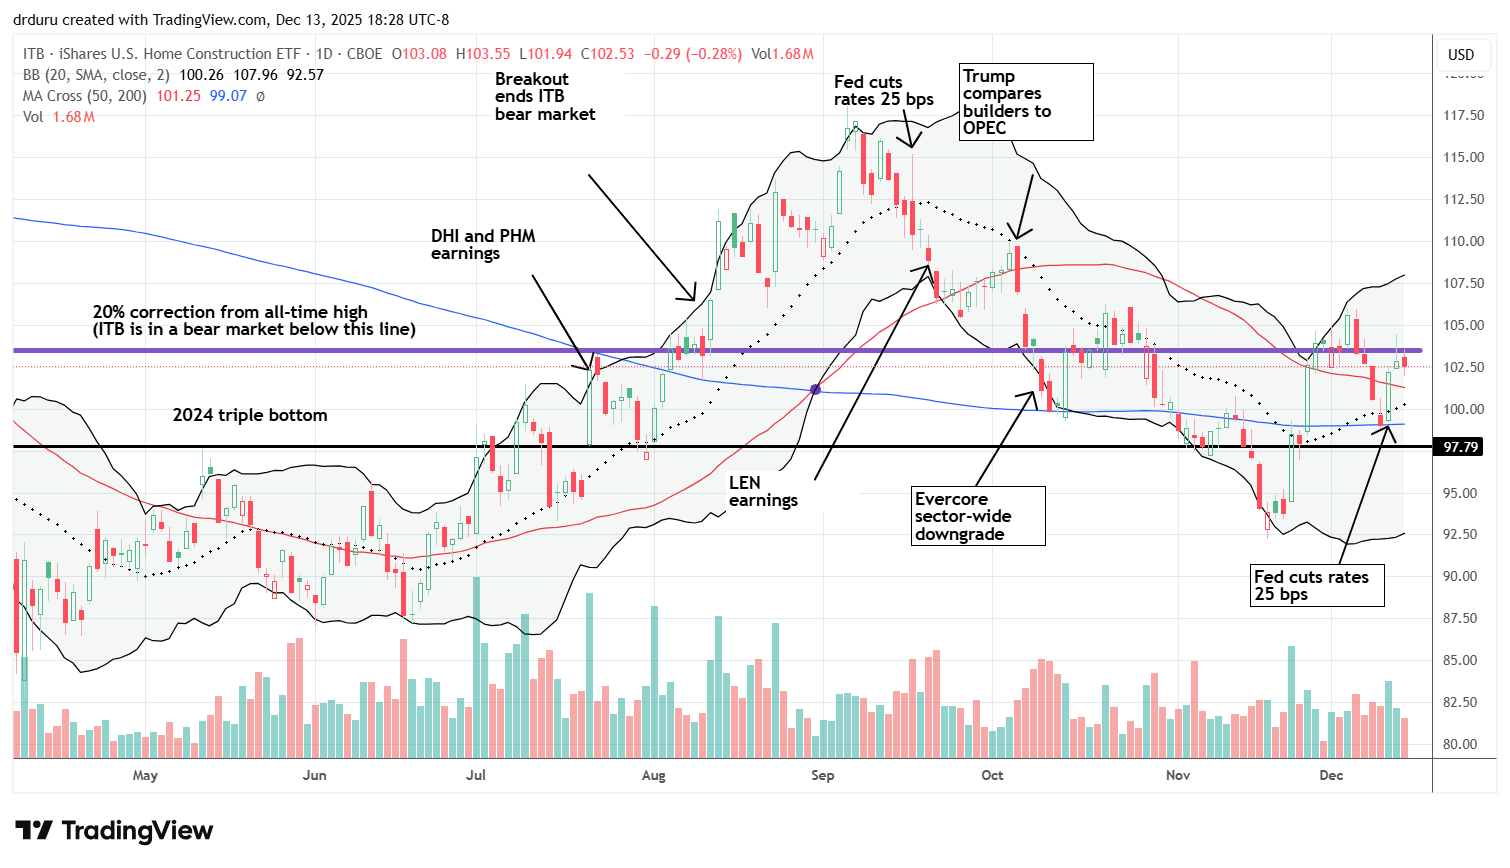
iShares U.S. Home Construction ETF (ITB)
Description: The iShares U.S. Home Construction ETF tracks U.S. companies involved in residential construction and homebuilding.
Technical status: The iShares U.S. Home Construction ETF (ITB) survived a test of 200DMA support but remains below its bear market threshold.
Trade commentary: ITB is still in bearish territory despite the recovery in individual homebuilders. I need to see ITB break higher before becoming more confident in the seasonal trade. I am actually surprised ITB maintained its strength for the week given the jump in yields on long-term bonds.
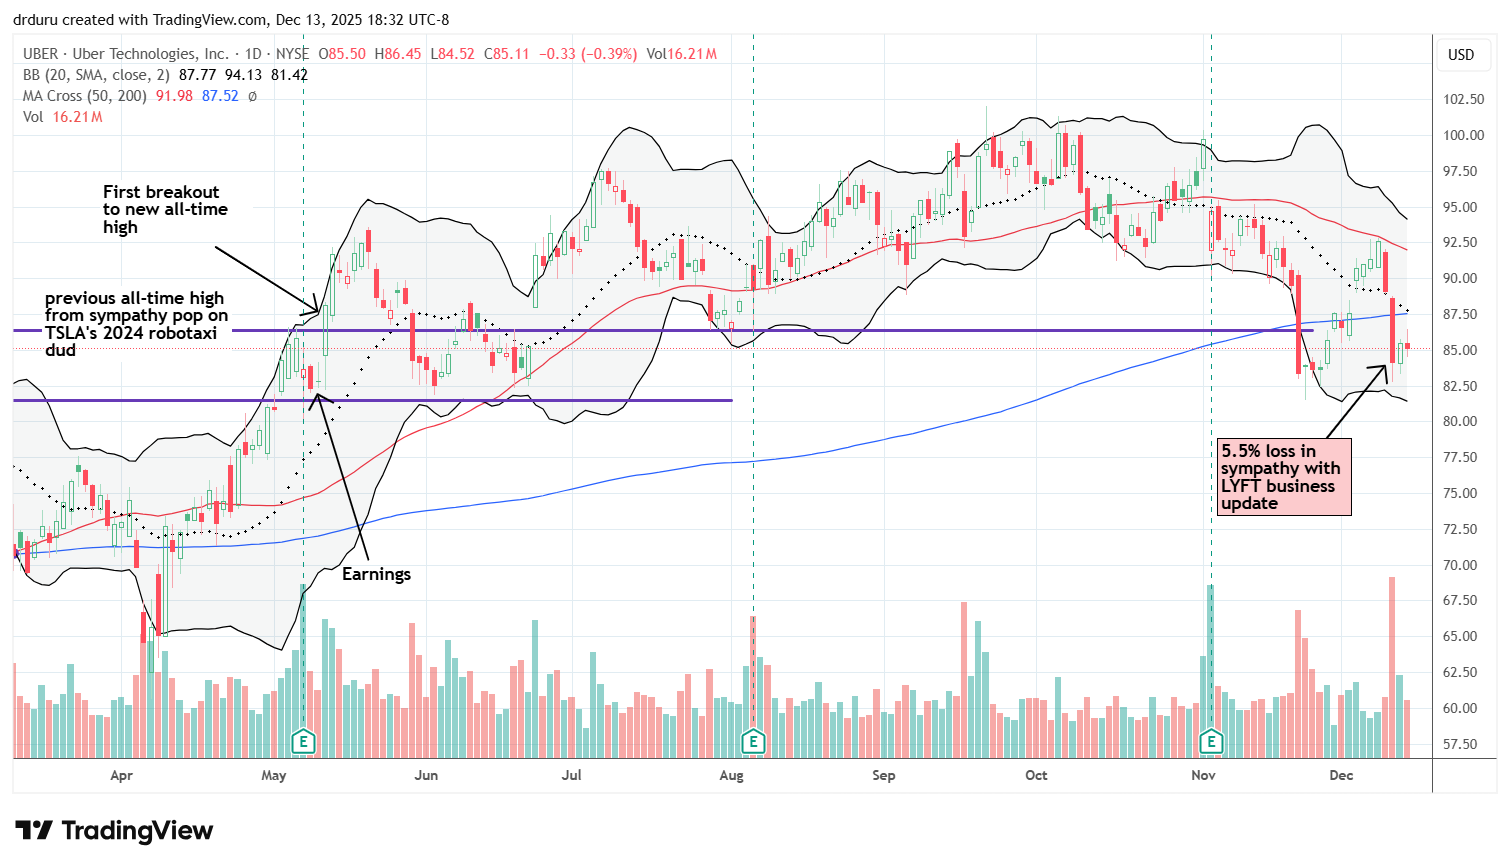
Uber Technologies, Inc. (UBER)
Description: Uber Technologies, Inc. operates a technology platform that connects riders, drivers, and delivery services globally.
Technical status: Uber Technologies, Inc. (UBER) stalled at declining 50DMA resistance after a sharp selloff in sympathy with a bad response to a business update from Lyft, Inc (LYFT).
Trade commentary: UBER lost 5.5% in sympathy with LYFT and confirmed overhead 50DMA resistance. . Selling stopped at November’s low, but now the stock’s run for new all-time highs appears over for a while. If UBER breaks below the November low, I will exit the position because trading below the 200DMA is bearish, especially when compared relative to the stock market’s bullish bias.
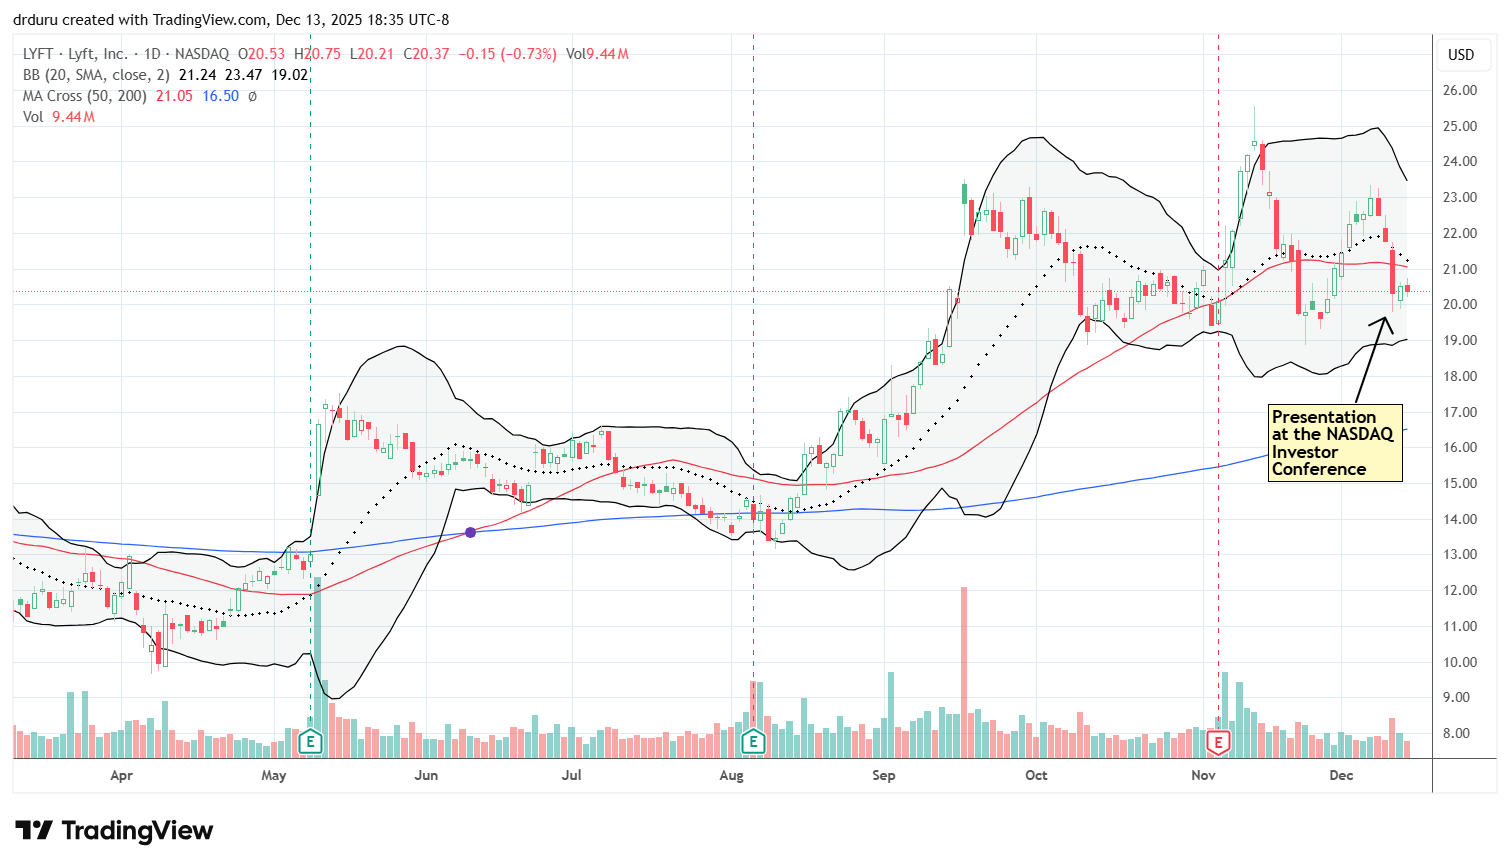
Lyft, Inc. (LYFT)
Description: Lyft, Inc. provides ride-hailing and transportation services through a mobile application.
Technical status: Lyft, Inc. (LYFT) pulled back sharply but continued to pivot around its 50DMA in a choppy consolidation.
Trade commentary: LYFT lost 6.7% after an investor conference presentation. Despite the selloff, LYFT remains in a relatively bullish position, and I am not overly worried for now. I could not find specific and direct commentary to explain the news-driven pullback.
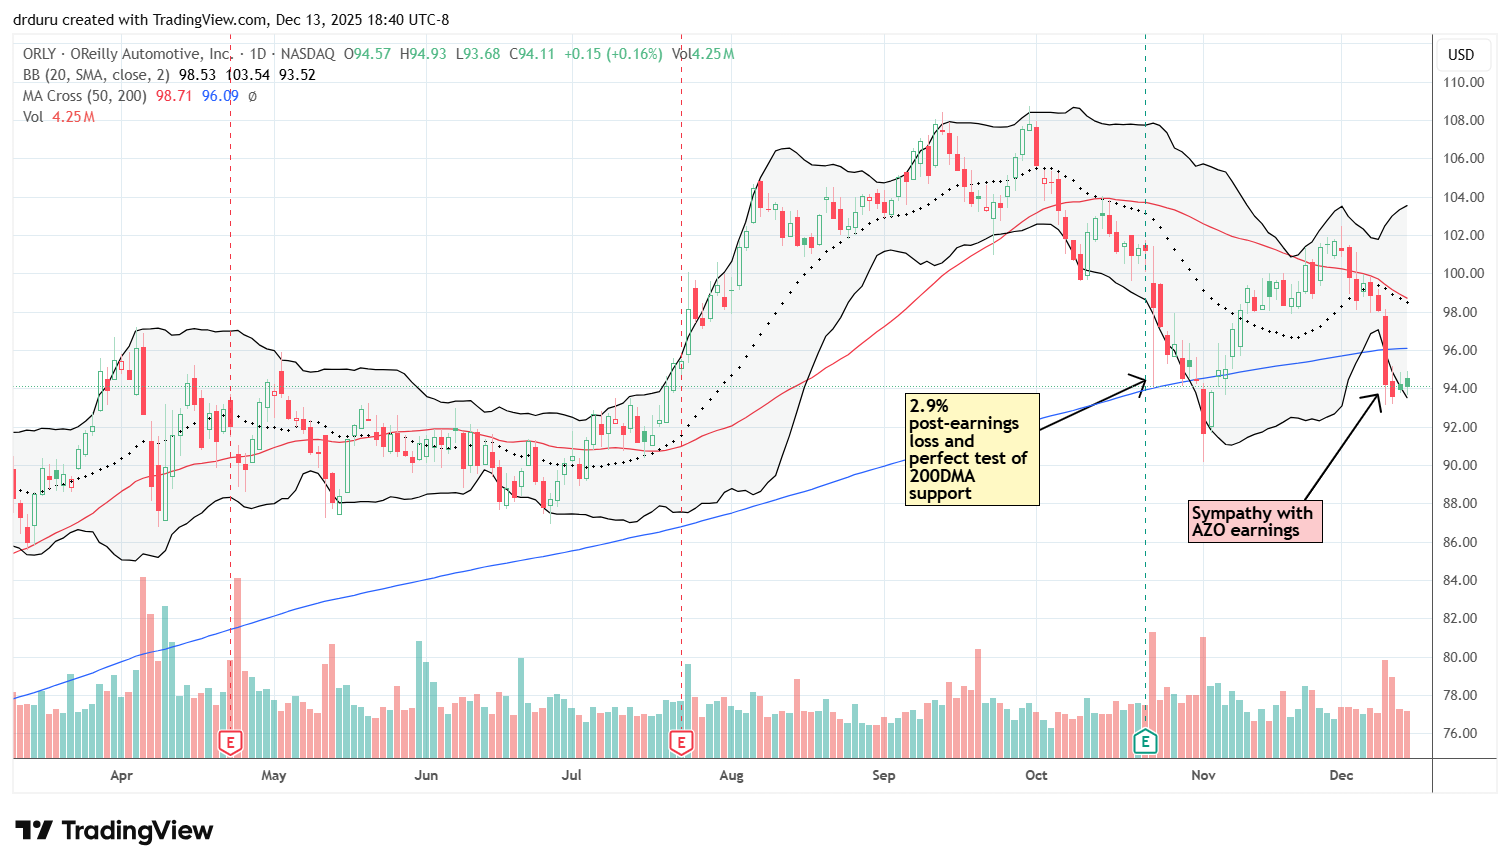
O’Reilly Automotive, Inc. (ORLY)
Description: O’Reilly Automotive, Inc. operates retail stores selling automotive replacement parts and accessories.
Technical status: O’Reilly Automotive, Inc. (ORLY) fell back below its 200DMA as multiple moving averages converged in a downtrend and the stock fell in sympathy with a poor response to earnings from Autozone (AZO).
Trade commentary: ORLY dropped in sympathy with AutoZone earnings and is back in a bearish position below the 200DMA. If ORLY breaks the low of the week, I will exit my trading position in the stock.
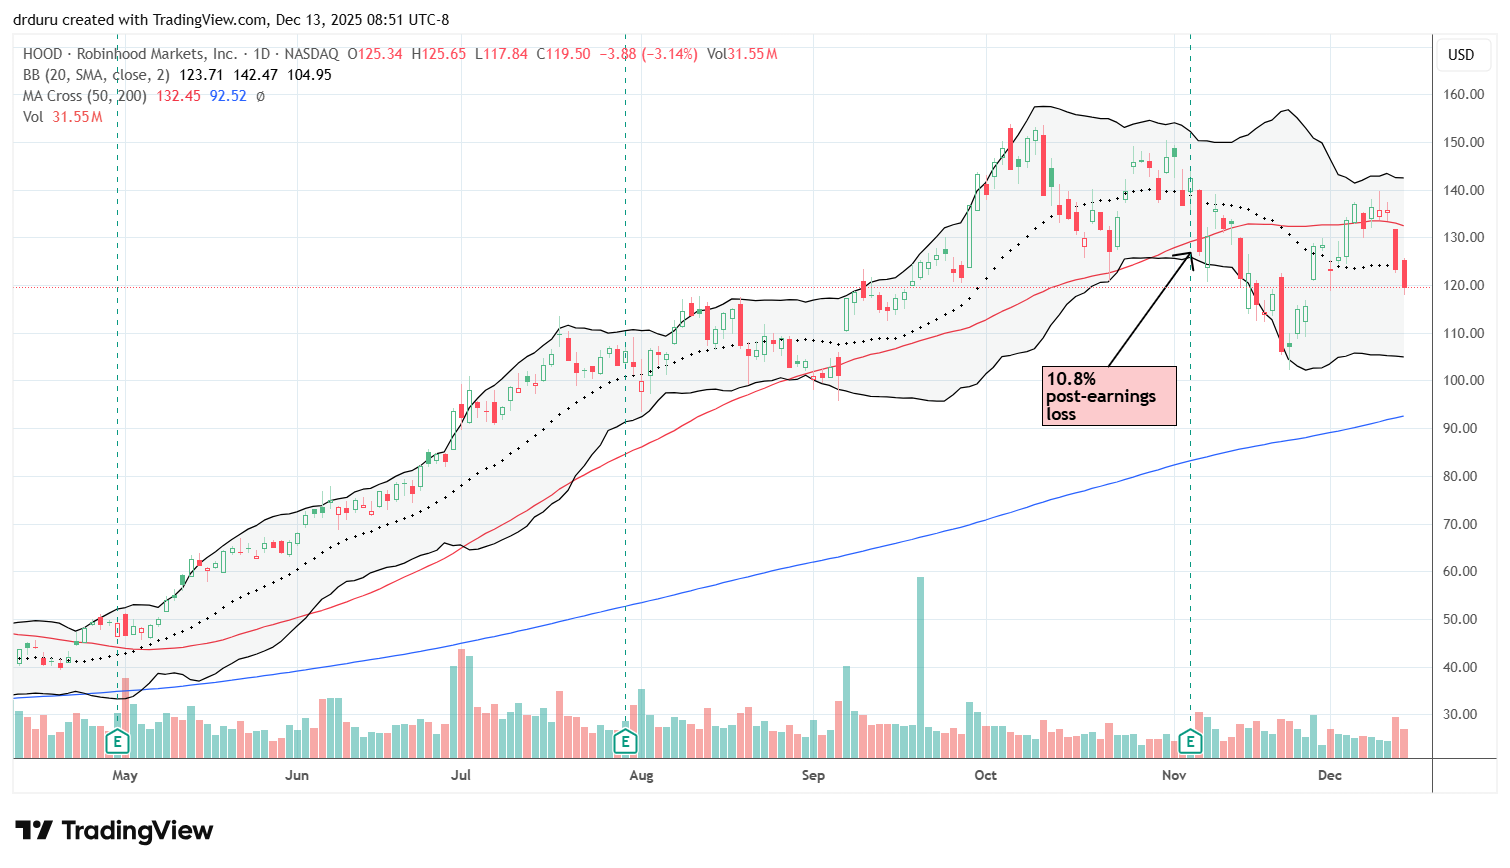
Robinhood Markets, Inc. (HOOD)
Description: Robinhood Markets, Inc. operates an online trading platform offering commission-free investing services.
Technical status: Robinhood Markets, Inc. (HOOD) showed signs of a topping pattern after a failed breakout above its 50DMA.
Trade commentary: HOOD looks like it has topped out after a fake 50DMA breakout. Still, as long as HOOD holds its 200DMA support, the stock will remain overall bullish. I am waiting out for such a test as a buying opportunity. HOOD last traded below this support when the stock was in the single digits in 2022. The stock has survived multiple tests of this support line.
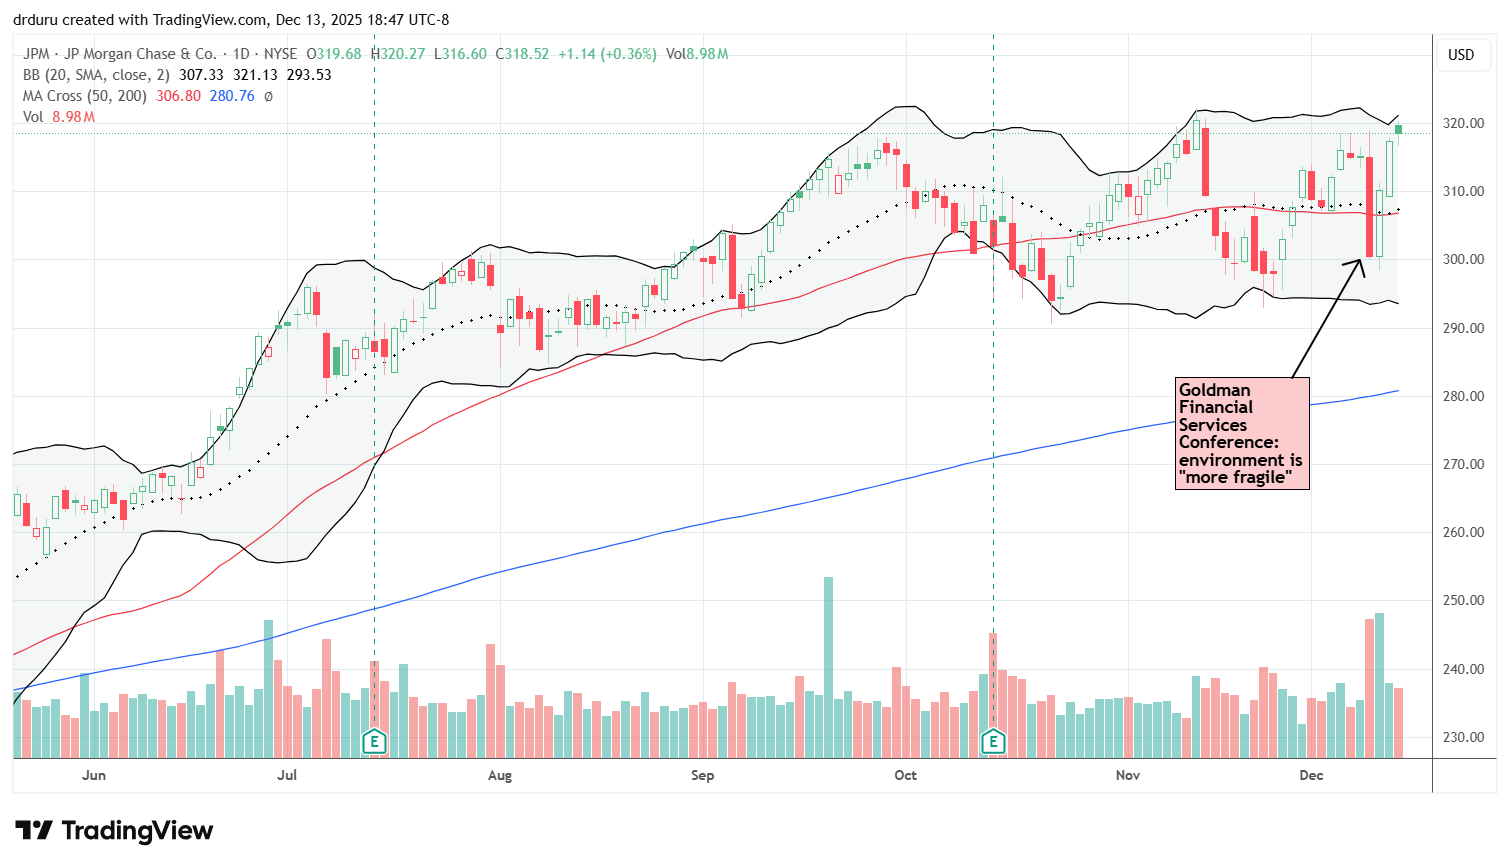
JPMorgan Chase & Co. (JPM)
Description: JPMorgan Chase & Co. provides global financial services including banking, investment, and asset management.
Technical status: JPMorgan Chase & Co. (JPM) rebounded quickly from a sharp selloff and returned near all-time highs.
Trade commentary: JPM dropped 4.7% on negative economic commentary but buyers stepped in aggressively after the Fed announcement. The quick recovery back near all-time highs is bullish and keeps me hopeful for a year-end rally even with a tired AI trade.
")
")
Be careful out there!
Footnotes
Subscribe for free to get email notifications of future posts!
“Above the 50” (AT50) uses the percentage of stocks trading above their respective 50-day moving averages (DMAs) to measure breadth in the stock market. Breadth defines the distribution of participation in a rally or sell-off. As a result, AT50 identifies extremes in market sentiment that are likely to reverse. Above the 50 is my alternative name for “MMFI” which is a symbol TradingView.com and other chart vendors use for this breadth indicator. Learn more about AT50 on my Market Breadth Resource Page. AT200, or MMTH, measures the percentage of stocks trading above their respective 200DMAs.
Active AT50 (MMFI) periods: Day #126 over 20%, Day #15 over 30%, Day #13 over 40%, Day #8 over 50% (overperiod), Day #1 under 60% (underperiod), Day #99 under 70%
Source for charts unless otherwise noted: TradingView.com
Full disclosure: long IWM shares and calendar call spread, long QQQ call and call spread, long SPY put spreads, long ORCL call, long ANF, long SHOP call spread, long ITB call and shares, long UBER, long LYFT calls, long ORLY
FOLLOW Dr. Duru’s commentary on financial markets via StockTwits, BlueSky, and even Instagram!
*Charting notes: Stock prices are not adjusted for dividends. Candlestick charts use hollow bodies: open candles indicate a close higher than the open, filled candles indicate an open higher than the close.
* Blog notes: this blog was written based on the heavily edited transcript of the following video that includes a live review of the stock charts featured in this post. I used ChatGPT to process the transcript.