

Stock Market Commentary
The tariff rumors proved true after all. The green shoots of Monday that grew alongside the rumor of a pause presaged Wednesday’s massive relief from a real blink on tariffs. Those historic gains were large enough to generate a strong week broadly across the stock market. Still, as more blinking and backing down on tariffs and excitement and disappointment over negotiations all unfold, the market will likely prove to remain volatile. The all-clear is not here yet, and the stock market remains deeply oversold. Moreover, a rare technical indicator that I wrote about on Seeking Alpha suggests THE final bottom still awaits the market. (At some point soon I will reprise these findings).
As I absorbed the week’s lessons on Friday night, I read an ominous article from Fierce Electronics on the devastating impact tariffs will have throughout the industry (see “Tariff shock to clobber computer prices, freeze hiring and more“). Mentally, I went through the exercise of how I would need to brace for imminent selling like lose the floor on my short Best Buy (BBY) put option. The very next day, I read a breaking news report on Yahoo Finance that the electronics industry received a major reprieve with exemptions from reciprocal tariffs for smartphones, computers, laptop computers, hard drives, computer processors, memory chips, and flat-screen displays. This news could explain the interesting out-performance of Apple (AAPL) on Friday.
We may never know whether word of the exemptions leaked on Friday, but this episode reinforced the potential of technicals in the middle of news-driven chaos. Technicals can whisper secrets. That is, suspiciously strong or weak price action has more meaning than usual because of the high stakes in the news flow. I was actually trying to buy an AAPL calendar call spread on the day, but the premiums were so high and my lower bid never attracted a seller. With hindsight, those high premiums alone communicated a significant buy signal. Now, let’s see whether the good news holds long enough for a strong open on Monday for AAPL, BBY, and so many other beneficiaries of this exemption. This tariff chaos is amazingly capricious and even arbitrary.
The tariffed economic policy is supposed to make America rich. These kinds of exemptions undermine this greatness through tariffs narrative. Thus, I cannot be truly sure these exemptions will hold. The tensions are now high between blinking and backing down from economic and market realities and stubbornly sticking to the ideological narratives. According to Bloomberg, “Since a wave of tariffs were announced on April 2, lobbyists from Apple and other technology companies have been pushing the White House for exemptions.” Brace yourselves…
The Stock Market Indices
S&P 500 (SPY)
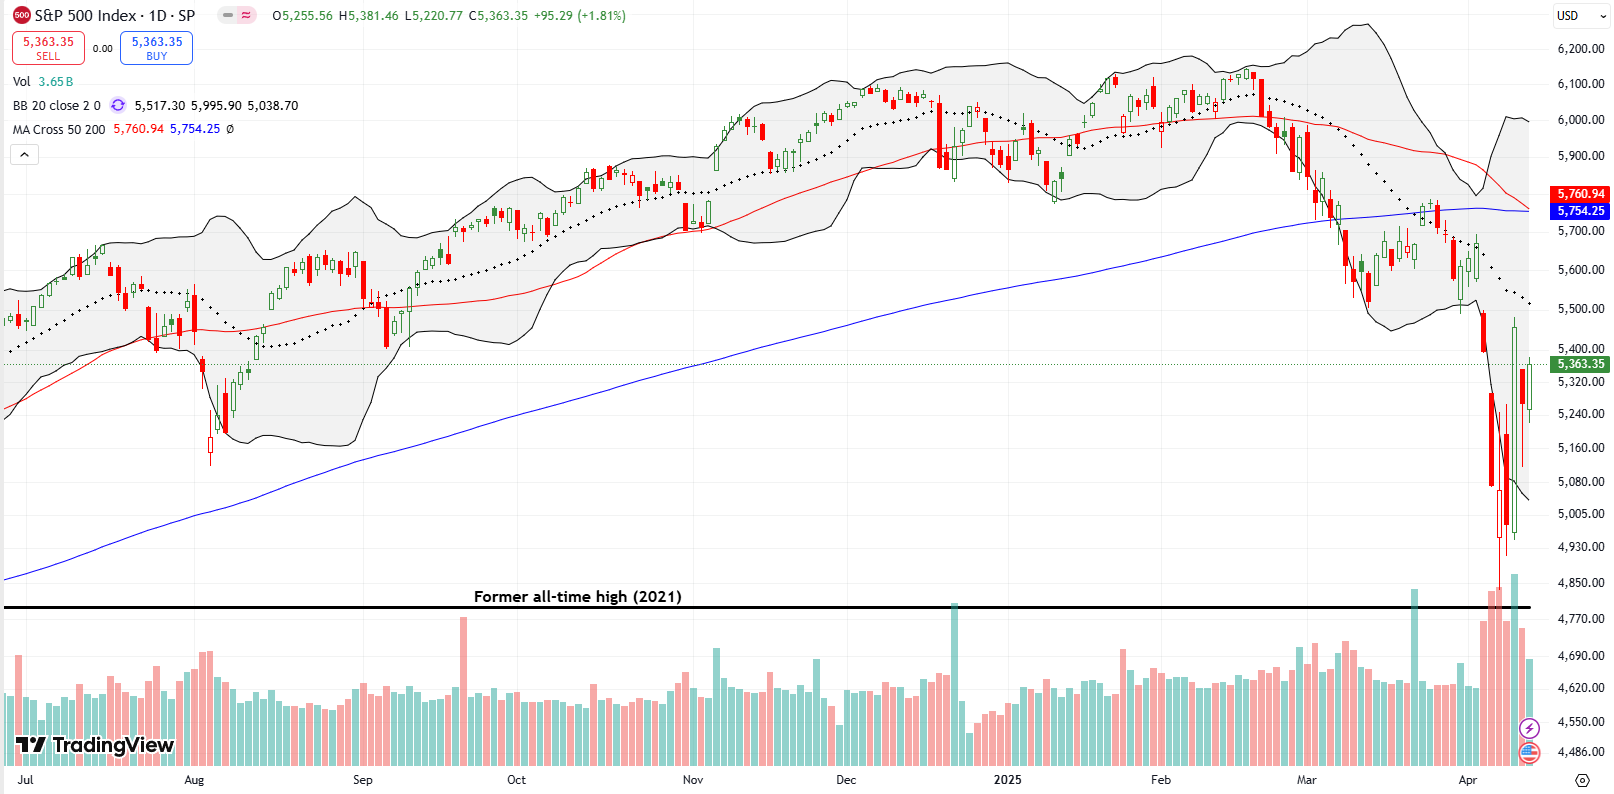
The trading action for the week was so violent and volatile that I will describe the price changes in three ways: year-to-date, for the week, and on Friday. The S&P 500 (SPY) is down 8.8% year-to-date, up 5.7% for the week, and up 1.8% on Friday. The index remains far short of its downtrending 20-day moving average (DMA) (the dotted line), and barely pulled off a daring escape from a test of the former all-time high from 2021. The S&P 500 also avoided a conventional bear market as it closed 17.6% off its all-time high on Monday.
NASDAQ (COMPQ)
The NASDAQ continues to trade with worse relative technicals than the S&P 500. The NASDAQ not only plunged into a conventional bear market for a brief moment, but also the tech laden index sliced right through its former all-time high from November, 2021. In fact, at one point, the NASDAQ had erased all its 2024 gains! The NASDAQ is down 13.4% year-to-date, up 7.3% for the week, and up 2.1% on Friday.
The index closed the week far short of its declining 20DMA.
")
The iShares Russell 2000 ETF (IWM)
IWM looks like it is settling into a trading range between its conventional bear market line and its pre-pandemic high. THe ETF of small caps is down 16.6% for the year, up “just” 1.8% for the week, and up 1.5% on Friday. Thus, unlike the other two indices, IWM’s Friday gains created the bulk of the week’s sustained gains.
")
The Short-Term Trading Call With A Strong Week
- AT50 (MMFI) = 14.1% of stocks are trading above their respective 50-day moving averages (oversold day #7)
- AT200 (MMTH) = 22.1% of stocks are trading above their respective 200-day moving averages
- Short-term Trading Call: bullish
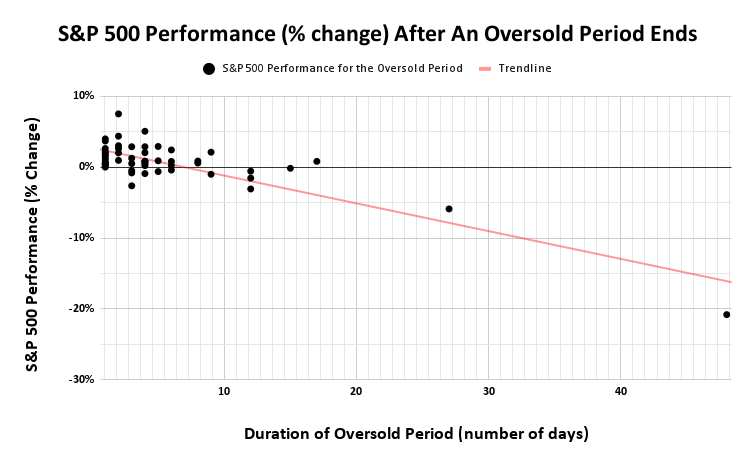
AT50 (MMFI), the percentage of stocks trading above their 50DMAs, closed the week at 14.1%. My favorite technical indicator is still deeply oversold but at least it is no longer single digits. AT50 also pulled off its second highest close of the oversold period. Now on its 7th day, this oversold period has become historic. Per the chart below, there are only 11 other periods with longer oversold periods. If this oversold period lasts 3 more days, then it will be time to brace for an extremely long, extended bear market kind of oversold trading.
The volatility index (VIX) was able to avoid closing at its low for the week. Thus, the VIX did not support the case for a sustainable low despite the confirming 35.7% plunge on Wednesday. Now that fear is finally showing exhaustion, I want consistent follow through to gain confidence in the sustainable low from the oversold period. Otherwise, AT50 is heading to a 10th day and beyond…and all the gut-wrenching selling that will come from such a disappointment.
iShares 20+ Year Treasury Bond ETF (TLT)
Trump mentioned the weakening bond market as one of his reasons for blinking and granting a 90-day pause on reciprocal tariffs. The bond market seems not yet satisfied. The sell-off in bonds resumed on Thursday with TLT losing 2.8%. TLT gapped down again on Friday despite good news on inflation before rallying to a 0.5% gain. Clearly, the bond market wants to keep forcing the issue on America’s tariff policies. This pressure is very real given the need for the U.S. to finance its massive debt, and U.S. Treasury Secretary Scott Bessent’s attempts to reassure Americans that long-term rates, thus loans and mortgages, are going much lower.
")
U.S. Dollar Index (DXY)
In parallel, the U.S. dollar plunged last week as another sign of waning confidence in America’s economy. The U.S. dollar index (DXY) dropped below 100 for the first time since July, 2023 and looks ready to crack the bottom of a trading range in place since early 2022. DXY sold off sharply for 4 straight days.
The Equities: The Strong Week
Walmart Inc (WMT)
WMT was a clear winner for the week. Unlike a lot of stocks, WMT held its gains from Wednesday’s rejoicing over a tariff pause. WMT rallied right into 50DMA (the red line) resistance, and looks ready for a breakout. WMT is UP 2.7% for the year, up 11.6% for the week, and 2.4% on Friday. The discount retailer is a rare bright spot for the stock market as it seems investors are ready to pay a valuation premium for Walmart’s ability to negotiate its suppliers into tariff-related concessions.
")
CME Group Inc (CME)
I last discussed CME exactly two years ago. I bought the stock as a bet on lasting volatility in the market and the resultant increase in trading volumes on options. This assumption worked out fantastically during this year’s rolling tariff crash. However, after Friday’s 5.2% pullback it seemed even CME had succumbed to profit-taking. Fortunately, CME regained its bearings and avoided a 50DMA breakdown. The stock ended the week with two up days in a row. CME is up 12.6% for the year, up 2.8% for the week, and up 1.2% on Friday. This stock is one of the rare ones in the market still above its 50DMA and 200DMA.
")
SPDR Gold Trust (GLD)
GLD is suddenly working again. Earlier this month, I explained why I finally sold my long-term, core position in GLD: I did not like the way it gapped down with the market’s tariff crash when GLD is supposed to be a safe haven. Well it seems the on-going scare in the U.S. bond market reignited interested in gold. The accelerated weakness in the U.S. dollar is likely also providing a tailwind for gold. Fortunately, I am still holding my short-term call spread. I was hoping to start rebuilding a position in gold on a pullback to or toward the 200DMA (blue line). Instead, it seems I will be doing serial call spreads until the momentum truly ends for GLD.
GLD is up 23.1% for the year, 6.5% for the week, and up 1.9% on Friday.
")
CarMax Inc (KMX)
CarMax collapsed 17.0% post-earnings on a day the market gave back gains from Wednesday’s rejoicing. The used car company apparently disappointed on results that of course pre-dated tariffs. Here is what the company had to say about the impact of tariffs on the price of used cars, from the Seeking Alpha transcript:
“Now I think over time, what could happen is that the used car prices will also go up. Now the question is how much will they go up over what period of time. I think the other thing to think about on the tariffs that impacts our business, as well as anybody that sells used cars, it’s just a parts piece. When it comes to reconditioning, the parts will be going up. And it just makes our work that much more important on the efficiencies that we’re going after on cost of goods sold to offset those increases.”
KMX is down 16.4% for the year, down 9.7% for the week, but up 2.9% on Friday. KMX trades around a 52-week low.
")
Meta Platforms, Inc (META)
META flipped from an out-performer to an under-performer for the week. On Wednesday, the market rejoicing punched META above its 200DMA and 20DMA. However, on Friday, META failed to regain buying interest after Thursday’s failure at 200DMA resistance and a 6.7% loss. This kind of weakness catches my attention; I am on alert for META to join a small group of stocks that have already reversed Wednesday’s gains. If META shows weakness early Monday, I will likely chase it downward with a put spread (I am currently long META shares). META is down 7.2% for the year, up 7.7% for the week, and down 0.5% on Friday.
")
SPDR Select Sector Fund – Consumer Staples (XLP)
Consumer staples are often a “safe haven” investment during recessions. Staples are items that consumers will or even must buy no matter what economic conditions exist. Accordingly, XLP has outperformed the general market. While XLP is off its all-time highs, it is still up 2.2% for the year, up 2.4% for the week, and up 1.3% on Friday. I am looking more and more at ETFs to trade on oversold conditions given they significantly reduce company-specific risk, important with earnings season underway.
")
SPDR Select Sector Fund – Consumer Discretionary (XLY)
Consumer discretionary is like the other side of the coin from consumer staples. These goods are “optional” for consumers. Consumers can either delay purchases or forgo them altogether. Thus, XLY has weakened in parallel with the general stock market. XLY is down 15.4% for the year, up 3.8% for the week, and up 1.0% on Friday. Note well that XLY is heavily skewed by Tesla (TSLA) and Amazon.com (AMZN) which make up 14% and 22% of the ETF respectively.
")
SPDR Select Sector Fund – Industrial (XLI)
Industrials are supposed to benefit from tariffs as more manufacturing is forced to America. Unfortunately, many industrial companies also rely on exporting. XLI is full of America’s greatest international producers of goods and services. Like the NASDAQ, at one point last week, XLI had reversed all its gains from 2024. XLI is now down 4.6% for the year, up 6.6% for the week, and gained 1.8% on Friday.
")
")
")
Be careful out there!
Footnotes
Subscribe for free to get email notifications of future posts!
“Above the 50” (AT50) uses the percentage of stocks trading above their respective 50-day moving averages (DMAs) to measure breadth in the stock market. Breadth defines the distribution of participation in a rally or sell-off. As a result, AT50 identifies extremes in market sentiment that are likely to reverse. Above the 50 is my alternative name for “MMFI” which is a symbol TradingView.com and other chart vendors use for this breadth indicator. Learn more about AT50 on my Market Breadth Resource Page. AT200, or MMTH, measures the percentage of stocks trading above their respective 200DMAs.
Active AT50 (MMFI) periods: Day #7 under 20% (oversold), Day #13 under 30%, Day #32 under 40%, Day #44 under 50%, Day #69 under 60%, Day #170 under 70%
Source for charts unless otherwise noted: TradingView.com
Full disclosure: long SPY shares, long SPY put spread, long GLD call spread, long META, long CME, long AMZN, long IWM
FOLLOW Dr. Duru’s commentary on financial markets via StockTwits, BlueSky, and even Instagram!
*Charting notes: Stock prices are not adjusted for dividends. Candlestick charts use hollow bodies: open candles indicate a close higher than the open, filled candles indicate an open higher than the close.