Stock Market Commentary
Another week, another tease for bears. A fade from resistance joined market breadth in flagging bearish signals for the stock market. Yet, bears are hard-pressed to find a good risk/reward entry, especially considering the on-going uptrends for 2024. The latest confounder for bears has been the market’s general ability to ignore rising long-term interest rates. Ever since the Federal Reserve cut interest rates last month, long-term rates have steadily, and sometimes swiftly, increased. Yet, the Japanese yen has also steadily weakened. Perhaps some residual carry trade activity is helping to counteract the otherwise negative impact of rising U.S. bond yields. Moreover, the on-going strength in economic data has taken the sting out of recession fears that kept bearish sentiment in the game in recent months.
The Stock Market Indices
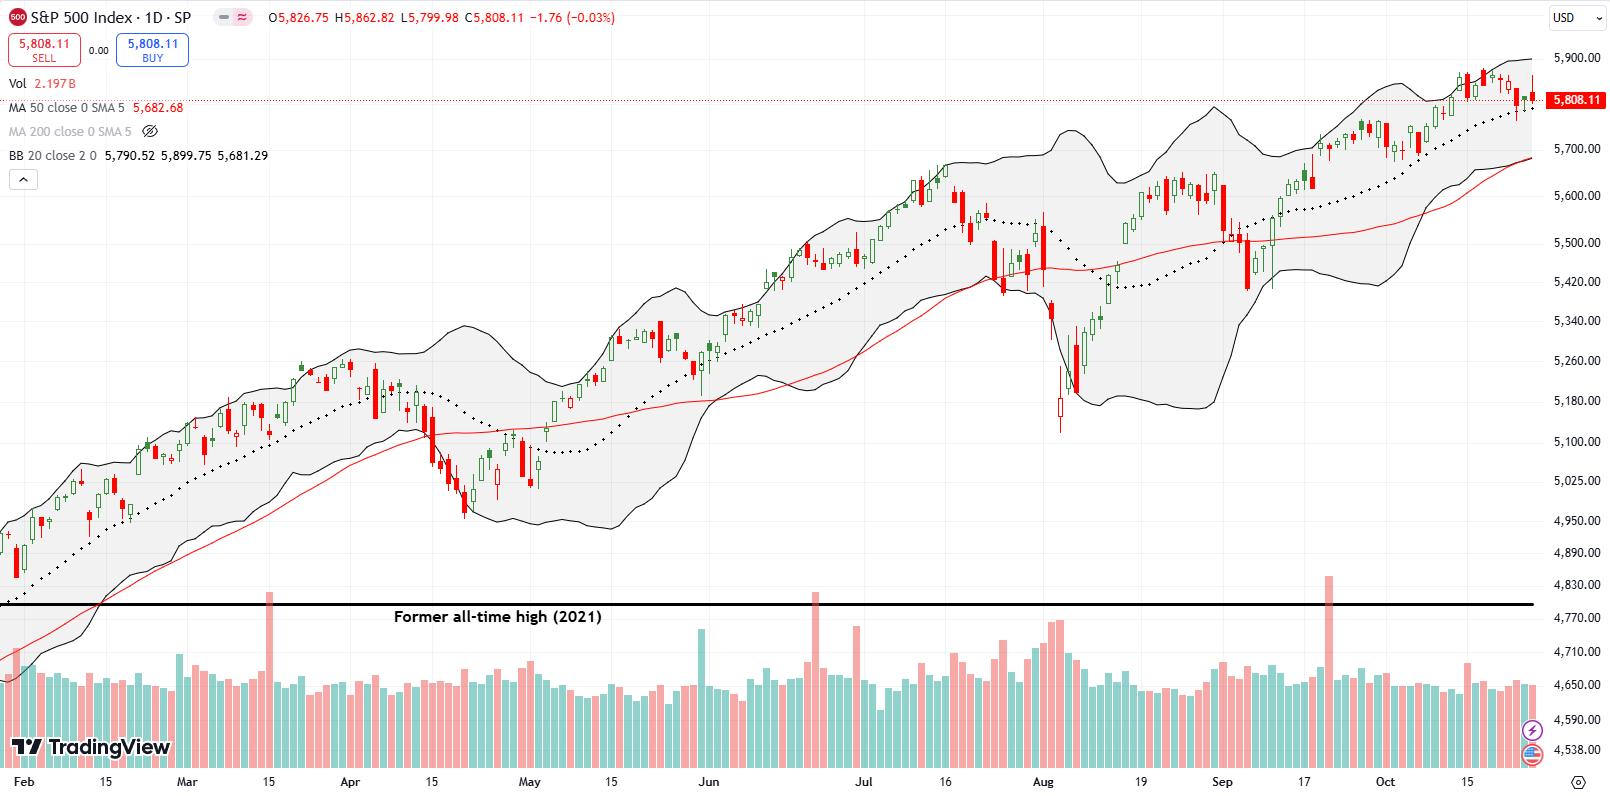
The S&P 500 (SPY) held onto support at its 20-day moving average (DMA) (the dotted line) despite an ominous fade from all-time highs. Thus, while I want to get aggressively bearish on the index, I have to defer to support holding in the middle of a persistent uptrend. Add this fade from resistance as a fresh bear teaser.
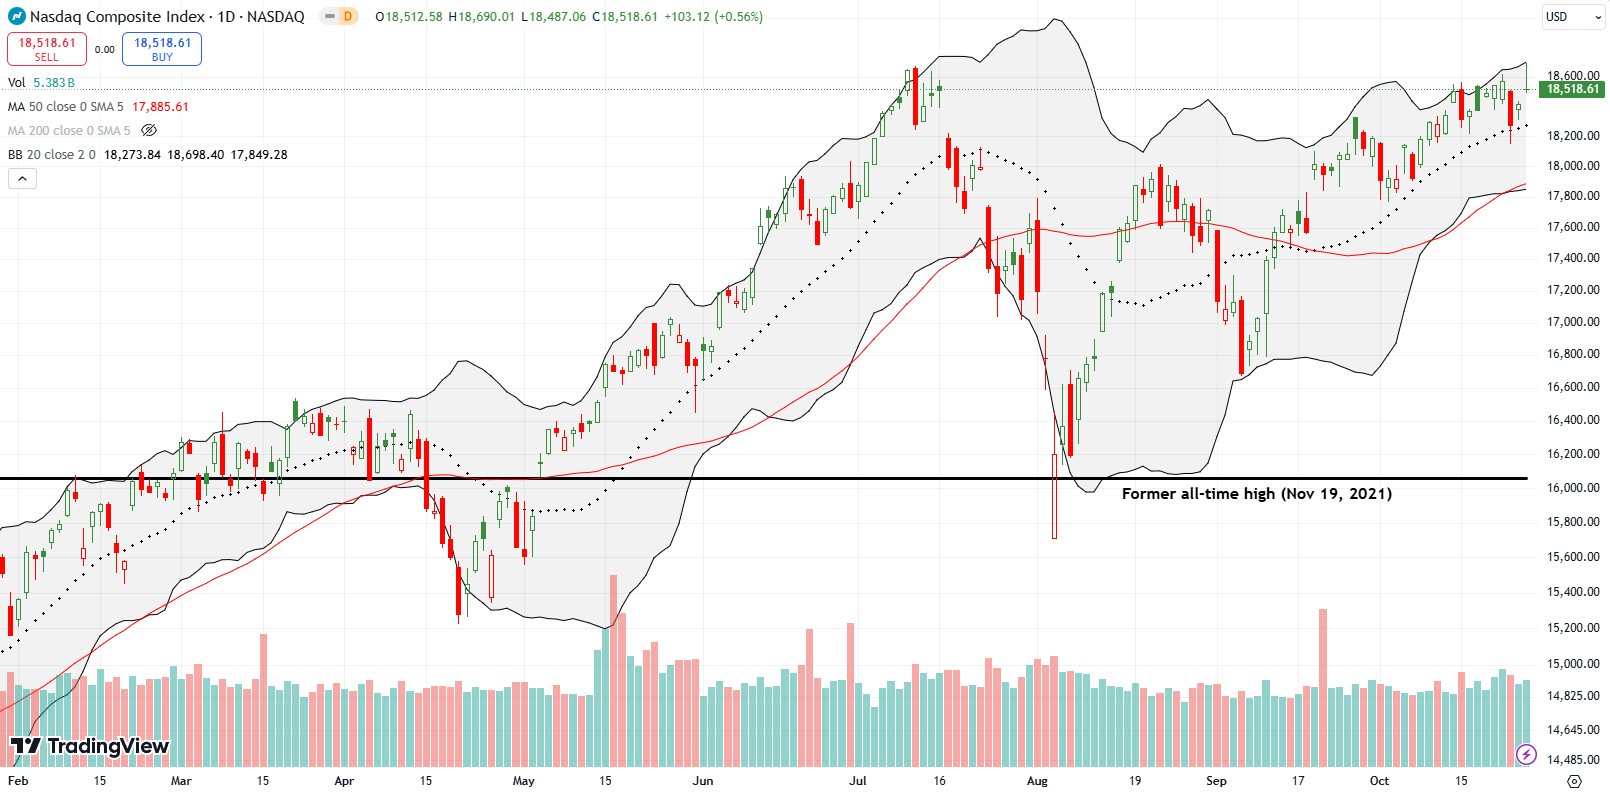
The NASDAQ also suffered a fade from all-time highs. This fade is doubly ominous because of the double-top that includes two bearish engulfing topping patterns. I want to get aggressively bearish on the tech laden index, but it is still floating above 20DMA support. Add this fade back to resistance as a fresh bear teaser.
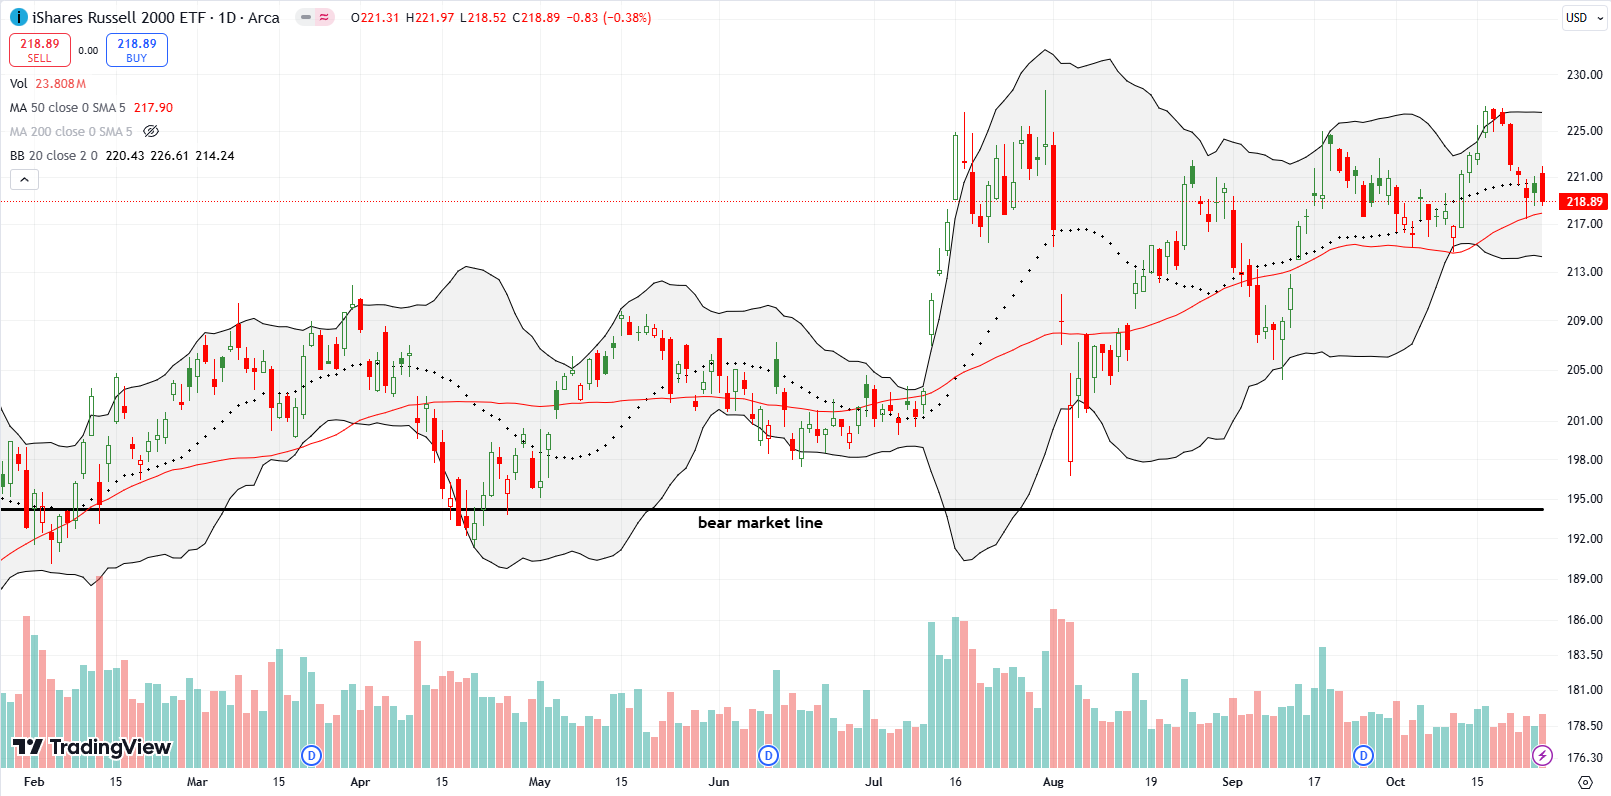
The iShares Russell 2000 ETF (IWM) disappointed with a sharp fade from the previous week’s breakout. The persistent selling took IWM right back to support at the 50DMA (the red line). Buyers held the line there. IWM has been the index most sensitive to the current resurgence in interest rates.
The Short-Term Trading Call With A Fade
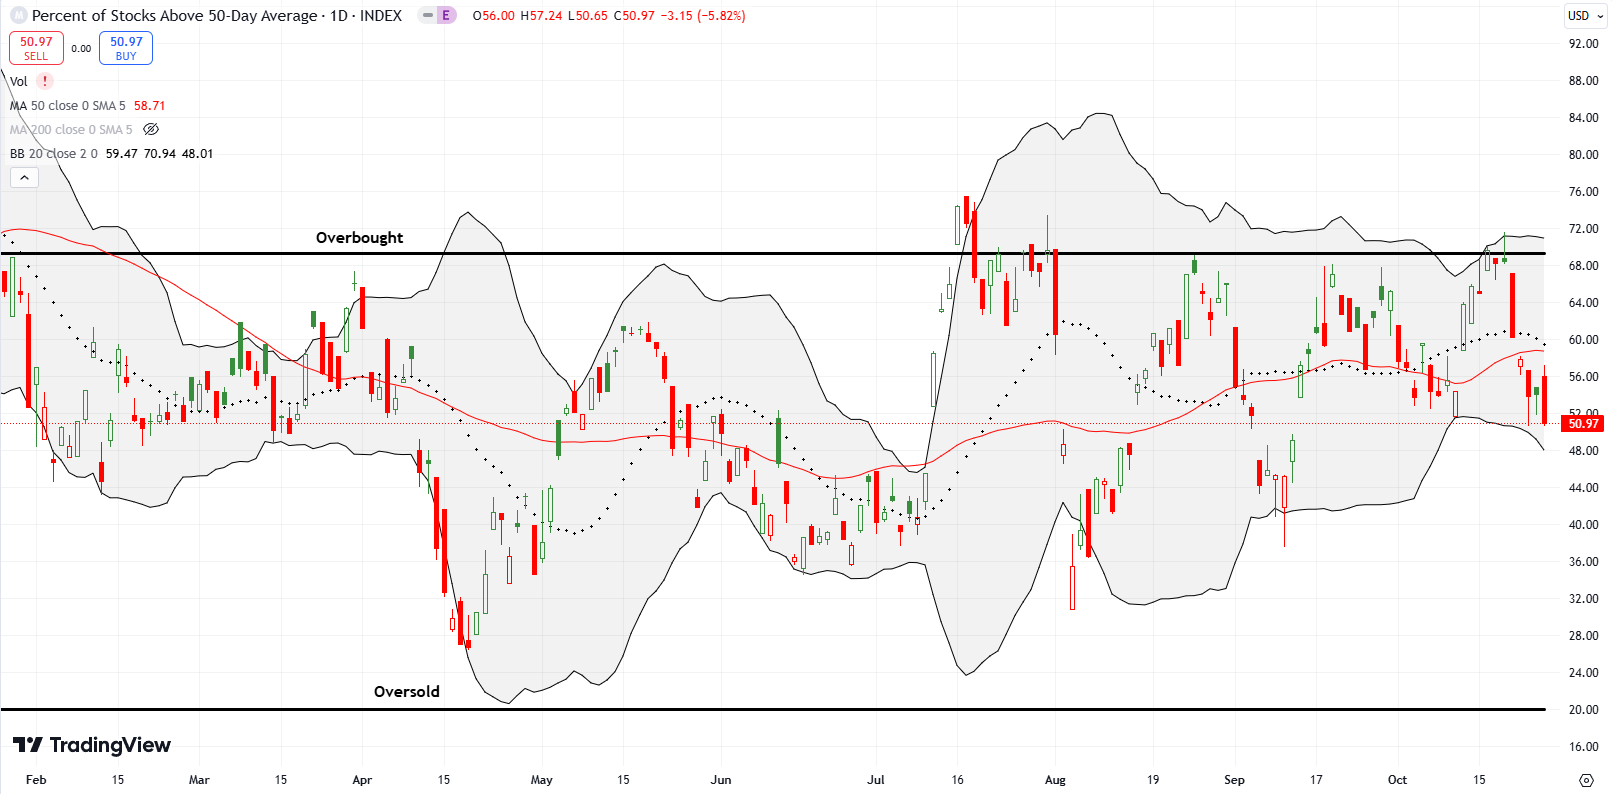
- AT50 (MMFI) = 51.0% of stocks are trading above their respective 50-day moving averages
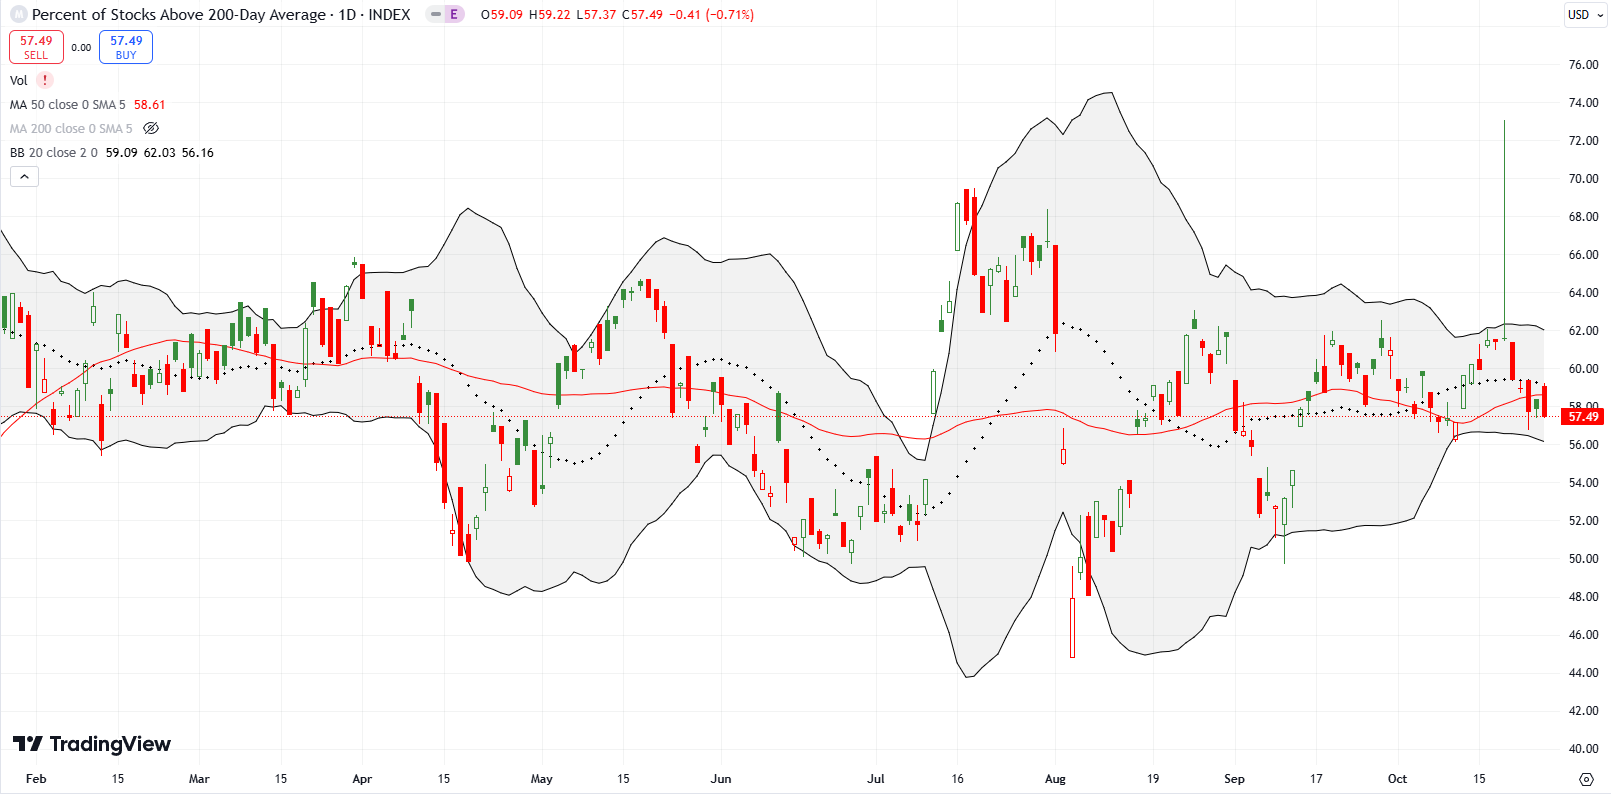
- AT200 (MMTH) = 57.5% of stocks are trading above their respective 200-day moving averages
- Short-term Trading Call: cautiously bearish
AT50 (MMFI), the percentage of stocks trading above their respective 50DMAs, closed the week at a 6-week low at 51.0%. This new low deepened the bearish positioning of my favorite technical indicator. Each fade from resistance confirms this bearish positioning per the AT50 trading rules. Yet, like so many times this year, the bearish signals are not allowing aggressively bearish positioning. The good risk/reward bearish opportunities have been far and few between while I still find better profit in the occasional bullish position. This reality all adds up to much lower trading activity.
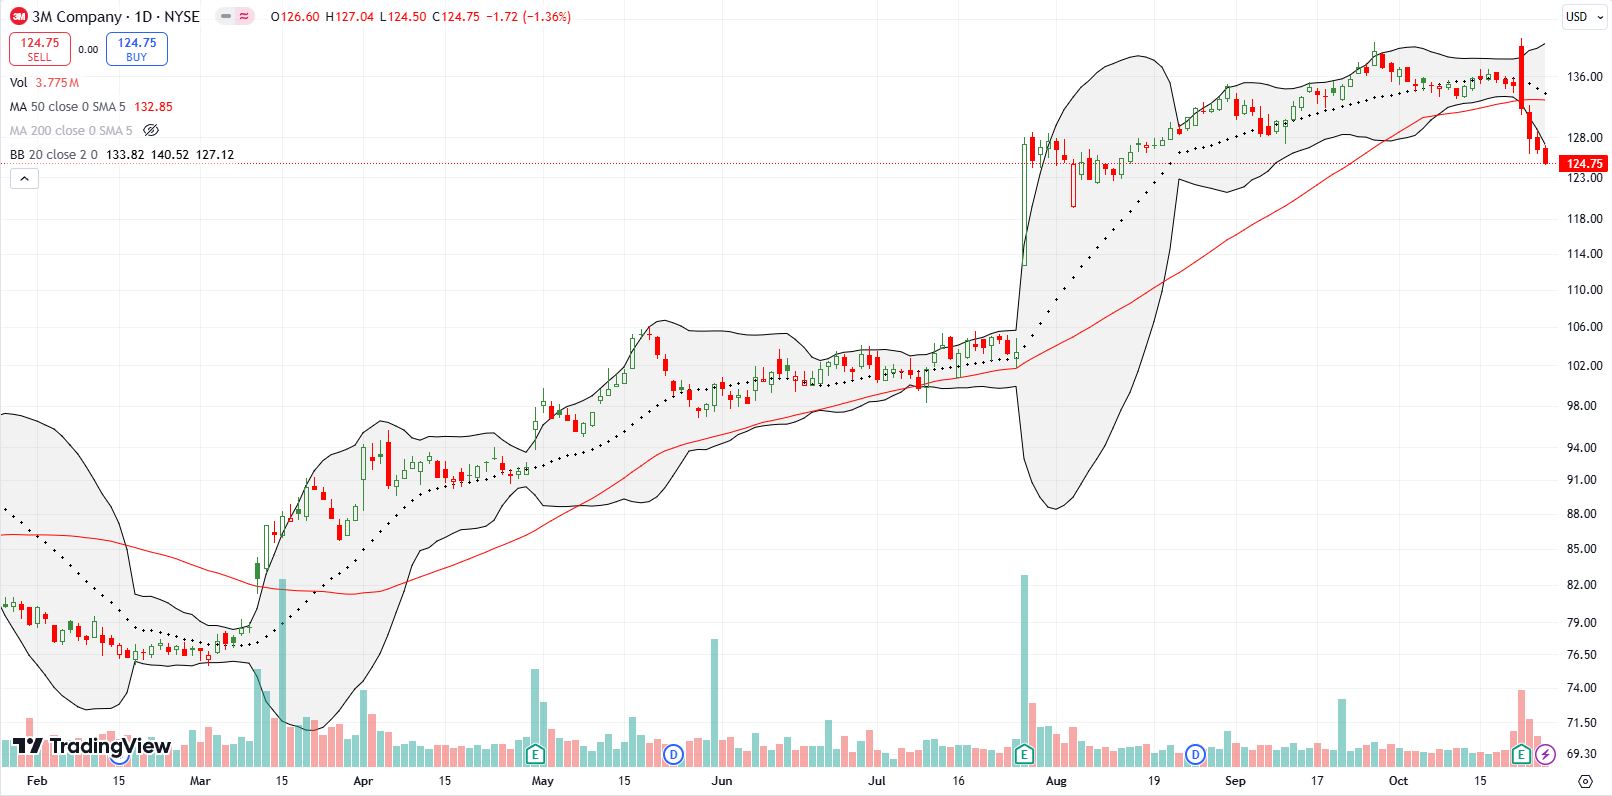
3M Company (MMM) has had a great comeback year. I enjoyed the pop from the July earnings report, but I decided to take profits as the stock churned. Last week, MMM suffered a nasty post-earnings fade that created a bearish engulfing topping pattern. Sellers kept up the pressure and confirmed the top with a confirmed 50DMA breakdown. I am not looking for a fresh entry point.
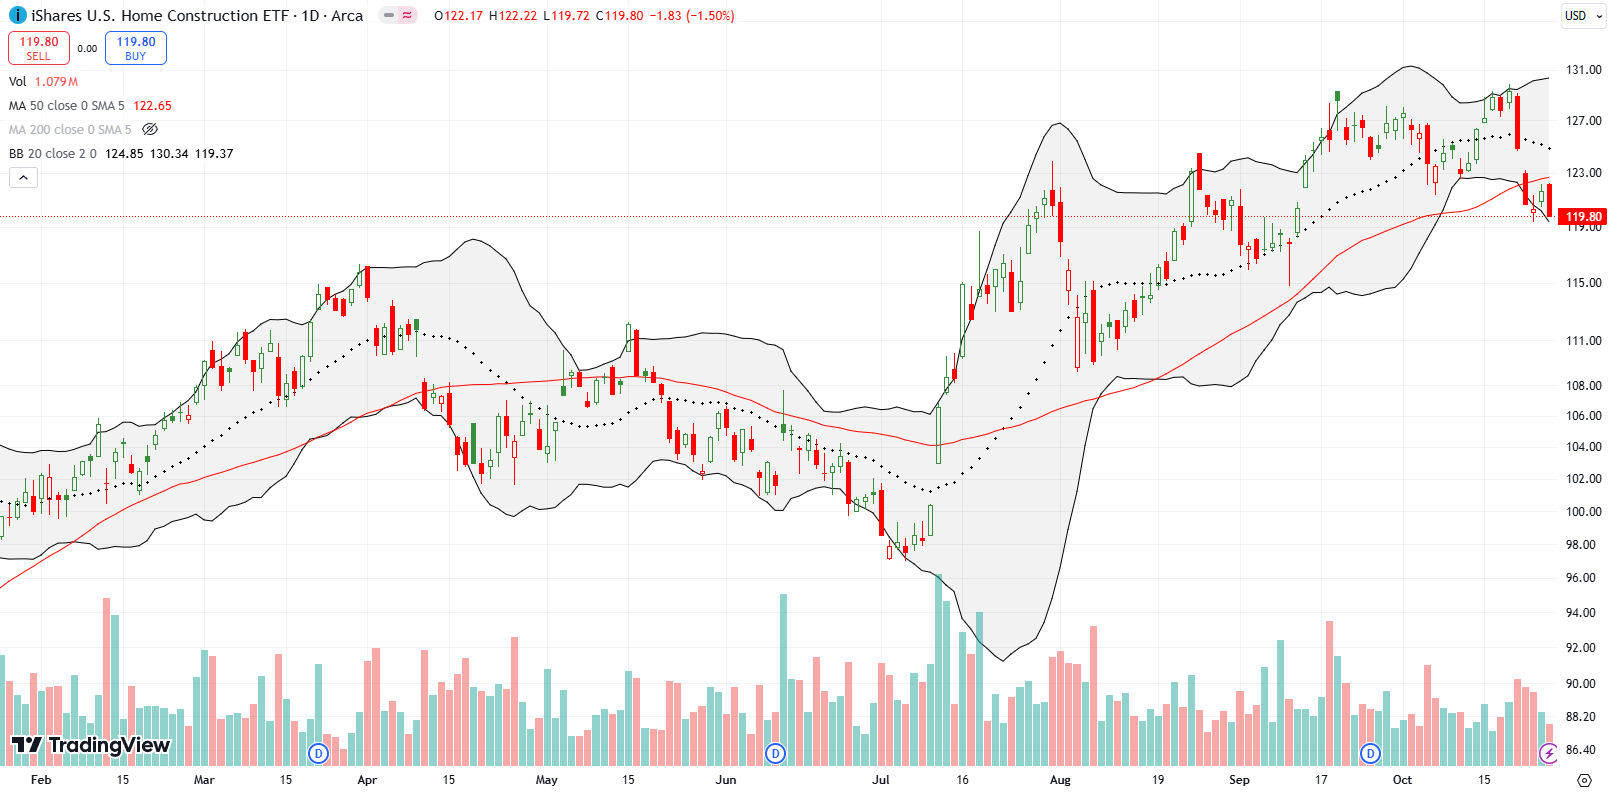
Slowly but surely home builders are wearing down. The iShares U.S. Home Construction ETF faded from 50DMA resistance and closed at a 5-week low. This breakdown is the most bearish setup for ITB since May’s 50DMA breakdown. I continue to be skeptical of the current lofty enthusiasm for builders.
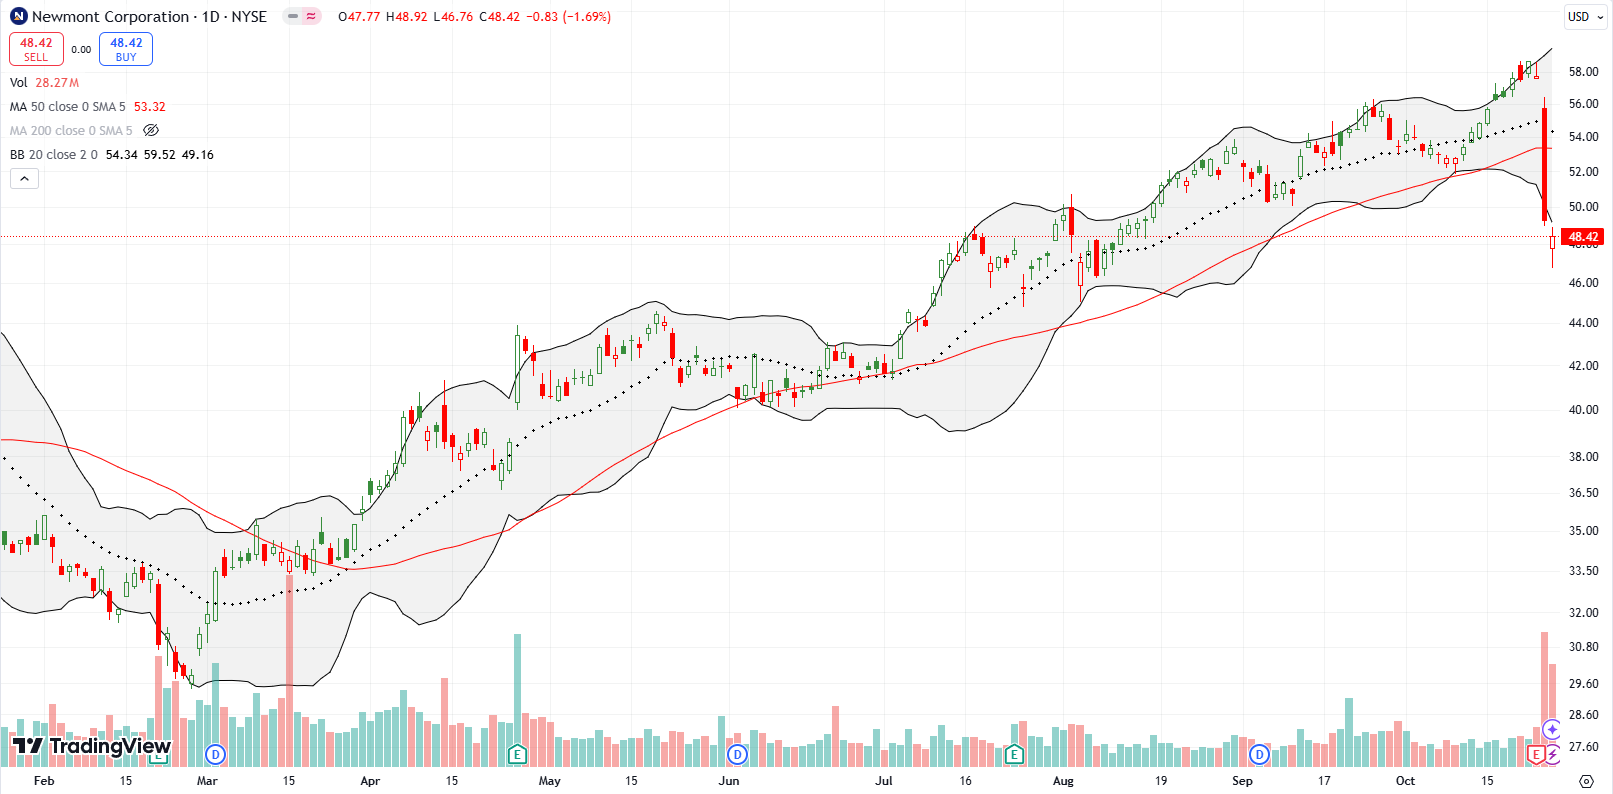
I remain an unabashed fan of gold. Last week’s post-earnings breakdown for Newmont Corporation (NEM) reminded me of the benefits of buying gold instead of the miners. Miners carry business risks even as they offer the potential for upside leverage. Newmont’s business risk came in the form of increased operating costs.
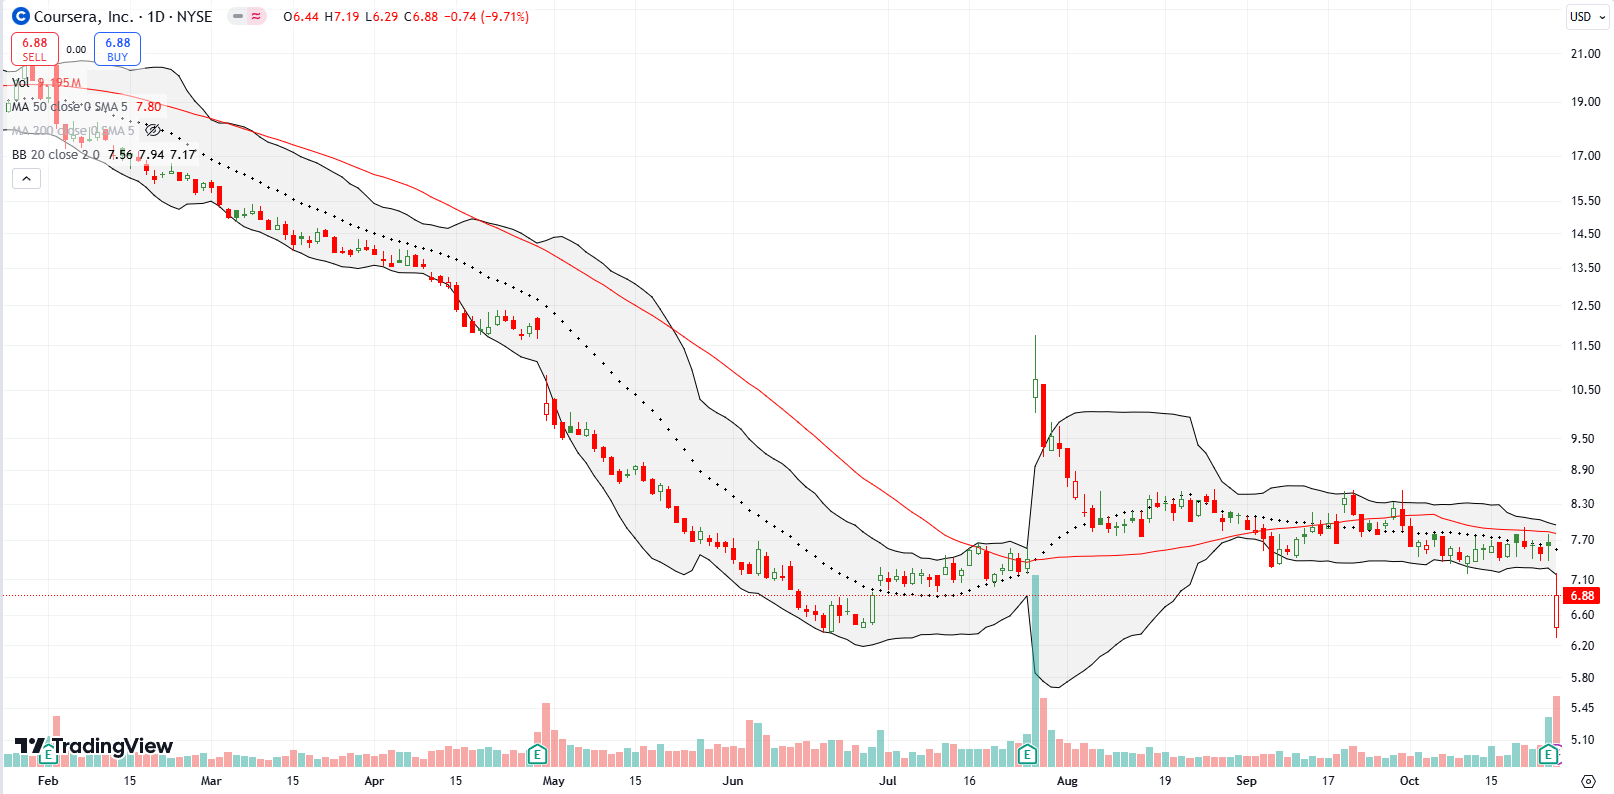
On-line education company Coursera, Inc (COUR) turned into one of those bizarre setups where investors and traders got overly excited about an earnings report. My trade in August failed, and I stopped out. Thank goodness because COUR returned to its losing ways with a post-earnings loss of 9.7% on Friday. Buyers stepped in at the lows so maybe the next trading experience will be the reverse of July’s. COUR is only a buy from here on a 50DMA breakout.
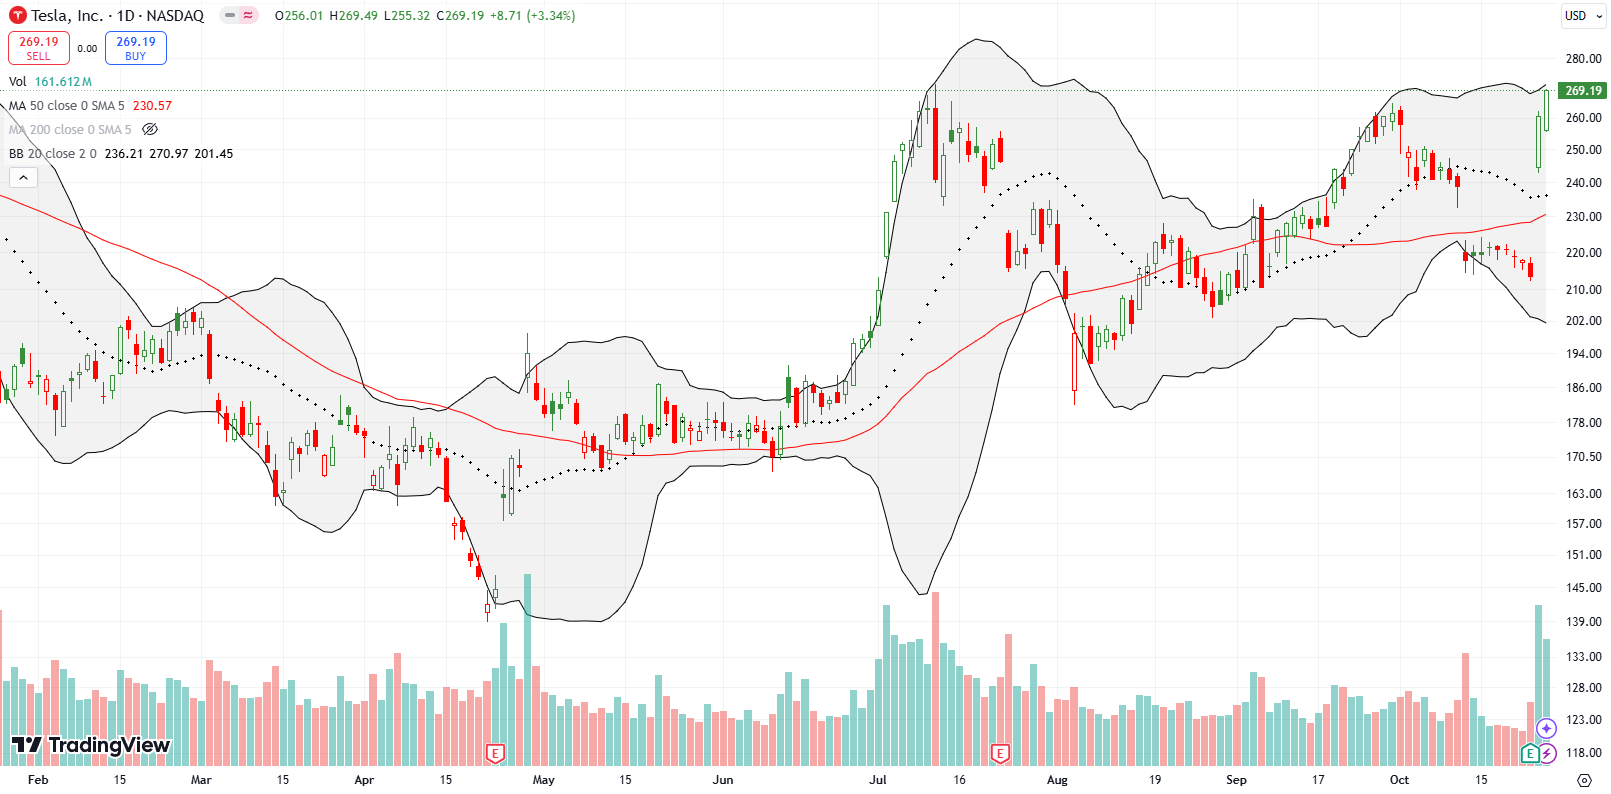
I redeemed my busted trade on Tesla, Inc (TSLA) and its robotaxi announcement. I executed on my pre-earnings trading plan, and TSLA delivered. In fact, TSLA over-delivered with a 21.9% post-earnings gain, the stock’s largest such gain in 11 years. I could not benefit from the outsized gains given I sold a call against shares. With Friday’s breakout, TSLA becomes a buy on the dip. This bullishness runs counter to the bearish fades on the major indices where TSLA participates.
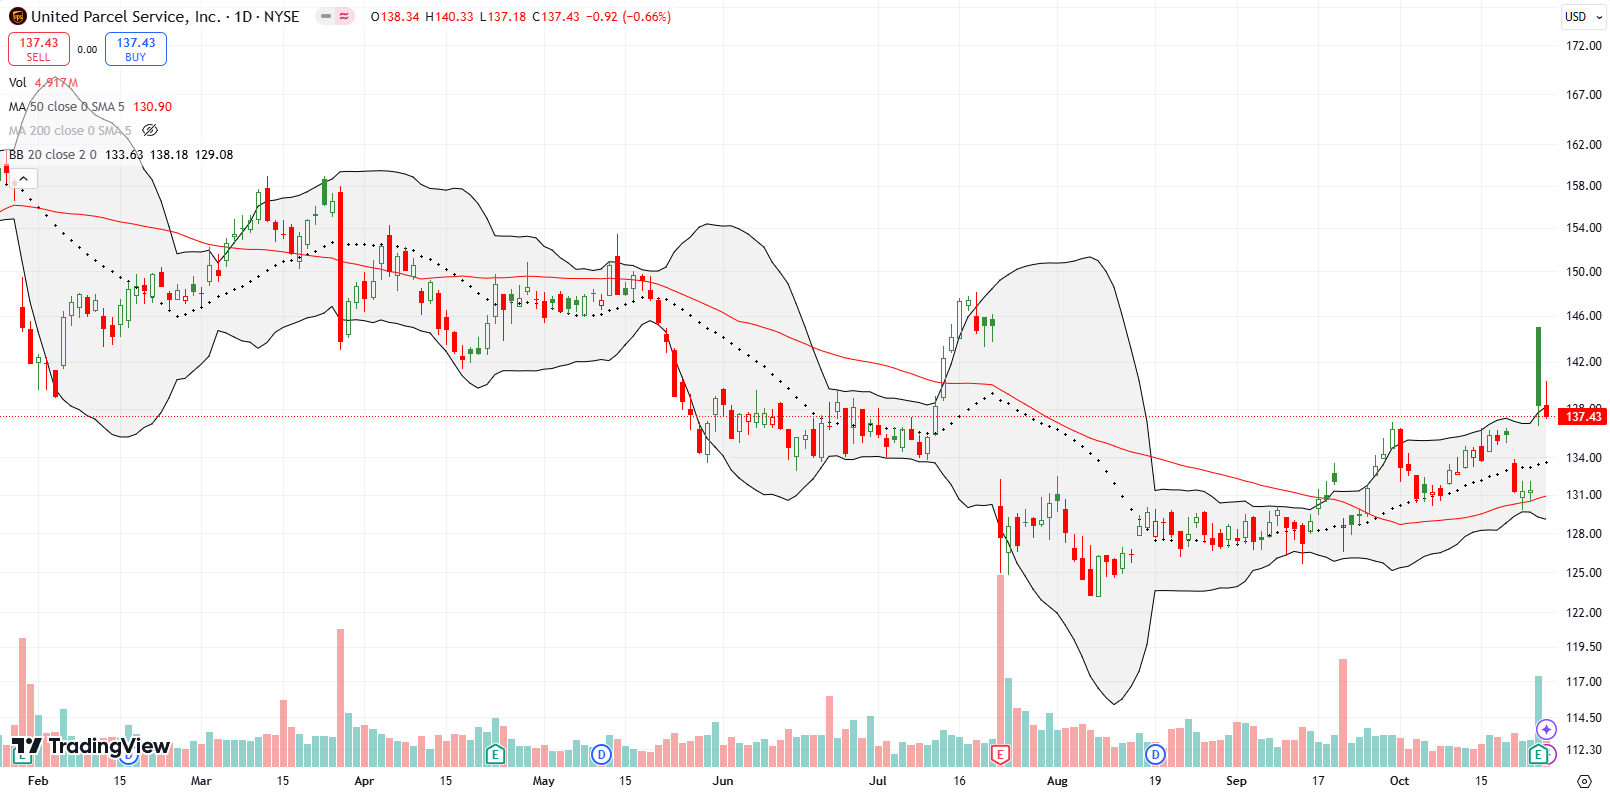
The United Parcel Service, Inc (UPS) suffered a post-earnings fade but managed to preserve a a 5.3% gain. Still, sellers took the stock down another notch on Friday. I am looking to see whether UPS can stabilize above its uptrending 20DMA.
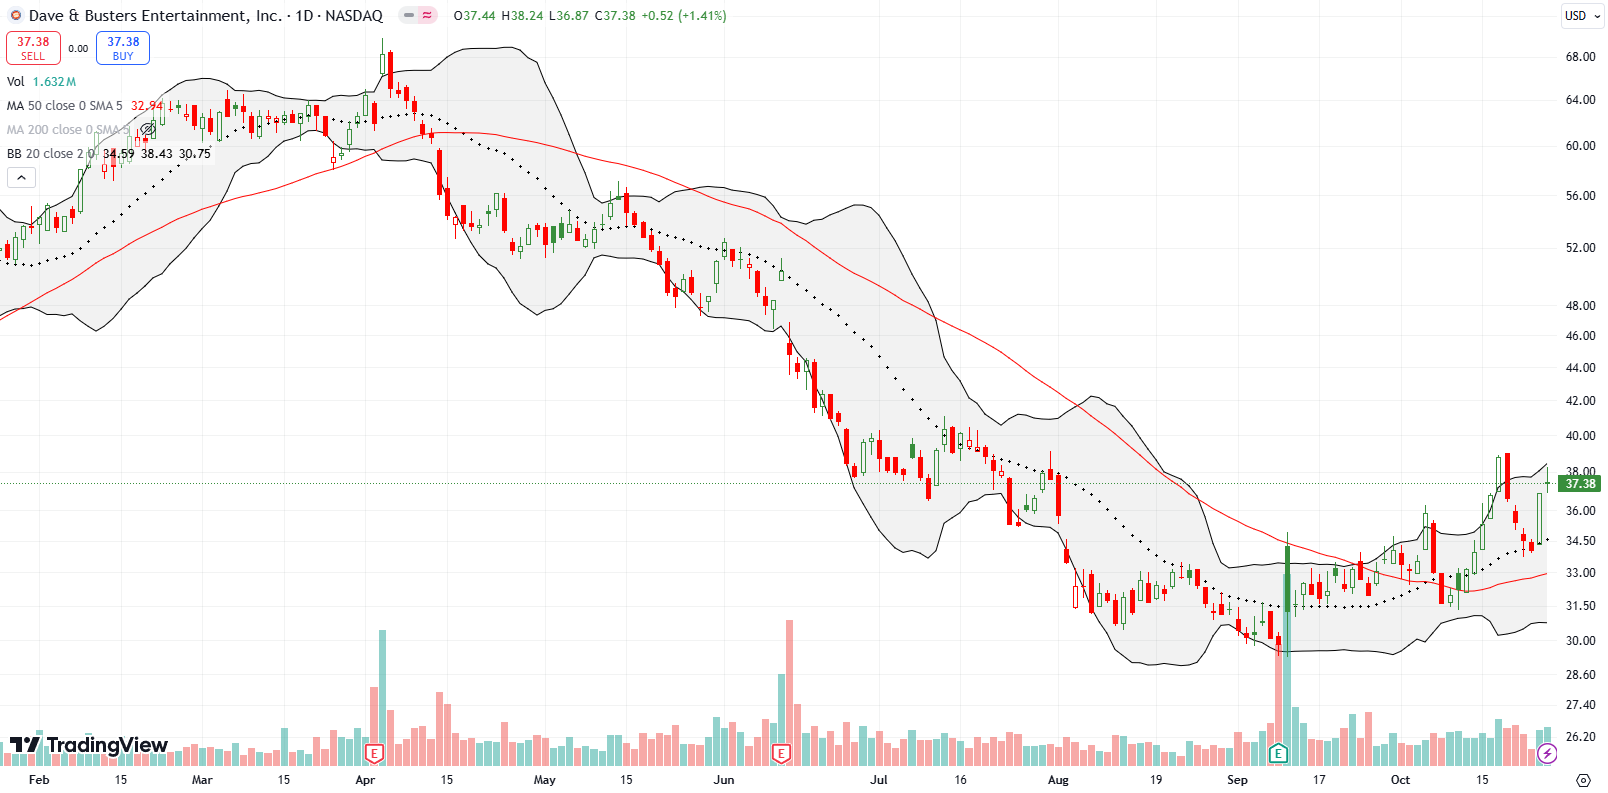
My last trade on Dave & Busters Entertainment, Inc (PLAY) worked out with momentum slowly building from September’s earnings report. I took profits as soon as PLAY weakened from its last parabolic move given the fragility of such run-ups. Last week, I bought right back into PLAY on its test of 20DMA support. I was prepared to add at 50DMA support, but I am pleased to see such a quick and strong turn-around.
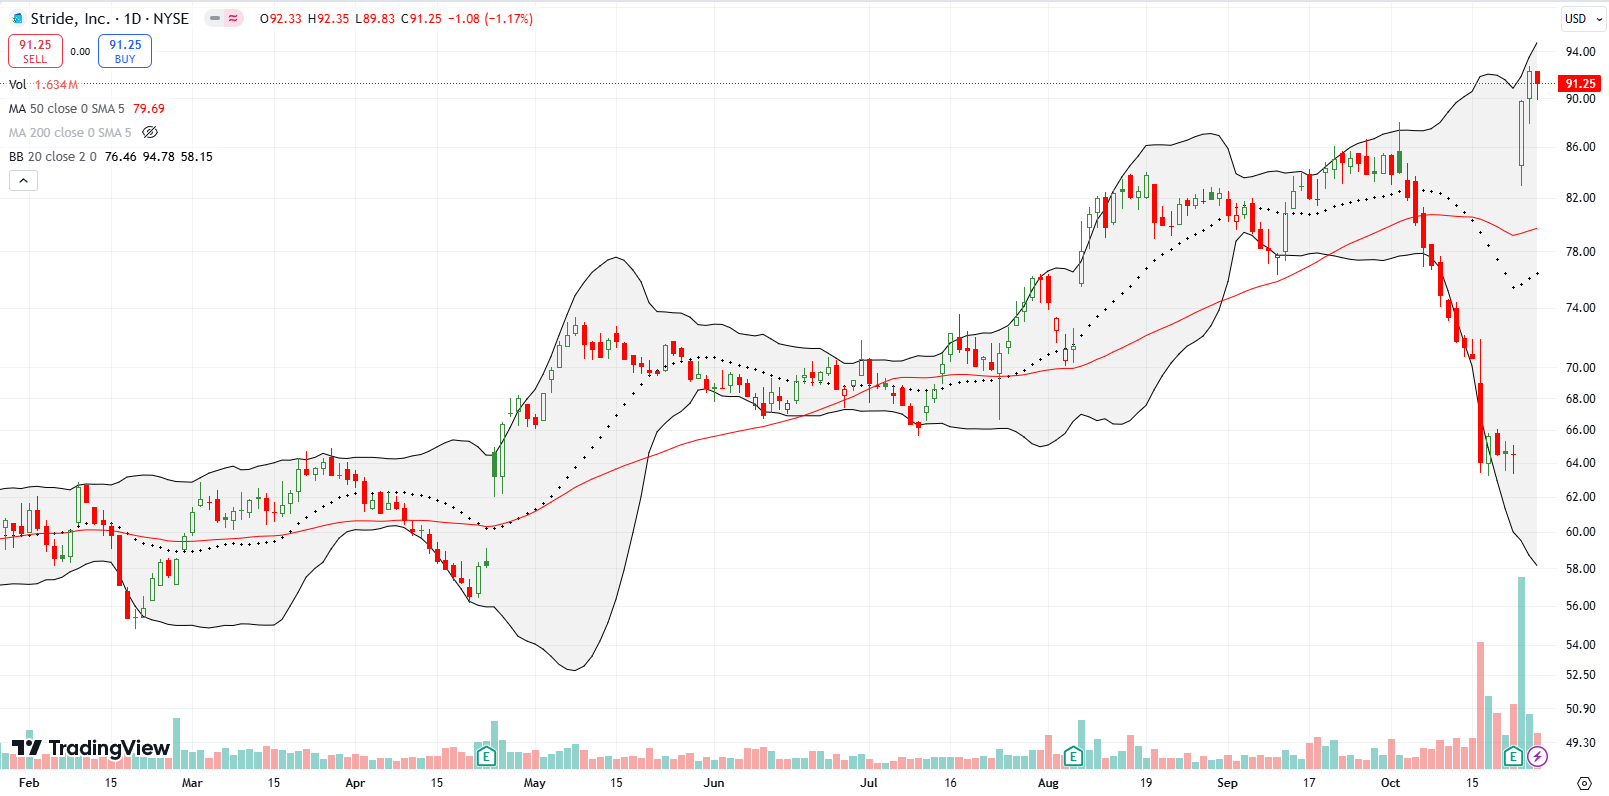
Perhaps the rebound in Stride, Inc (LRN) is a poetic example of how hard it has been this year for bears to stay bearish. In my last Market Breadth, I described my bearish trade and its close. Bears who overstayed their welcome were rudely greeted with a 39.1% post-earnings gain to an all-time high. Talk about a revenge move for buyers!
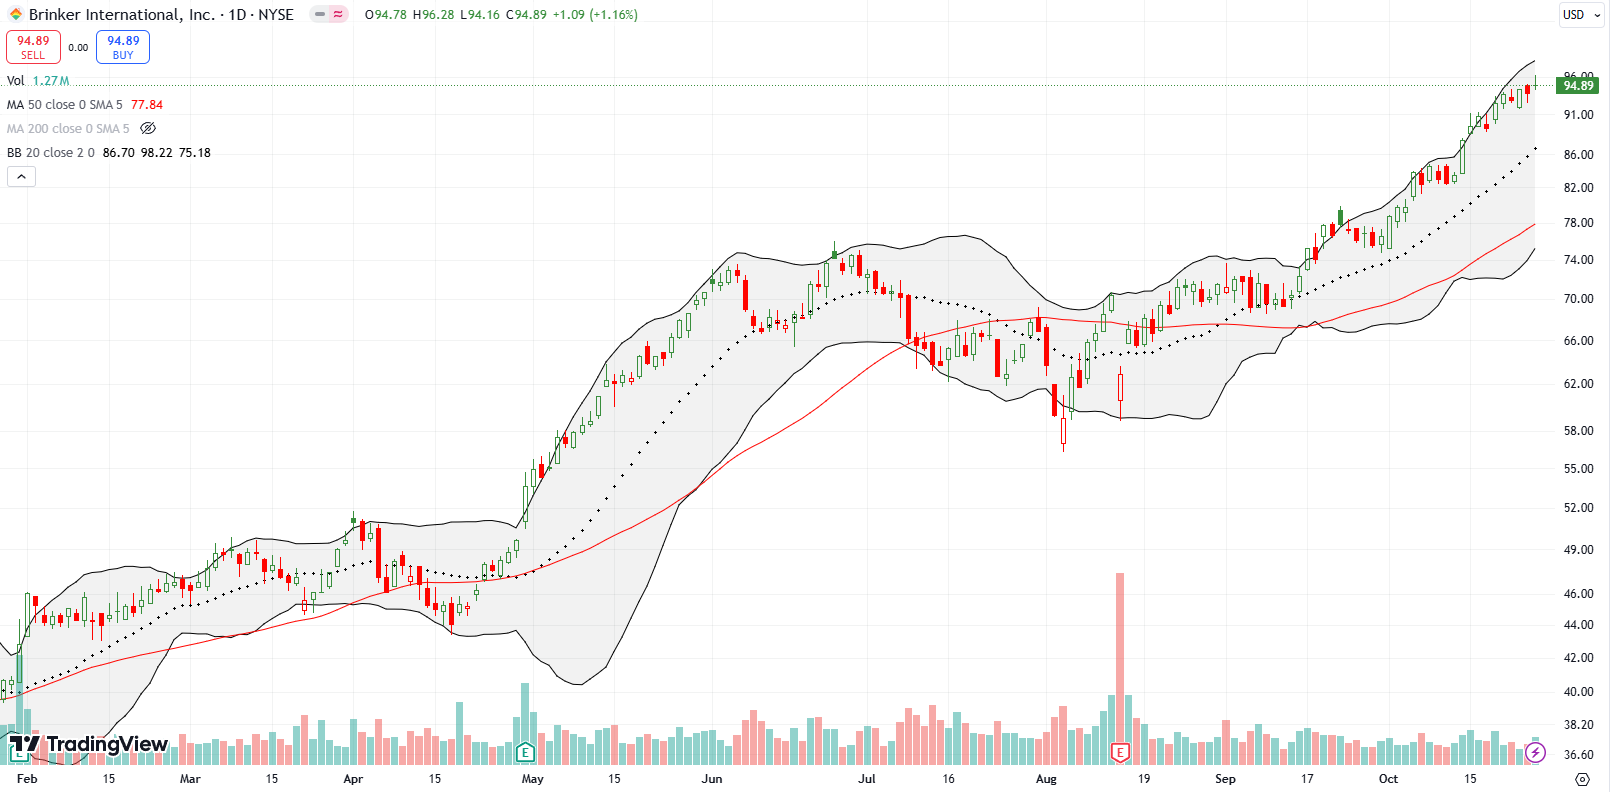
Brinker International, Inc (EAT) continues to carry a bullish banner for casual dining restaurants. Since EAT broke out to an all-time high last month, the stock has risen another 21.7%. Needless to say, I wish I had stayed on top of this trade when I laid out the possibilities in June. Also needless to say, stocks like EAT soften bearish inclinations.
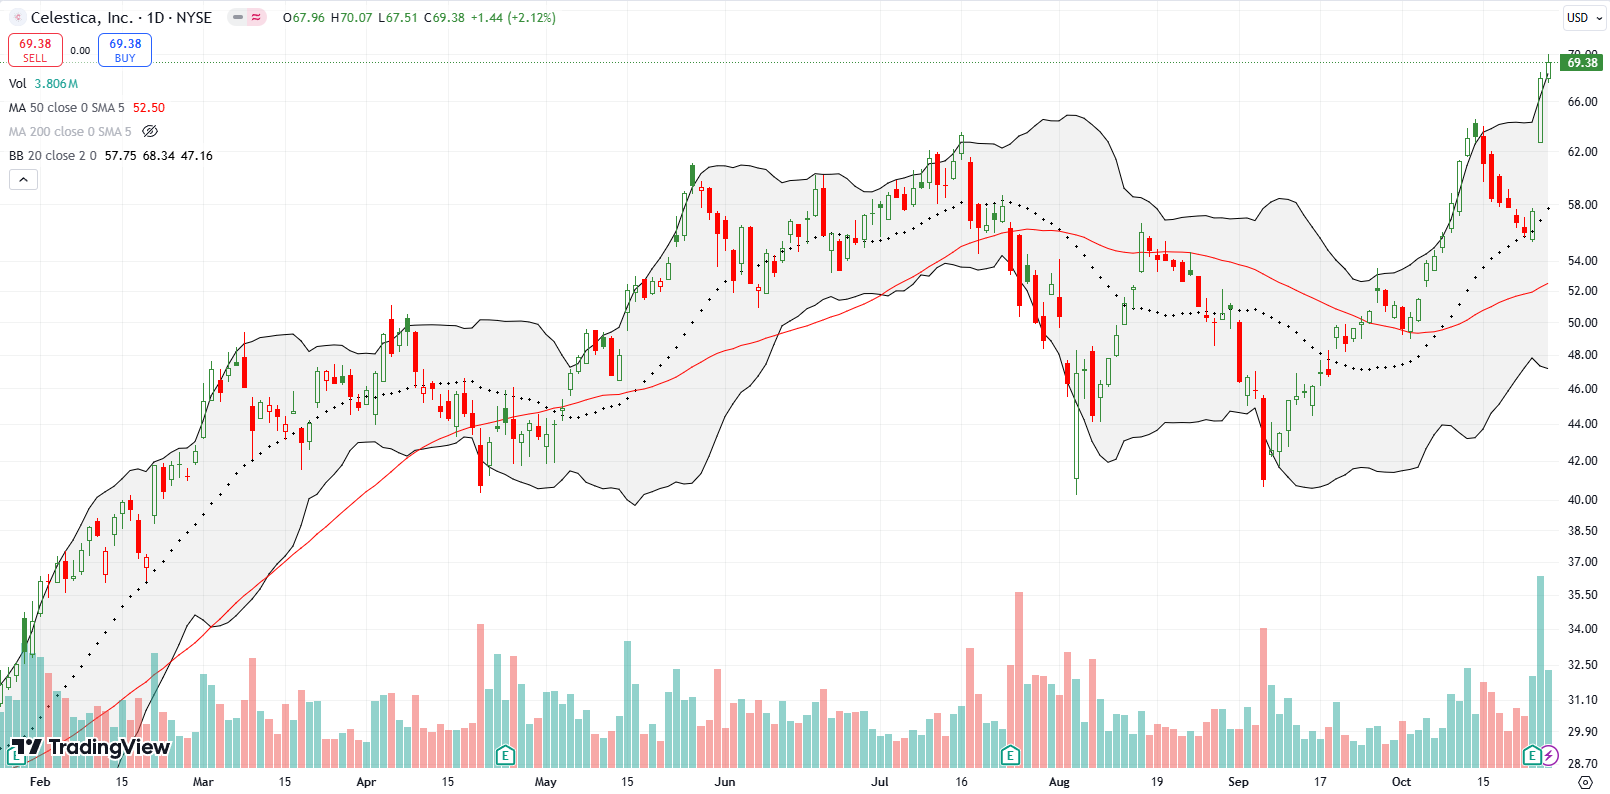
Contract manufacturer Celestica, Inc (CLS) was a great trade last year. Unfortunately, I failed to revisit the stock this year (I hope someone out there stuck with CLS or got back in!). Now CLS is back to all-time highs thanks to an 18.2% post-earnings gain. CLS is up 516% since the end of 2022. Yowza.
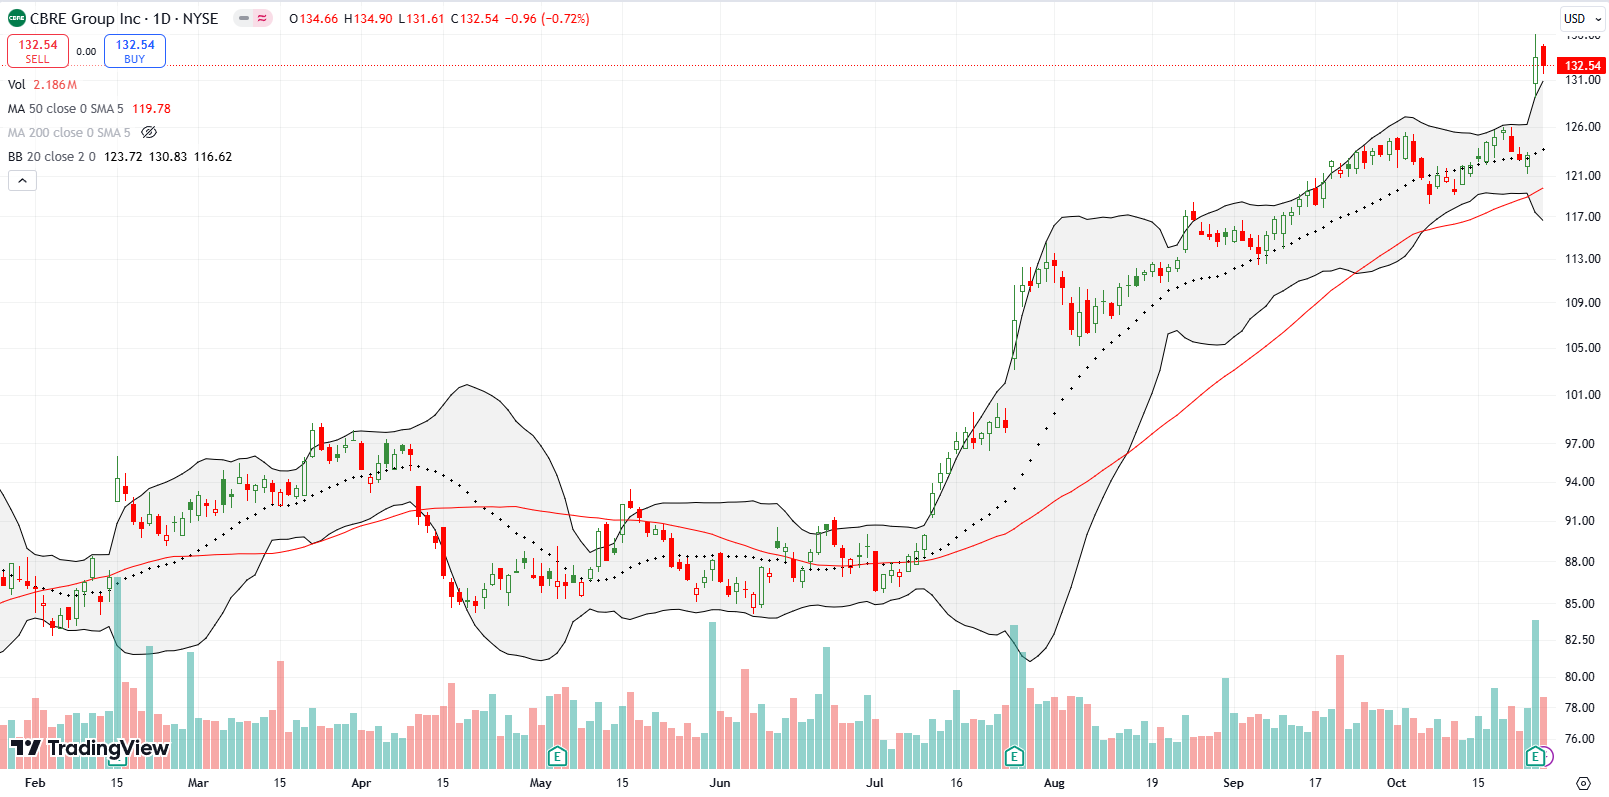
CBRE Group Inc (CBRE) is “a commercial real estate services and investment company“. The recent resurgence in long-term interest rates have somehow failed to slow CBRE down. An 8.4% post-earnings gain took CBRE to a new all-time high and created a widening divergence with ITB. I need to monitor CBRE more closely!
Be careful out there!
Footnotes
Subscribe for free to get email notifications of future posts!
“Above the 50” (AT50) uses the percentage of stocks trading above their respective 50-day moving averages (DMAs) to measure breadth in the stock market. Breadth defines the distribution of participation in a rally or sell-off. As a result, AT50 identifies extremes in market sentiment that are likely to reverse. Above the 50 is my alternative name for “MMFI” which is a symbol TradingView.com and other chart vendors use for this breadth indicator. Learn more about AT50 on my Market Breadth Resource Page. AT200, or MMTH, measures the percentage of stocks trading above their respective 200DMAs.
Active AT50 (MMFI) periods: Day #233 over 20%, Day #132 over 30%, Day #56 over 40%, Day #31 over 50%, Day #4 under 60%, Day #71 under 70%
Source for charts unless otherwise noted: TradingView.com
Full disclosure: long SPY put spread, long IWM shares and calls, long QQQ put spread, long ITB, long PLAY
FOLLOW Dr. Duru’s commentary on financial markets via StockTwits, Twitter, and even Instagram!
*Charting notes: Stock prices are not adjusted for dividends. Candlestick charts use hollow bodies: open candles indicate a close higher than the open, filled candles indicate an open higher than the close.


