
I have a good friend that comes up with interesting theories about relationships in the stock market. Recently, he claimed that “more often than not”, on a day where the big cap stocks gain and the iShares Russell 2000 ETF (IWM) does not gain, IWM will experience a daily gain on the next trading day. He lamented that he could no longer investigate these theories, and he asked whether I could do it.
I decided to test his theory with the help of “Data Analyst” in ChatGPT. My observant and detail-oriented friend was CORRECT! However, his observation comes with a HUGE caveat. While it is true IWM gained “more often than not” in this scenario, the gains do not meet the threshold of statistical significance. In other words, we cannot count on these IWM gains in the future. If a trader captures such gains, it could be the result of sheer luck.
Despite the statistical disappointment, the test of this stock market theory provides a great example of the potential of ChatGPT for navigating the complexities of price dynamics in the stock market and to test theories on stock prices.
ChatGPT Prompt Engineering
I used the Invesco QQQ Trust (QQQ) as a proxy for “big cap stocks” given this tech-laden ETF is dominated by the biggest tech stocks. I downloaded the daily price data from Yahoo Finance for QQQ and for IWM for the last 5 years.
My ChatGPT subscription gives me access to the Data Analyst feature. I uploaded manually merged csv files from Yahoo Finance and truncated the data down to closing prices. Here is my prompt for ChatGPT:
“I have a theory that I want to test. On days where QQQ experiences a daily gain and IWM does not experience a daily gain, I believe, more often than not, IWM experiences a daily gain on the next trading day. Call this next trading day Scenario 1. Analyze this theory using the attached time series data of closing prices for IWM and QQQ. Calculate the percentage of days IWM experiences a gain excluding the trading days in Scenario 1. Call this Scenario X1. Include three different tests of statistical significance for Scenario 1 using Scenario X1 as the baseline. Also calculate the percentage of days IWM experiences a gain on the second or third trading day after the day QQQ gains and IWM does not. Call these Scenario 2 and Scenario 3 respectively.”
I did not include all my analytics requests. I discovered that ChatGPT ran into all sorts of strange errors when presented with too many requests at the same. ChatGPT seems to perform best with an iterative conversation and with data ready to analyze. As a result, I started with the basic request above. I even had to experiment with different ways of stating and ordering my instructions. Needless to say I was surprised to discover the ordering made a difference in the accuracy of ChatGPT’s results! I assume ChatGPT interprets instructions best when they follow a logical order. The prompt engineering apparently should use a modular approach to problem-solving.
Importantly, I did my own manual analysis to validate ChatGPT’s results (data and analysis here). This validation helped me discover that ChatGPT can work better when key concepts carry a label (think about creating labels in a machine-learning problem). ChatGPT calculate the correct percentage of gains for the baseline only after I gave it a label (“Scenario X1”).
I also first gave ChatGPT the data in two separate files, one for QQQ and one for IWM, but the computing sweat required to merge the files seemed to degrade the quality of ChatGPT’s analysis. The Data Analyst at times even had trouble processing the files.
I asked ChatGPT these follow-up questions:
- Provide a bar chart showing the IWM percentage gains for Scenario 1, Scenario X1, Scenario 2, and Scenario 3.
- Redo the entire analysis. This time exclude trading data before 2023.
The Results Summary
While IWM indeed gains “more often than not” in my friend’s scenario, the percentage of days with a gain are not different enough from the percentage of other days with a gain to generate statistical significance. In other words, the odds that the observed gains are the result of chance are too high to accept my friend’s observation as something to expect in the future.
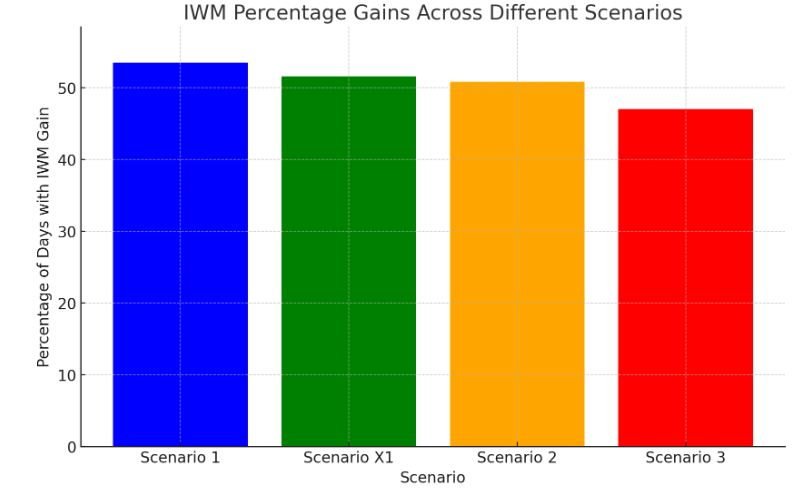
In the chart below, note the proximity of Scenario 1 (53.5%) and Scenario X1 (51.6%). Intuitively, I can see that the two percentage point difference is not significant and not enough of an edge for a meaningful trade. In other words, I might as well just buy and sell IWM every day (excluding the impact of the magnitude of gains and losses of course).
The tests of statistical significance confirm what my eyes tell me. From ChatGPT:
- Z-test for Proportions: The p-value is 0.633, indicating that there is no statistically significant difference in the proportion of days IWM experiences a gain on the next trading day after Scenario 1 compared to other days (Scenario X1).
- Chi-square Test for Independence: The p-value is 0.691, suggesting that there is no statistically significant association between the scenarios (Scenario 1 vs. Scenario X1) and the likelihood of IWM experiencing a gain.
- T-test for the Means of Daily Percentage Changes: The p-value is 0.454, indicating that there is no statistically significant difference in the means of daily percentage changes for IWM between the next day of Scenario 1 and other days (Scenario X1).
The threshold for statistical significance is conventionally a p-value below 0.05.
The Results for 2023-2024
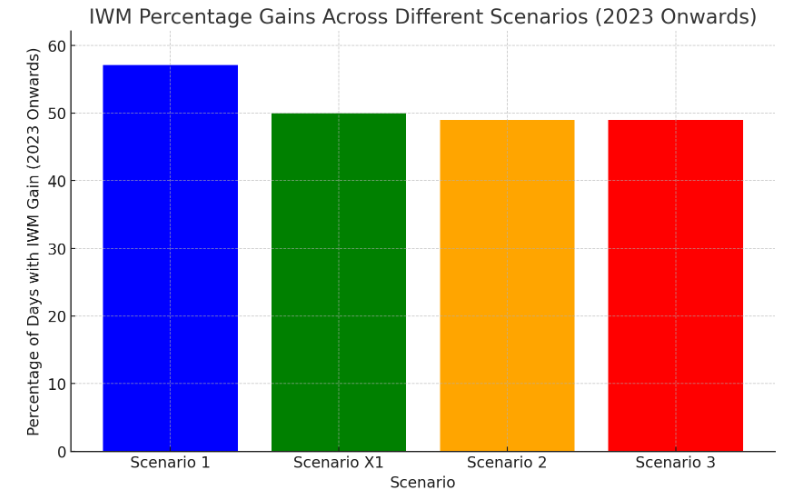
Since my friend recently made this observation of the behavior of IWM versus QQQ, perhaps limiting the data to just the last year and this year would reveal more significance. While the percentage of days with a gain increased to 57.1% versus the baseline 50.0%, the observation still failed the tests of statistical significance. The observation was very real, but the effect it is not actionable.
Despite the larger difference between Scenario 1 and Scenario X1, the statistical tests all definitively failed. The bar for significance is in a sense higher because of the smaller sample size. From ChatGPT:
- Z-test for Proportions: The p-value is 0.364, suggesting that there is no statistically significant difference in the proportion of days IWM experiences a gain on the next trading day after Scenario 1 compared to other days (Scenario X1), within the 2023 data.
- Chi-square Test for Independence: The p-value is 0.453, indicating that there is no statistically significant association between the scenarios (Scenario 1 vs. Scenario X1) and the likelihood of IWM experiencing a gain, for data from 2023 onwards.
- T-test for the Means of Daily Percentage Changes: The p-value is 0.348, showing that there is no statistically significant difference in the means of daily percentage changes for IWM between the next day of Scenario 1 and other days (Scenario X1), within the 2023 data.
")
Conclusion
The Data Analyst in ChatGPT looks like a convenient way to quickly test theories on stock prices. However, my first attempt took a lot of prompt engineering before I got the desired behaviors and accuracy. I learned that ChatGPT appears to perform best with very detailed and tightly constrained requests. An iterative conversation supports ChatGPT’s need for detail and constraint. I expect to use these learnings to conduct faster tests in the future.
Analysts often skip tests of statistical significance when mining for relationships in the stock market. ChatGPT’s Data Analyst makes these tests easy to access, execute and interpret. Thus, there is little excuse anymore for skipping this important step. Now, almost any stock market data mining exercise can include the context of significance and quantified relevance.
Be careful out there!
Full disclosure: long IWM calendar put spread
Epilogue: ChatGPT’s Response
Here is how ChatGPT responded to my first prompt….
To analyze your theory, I’ll proceed with the following steps:
- Load and Inspect the Data: First, I’ll load the attached CSV file to understand its structure and the data it contains.
- Calculate Daily Gains: Determine the daily percentage change for both QQQ and IWM.
- Identify Scenario 1 Days: Days where QQQ experiences a daily gain and IWM does not.
- Analyze Scenario 1: Calculate the percentage of days IWM experiences a gain on the next trading day after Scenario 1.
- Calculate Scenario X1: Calculate the percentage of days IWM experiences a gain excluding the trading days in Scenario 1.
- Statistical Significance Tests: Perform three different statistical tests to compare the results of Scenario 1 with Scenario X1.
- Analyze Scenarios 2 and 3: Calculate the percentage of days IWM experiences a gain on the second and third trading day after the day QQQ gains and IWM does not.
Let’s start with the first step: loading and inspecting the data.
The data consists of three columns: Date, QQQ (closing prices for QQQ), and IWM (closing prices for IWM). With this understanding, I’ll proceed to calculate the daily percentage change for both QQQ and IWM to identify days that meet the criteria for Scenario 1 (QQQ gains, IWM does not gain), and then analyze the subsequent scenarios and perform statistical tests as outlined.
Based on the analysis of the provided data, here are the findings:
- Scenario 1: On the next trading day after QQQ experiences a daily gain and IWM does not, IWM experiences a daily gain 53.48% of the time.
- Scenario X1: Excluding the trading days in Scenario 1, IWM experiences a daily gain 51.59% of the time.
This indicates that following the criteria of Scenario 1, there is a slightly higher likelihood of IWM experiencing a gain on the next trading day compared to other days.
Now, for the statistical significance tests comparing Scenario 1 with Scenario X1, I’ll perform three different tests:
- Z-test for proportions,
- Chi-square test for independence, and
- T-test for the means of daily percentage changes.
Additionally, the percentage of days IWM experiences a gain on the second and third trading day after the day QQQ gains and IWM does not (Scenarios 2 and 3) are:
- Scenario 2: 50.80%
- Scenario 3: 47.06%
Next, I’ll conduct the statistical significance tests for Scenario 1 using Scenario X1 as the baseline.
The results of the three statistical significance tests comparing Scenario 1 with Scenario X1 are as follows:
- Z-test for Proportions: The p-value is 0.633, indicating that there is no statistically significant difference in the proportion of days IWM experiences a gain on the next trading day after Scenario 1 compared to other days (Scenario X1).
- Chi-square Test for Independence: The p-value is 0.691, suggesting that there is no statistically significant association between the scenarios (Scenario 1 vs. Scenario X1) and the likelihood of IWM experiencing a gain.
- T-test for the Means of Daily Percentage Changes: The p-value is 0.454, indicating that there is no statistically significant difference in the means of daily percentage changes for IWM between the next day of Scenario 1 and other days (Scenario X1).
These statistical tests suggest that the difference observed in the percentage of days IWM experiences a gain following Scenario 1 compared to Scenario X1 does not have statistical significance. Thus, while there is a slight difference in the observed percentages, this difference is not enough to reject the null hypothesis of no difference between the scenarios under the conditions tested.
Do you think that augmenting your analytics skills with ChatGPT’s can increase your peak capability, or purely your productivity, going forward?
For this first try, ChatGPT slowed me down a LOT. I had to do a lot of prompt engineering to get it the complete answer I wanted (and get it accurately!). I think the coolest thing is that I can do more sophisticated stuff faster. I can also apply familiar models without needing to know their intricate details, and I can even learn new ones. One of the statistical tests I had not even heard of before! So, over time, I expect this to increase both my peak capability and my producitivity.
It’s too bad that ChatGPT doesn’t have the ability to go to Yahoo Finance and get the data. You have to download data and prepare CSV files manually.
Yeah. I tried just putting in the URL. If you are a developer, you can of course code up something that pulls the data automatically. You can then also create much more elaborate data mining programs that feed a number of scenarios to ChatGPT for testing.
Did you try similar thing on Gemini (Bard) and compare the results
No. I actually haven’t used Bard in months. I got tired of its poor results. I was just telling a cousin that I might even need to drop GOOG from my generative AI basket.
I get it . But google has the most data than any other company so not sure why it’s genAI is not performing well
I don’t get it either! We have to assume they will get their act together at some point, but right now, I have found myself wasting time with Bard. I will definitely give Gemini a try at some point. With every passing month, I find myself getting more locked into ChatGPT….