Stock Market Commentary
Stocks stumbled their way through a week fraught with hopes and fears for Fed Chair Jerome Powell’s speech at Jackson Hole. With looming oversold conditions, the most significant technical event occurred with a bearish engulfing right under important resistance levels for both the S&P 500 and the NASDAQ. The relief buying that followed Powell’s speech was unconvincing. Overhead resistance looks solid so the path of least resistance looks like an eventual visit to oversold trading territory.
Still, the sellers have a lot to prove with important support levels close by. If tests of support coincide with oversold market breadth, then I fully expect sharp rallies to follow.
The Stock Market Indices
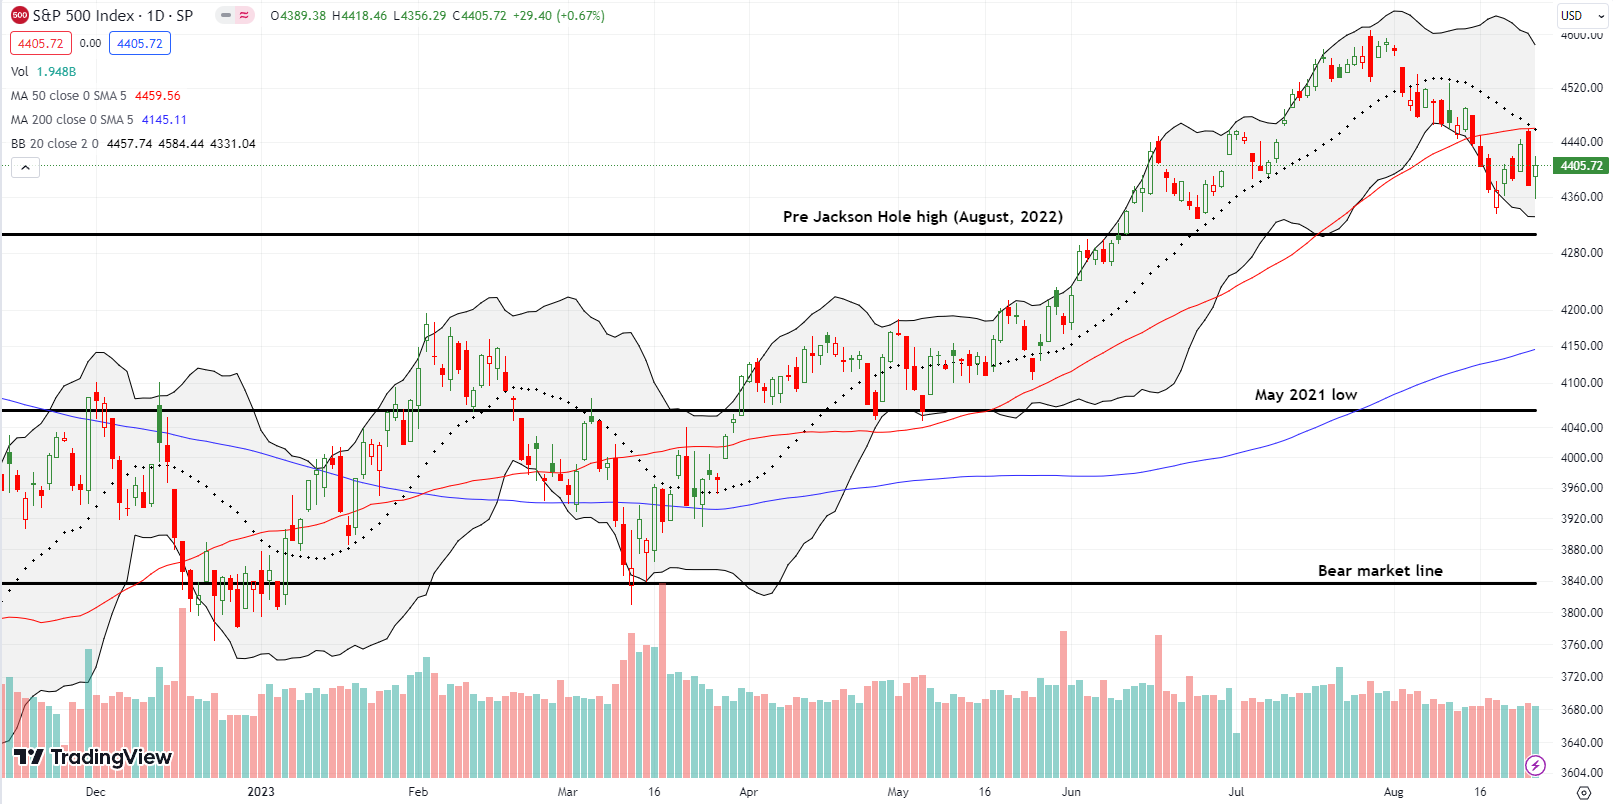
The S&P 500 (SPY) failed right at converged resistance from the 20-day moving average (DMA) (dotted line below) and the 50DMA (red line below). The resistance happens to coincide with the close at the end of June, representing the point where the S&P 500 lost all its gains for July. The accompanying 1.4% loss on Thursday appeared to relieve some of the fear going into Fed Chair Jerome Powell’s Jackson Hole speech. The index gapped and held on for a 0.7% gain on the day. Still, the index looks set for closing out August in the red with a maximum drawdown much greater than the month’s average or median maximum drawdown.
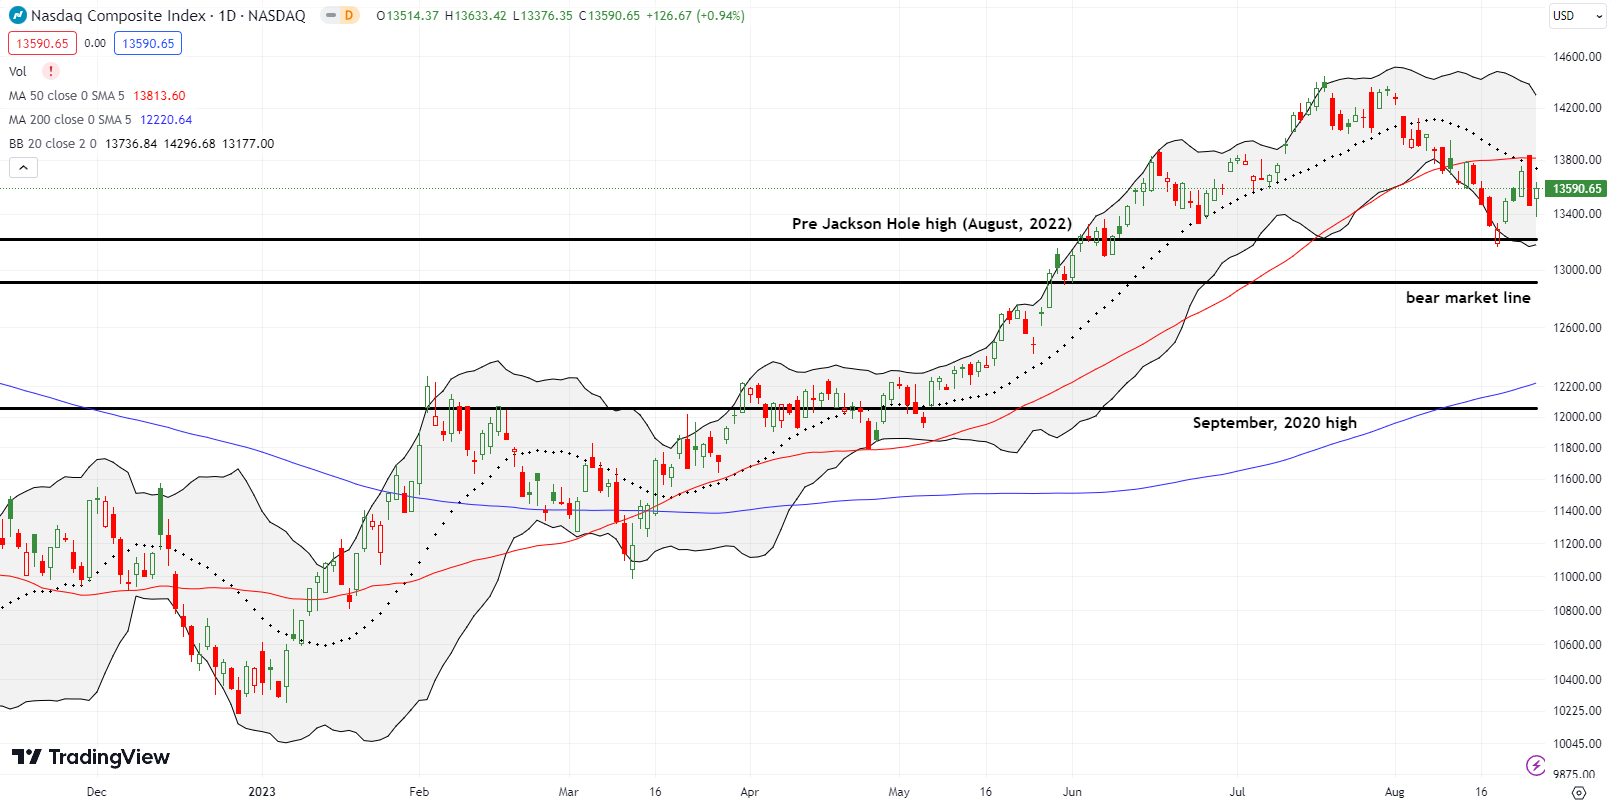
The NASDAQ (COMPQ) once again mimicked the behavior of the S&P 500. The main feature of the tech-laden index is its near picture-perfect test of its last high before Jackson Hole 2022. The failure at converged 20DMA and 50DMA resistance means the NASDAQ may be set up to retest support at the key Jackson Hole 2022 milestone. From there, the bear market line looms as the next support level.
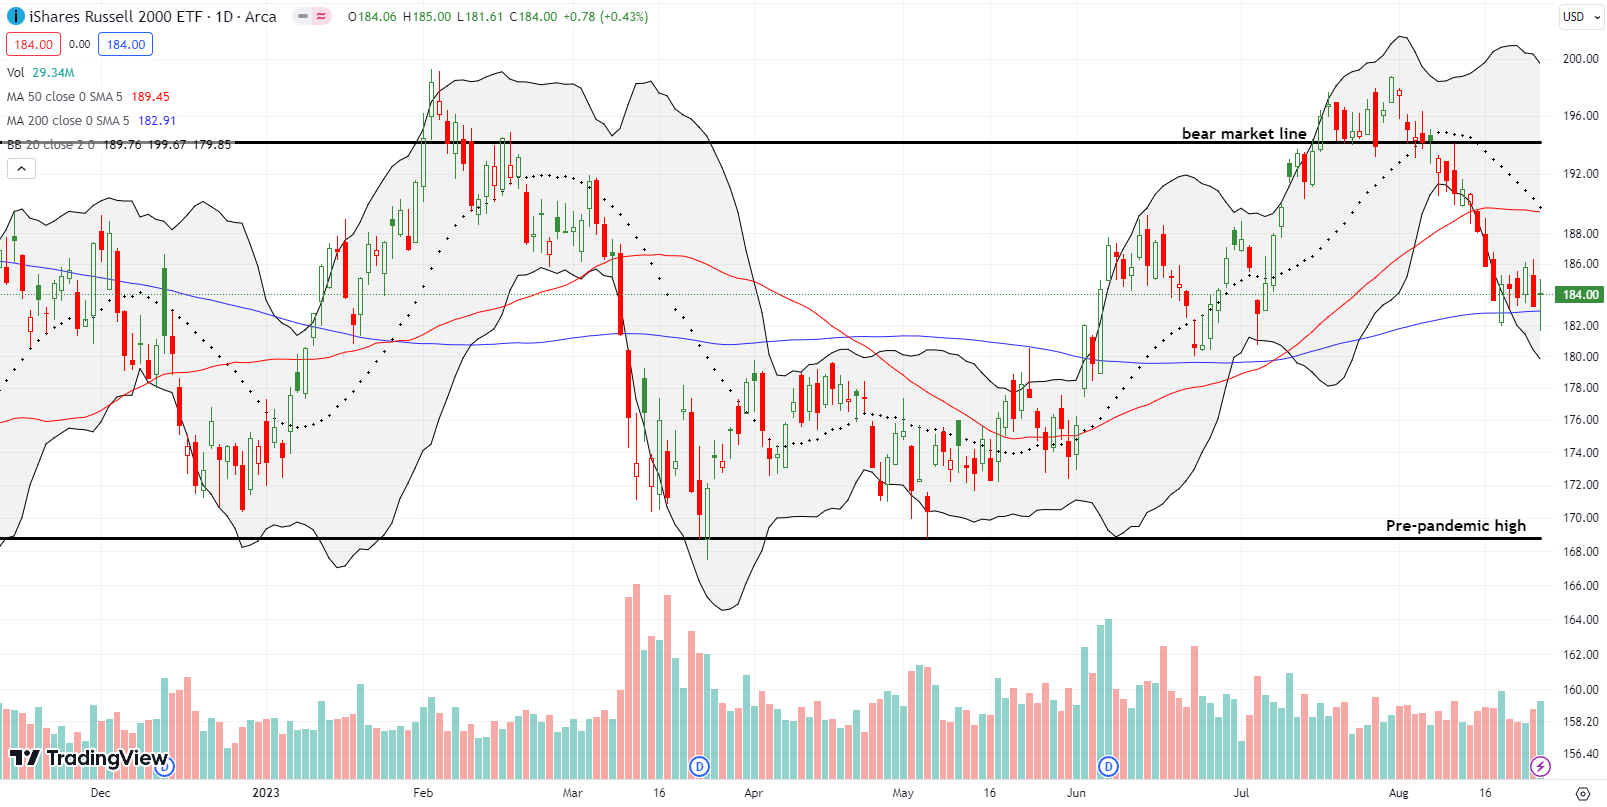
The iShares Russell 2000 ETF (IWM) is stumbling along 200DMA support (the bluish line below) amid looming oversold conditions. For the second time in six trading days the ETF of small cap stocks broke through support only to have buyers rush in and save the day. The longer IWM hangs out here, the more I worry that the support from the June and July lows will give way to a larger sell-off. For now, I am sitting on the long side of what is left from a calendar call spread.
The Short-Term Trading Call with Looming Oversold Conditions
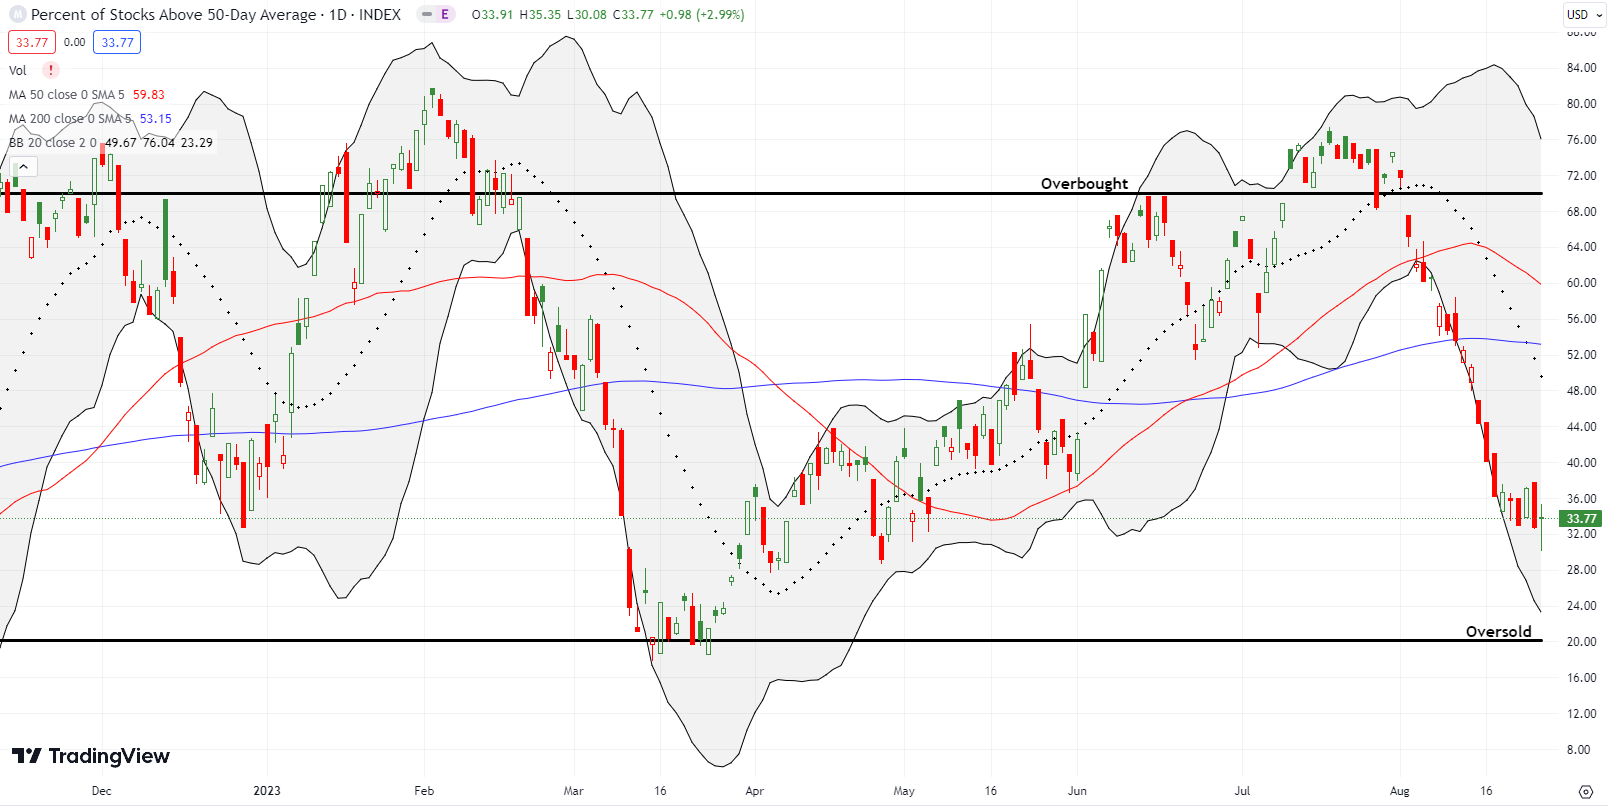
- AT50 (MMFI) = 33.8% of stocks are trading above their respective 50-day moving averages (day #3 overbought)
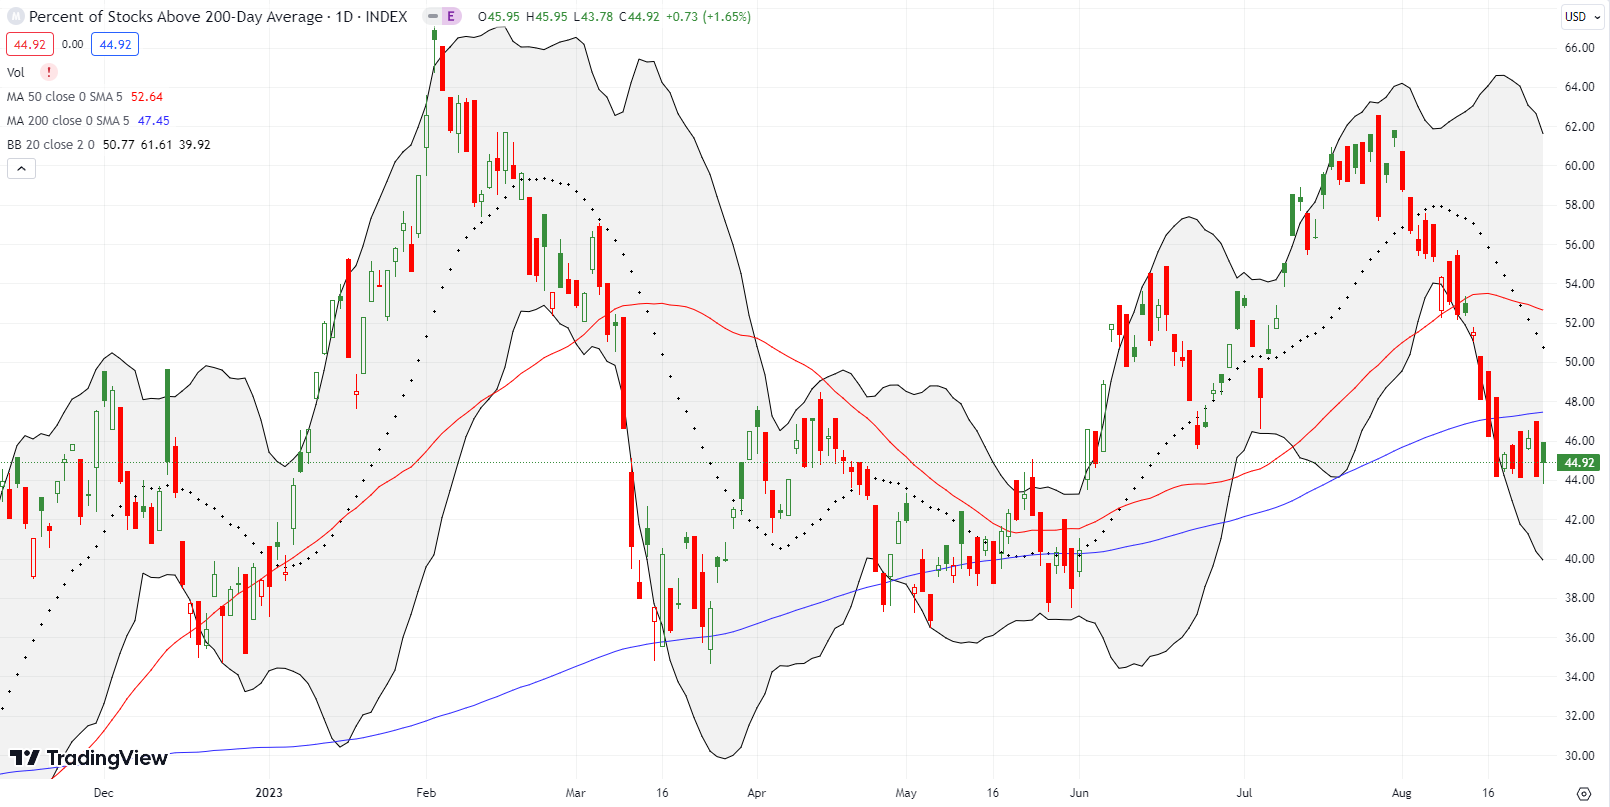
- AT200 (MMTH) = 44.9% of stocks are trading above their respective 200-day moving averages
- Short-term Trading Call: neutral
AT50 (MMFI), the percentage of stocks trading above their respective 50DMAs, dropped as low as 30.1% before rebounding a bit to 33.8%. Market breadth is at a spot that is “close enough” to bullish. Unfortunately, the technical reality of tops and breakdowns for the major indices alongside worsening macroeconomic conditions makes trades to the long side more and more treacherous. In other words, my favorite technical indicator is flagging looming oversold conditions. August is ending without a meaningful bounce from the current drawdown. Thus, September sets up to to take the market even lower as the second of the market’s three most dangerous months.
The short-term trading call stays at neutral to reflect the tenuous balance between bullish (oversold) and bearish (resistance) factors in the market. I find myself favoring put options over calls for short-term trades while digging my heels into the shares of stocks I think have been overdone to the downside.
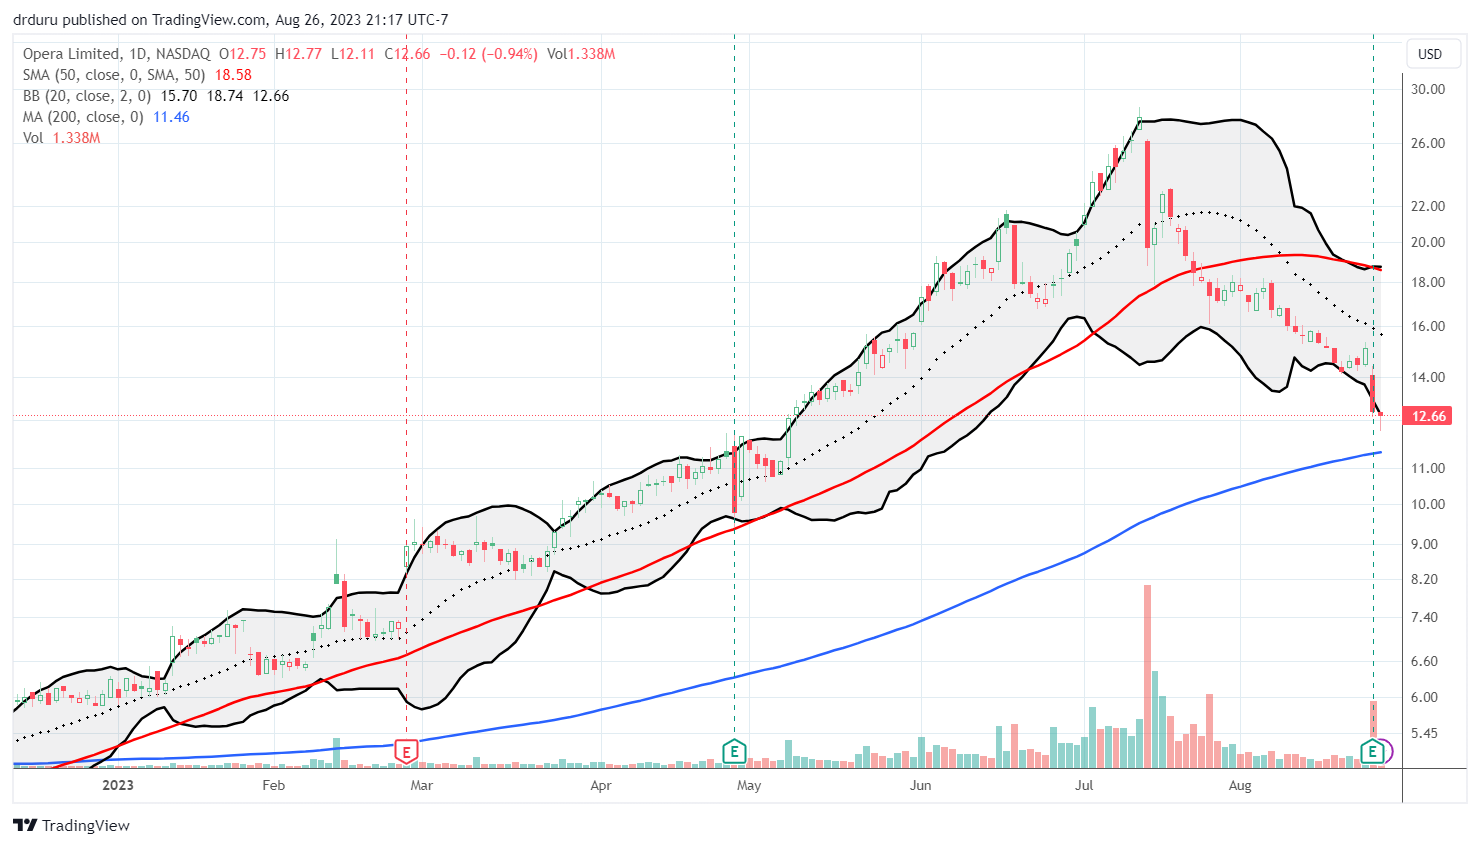
I thought Opera Limited (OPRA) was overdone to the downside when it fell 29.0% from all-time highs. Immediate profits melted away into a bearish 50DMA breakdown (poor risk management). Reluctantly, I gave up on the trade.
I watched with relief after OPRA lost 15.3% post-earnings last week. Clearly, there is more going on than a simple sentiment shift after OPRA startled the market with a renewal of an authorization to sell shares. If OPRA fails to survive a looming test of 200DMA support, the stock will turn into yet one more busted bubble.
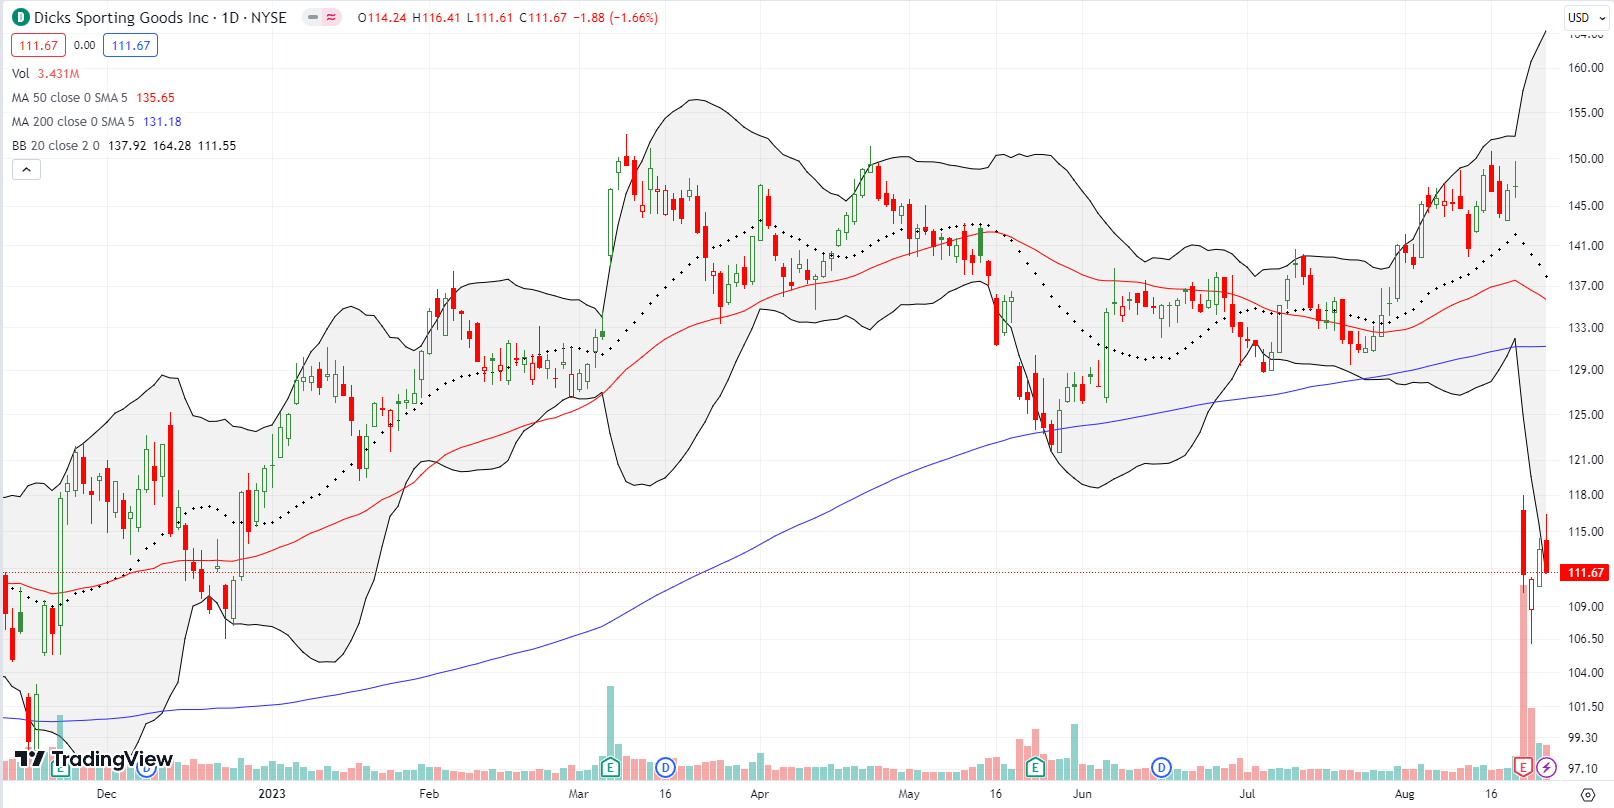
Sporting goods were one of many darlings in the pandemic economy. Dicks Sporting Goods Inc (DKS) DKS hit an all-time high September, 2021. From there, DKS sold off into the summer but rallied in time to record a gain for 2022 while sellers crushed most of the market. March, 2023 earnings brought DKS close to but not through its all-time high. DKS even rallied in August while the rest of the market pulled back….until earnings. Last week, DKS lost 24.1% post-earnings. For the first time in a while DKS is under-performing the market. The plunge looks like the confirmation of a massive topping formation after the stock tried three times this year and failed to breach all-time highs.
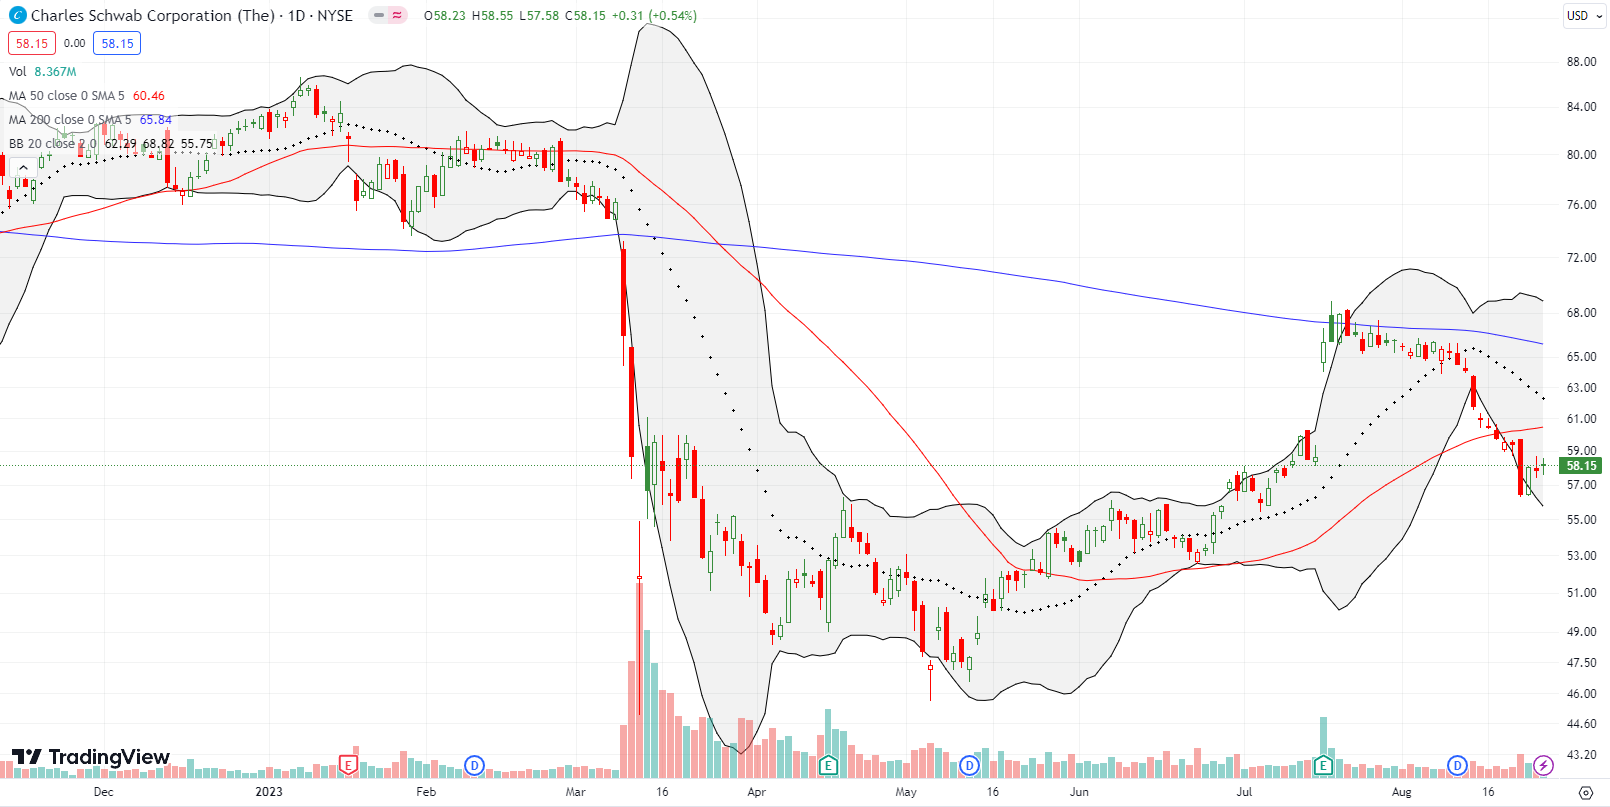
In early May, I looked at The Charles Schwab Corporation (SCHW) as a short-term trade for a rebound. That trade worked. However, I lamented missing out on a post-earnings surge in July back to 200DMA resistance. SCHW drifted lower from there until suffering a fresh 50DMA breakdown. A 5.0% loss on Tuesday that followed weakness in financials decisively confirmed the breakdown. SCHW is now in a “no man’s land” between the low of the big down day and 50DMA resistance. I will look to trade a breakout from this limbo.
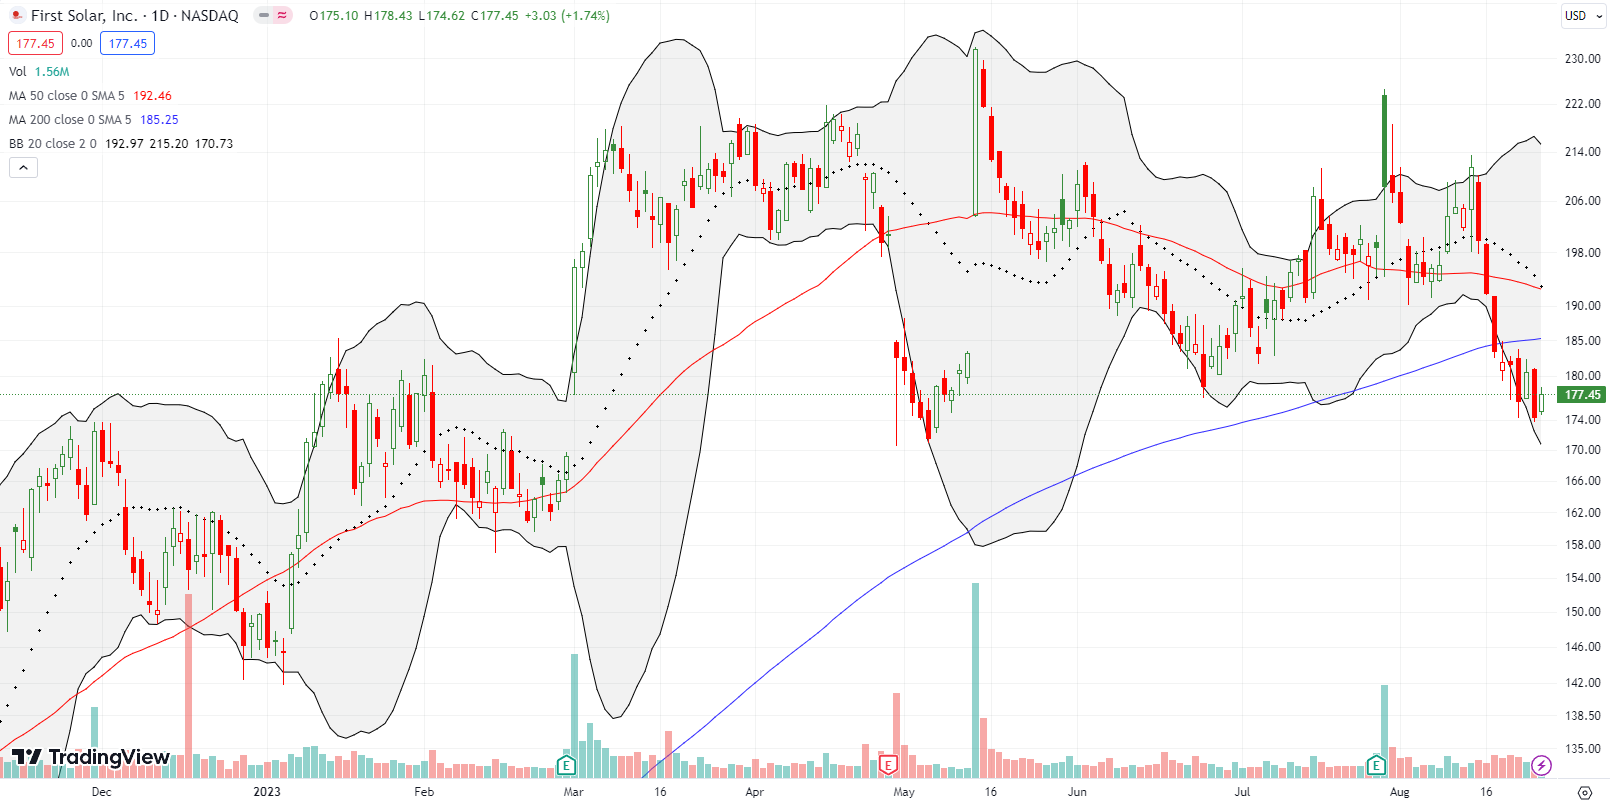
A month ago I talked about waiting out the selling pressure in First Solar (FSLR). That selling pressure actually accelerated two weeks ago after some weak earnings among key solar stocks. FSLR has now confirmed a 200DMA breakdown with a tenuous hold on support from the May lows. Panning back, FSLR looks like it is just chopping around. I am holding my small number of shares, but I see no additional trade here for the time being.
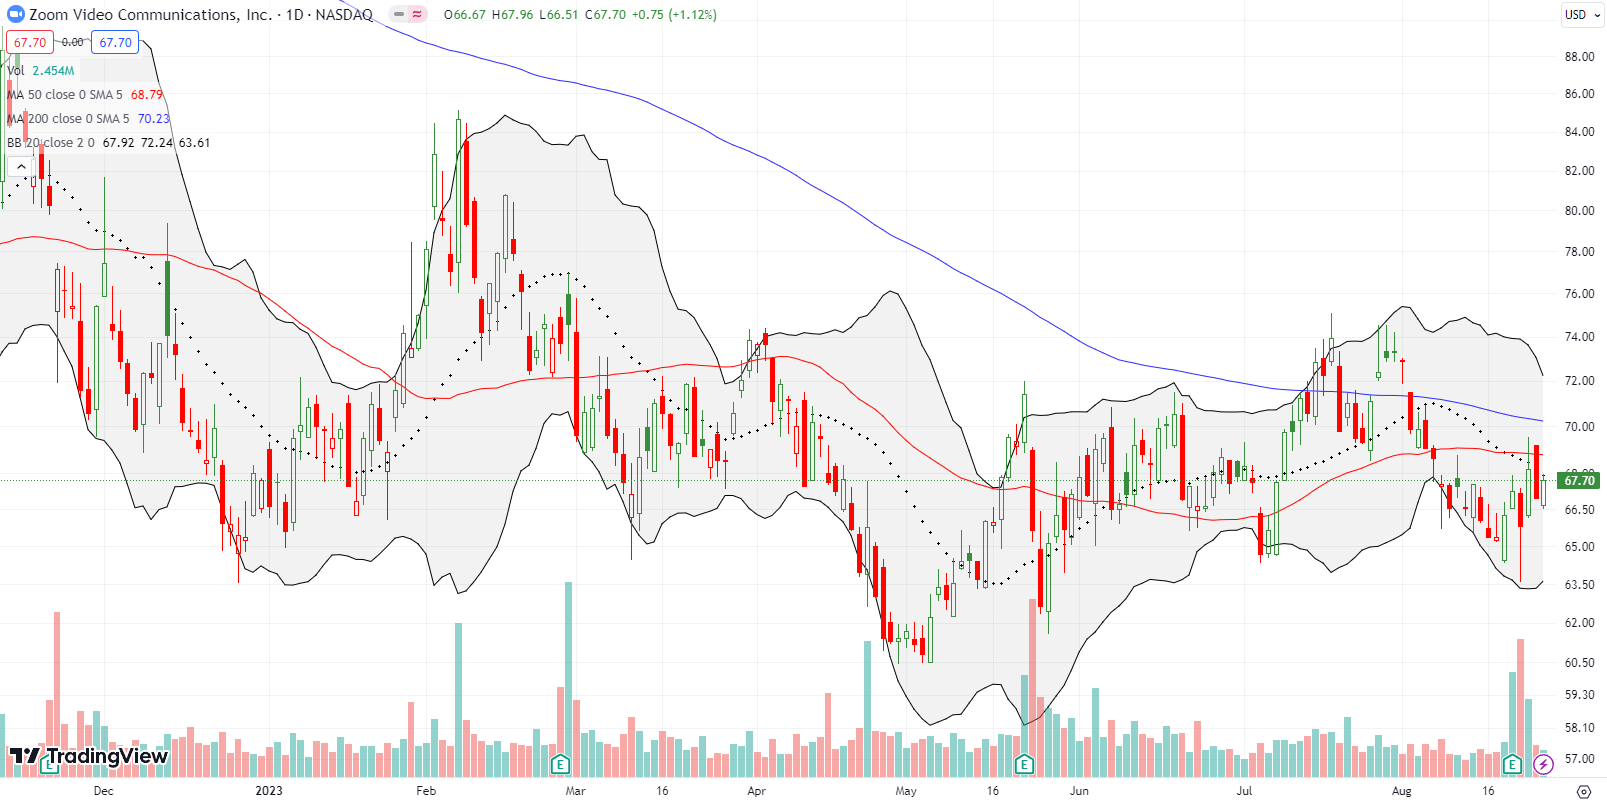
I may have an unhealthy obsession with Zoom Video Communications, Inc (ZM). Despite the company’s competitive issues, I think ZM is finally attractively valued at 4.6x sales and 15.6 forward P/E. While I have been correct about a bottom in the stock (easy to do given the stock market’s general bullishness this year!), buyers refuse to send ZM into a fresh lift-off. July’s 200DMA breakouts turned into fakeouts. On the positive side, buyers turned ZM around after a brief post-earnings setback last week. Still, the 50DMA and 200DMA continue to present large hurdles for ZM.
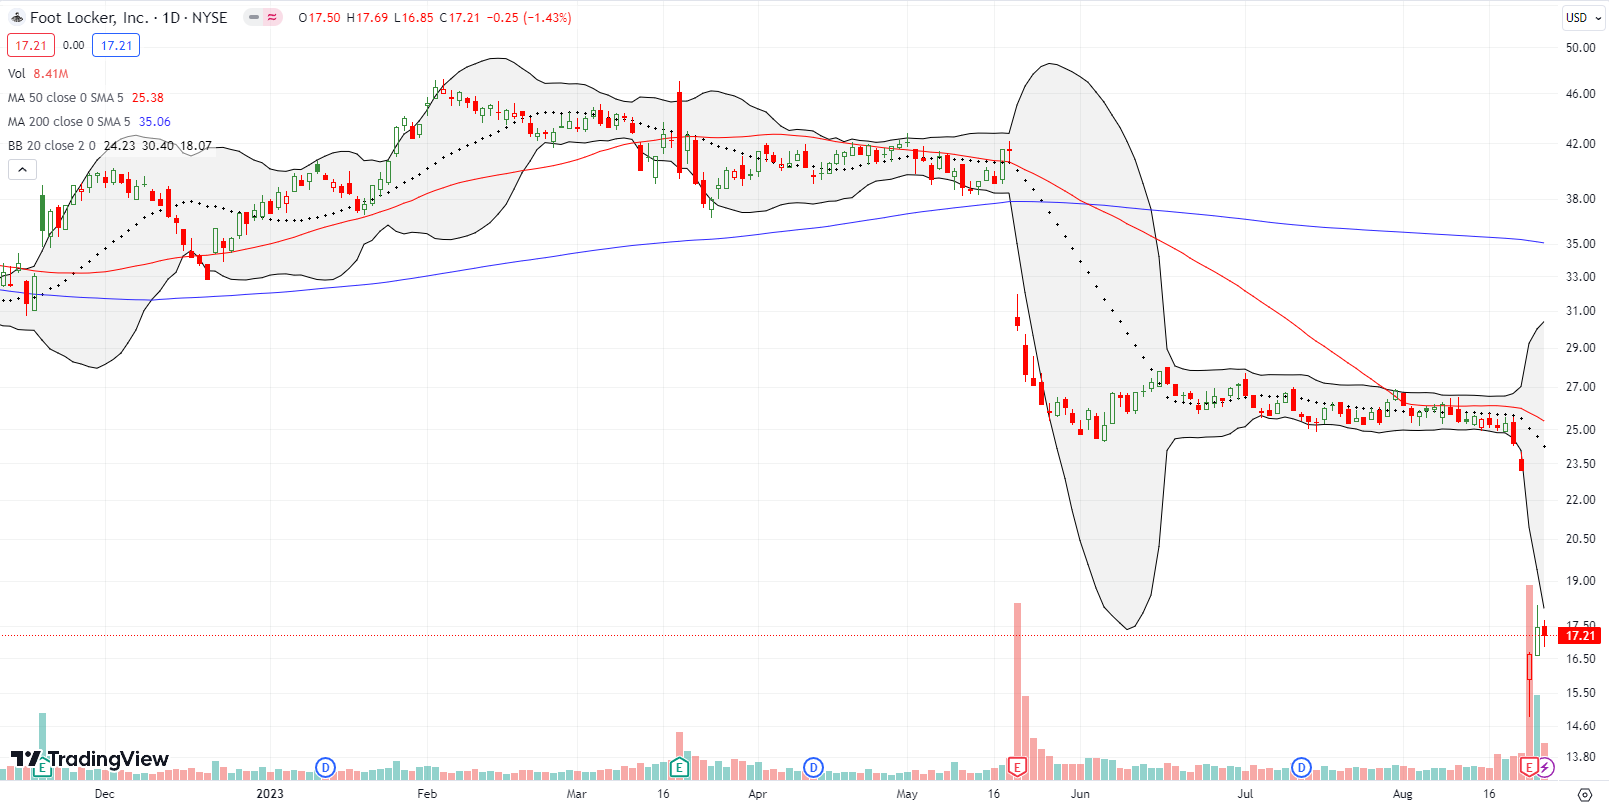
The struggles for Foot Locker, Inc (FL) continue. Almost a year and a half ago I expressed relief over avoiding bottom-fishing in FL. Last week’s 28.3% post-earnings plunge took FL to a near 13-year closing low. This business is clearly in trouble.
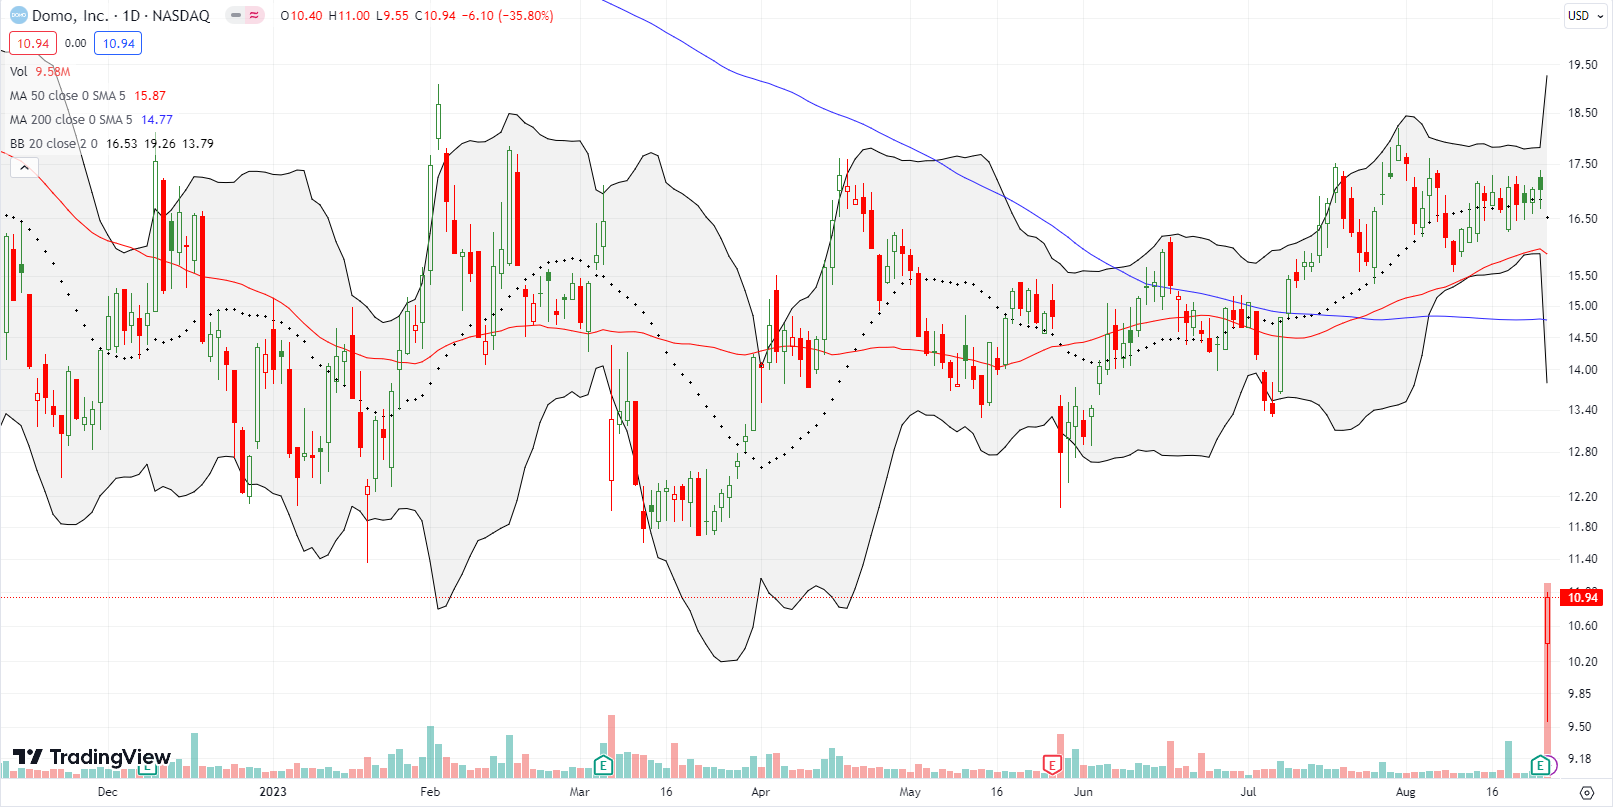
Domo, Inc (DOMO) is a data analytics platform that I learned last year. DOMO plunged with the rest of its cohort last year but looked like it was stabilizing this year….until last week’s earnings took the stock down to its pandemic lows with a 35.8% loss. I should not be surprised given the post-earnings collapse in Alteryx (AYX) almost 3 weeks ago. The competition is heating up in this sector with exciting start-ups and the increasing heft of the biggest players. At this point, DOMO is barely interesting as a play for a dead cat bounce.
Be careful out there!
Footnotes
Subscribe for free to get email notifications of future posts!
“Above the 50” (AT50) uses the percentage of stocks trading above their respective 50-day moving averages (DMAs) to measure breadth in the stock market. Breadth defines the distribution of participation in a rally or sell-off. As a result, AT50 identifies extremes in market sentiment that are likely to reverse. Above the 50 is my alternative name for “MMFI” which is a symbol TradingView.com and other chart vendors use for this breadth indicator. Learn more about AT50 on my Market Breadth Resource Page. AT200, or MMTH, measures the percentage of stocks trading above their respective 200DMAs.
Active AT50 (MMFI) periods: Day #104 over 20%, Day #78 over 30% (overperiod), Day #7 under 40% (underperiod), Day #61 over 50%, Day #14 under 60%, Day #18 under 70%
Source for charts unless otherwise noted: TradingView.com
Full disclosure: long IWM call, long FSLR, long ZM calendar call spread,
FOLLOW Dr. Duru’s commentary on financial markets via StockTwits, Twitter, and even Instagram!
*Charting notes: Stock prices are not adjusted for dividends. Candlestick charts use hollow bodies: open candles indicate a close higher than the open, filled candles indicate an open higher than the close.


