Stock Market Commentary:
A week ago, I cautioned that “the tenuous positioning is further weakened by a breakout of volatility and significant deterioration in the market breadth indicators.” The November CPI report showed the slightest surprise possible and faked out the stock market on the way to another hawkish statement from the Federal Reserve on monetary policy. The subsequent selling delivered follow-through to last week’s bearish readings and also created a freshly precarious situation for financial markets just as a Santa Claus rally should be underway. A naughty Fed denied approval for the Santa rally by leaving the stock market with no positive catalysts to anticipate. Short-term technical rallies should continue to be fade candidates.
The Stock Market Indices
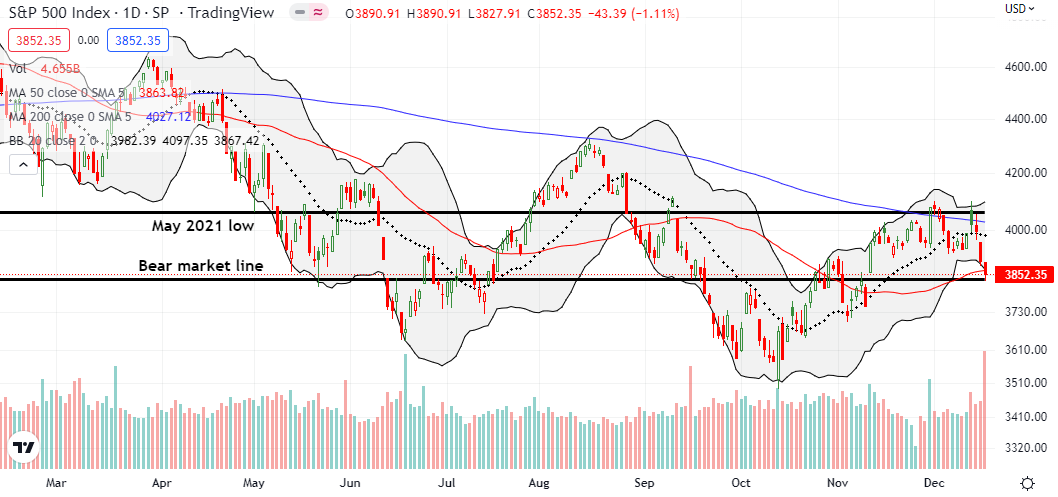
The S&P 500 (SPY) lost 1.1% on the day and 2.1% on the week. In the middle, the November CPI report delivered yet another fakeout. Two months ago, a “CPI Shocker” with good news helped the stock market bottom. This latest report looks like it created final exhaustion for buyers.
The S&P 500 created multiple points of technical damage on its way to a tepid retest of the bear market line. On Tuesday, the index gapped above its 200-day moving average (DMA) (the blue line below) only to fade into a close below the 200DMA; the key May, 2021 low once again held as resistance. Fed day delivered a confirmation of the 200DMA breakdown. Friday’s continuation selling delivered a 50DMA (the red line below) breakdown. This deepening of the bearish trading action is just one more down day away from a return to bear market territory and a confirmation of the 50DMA breakdown.
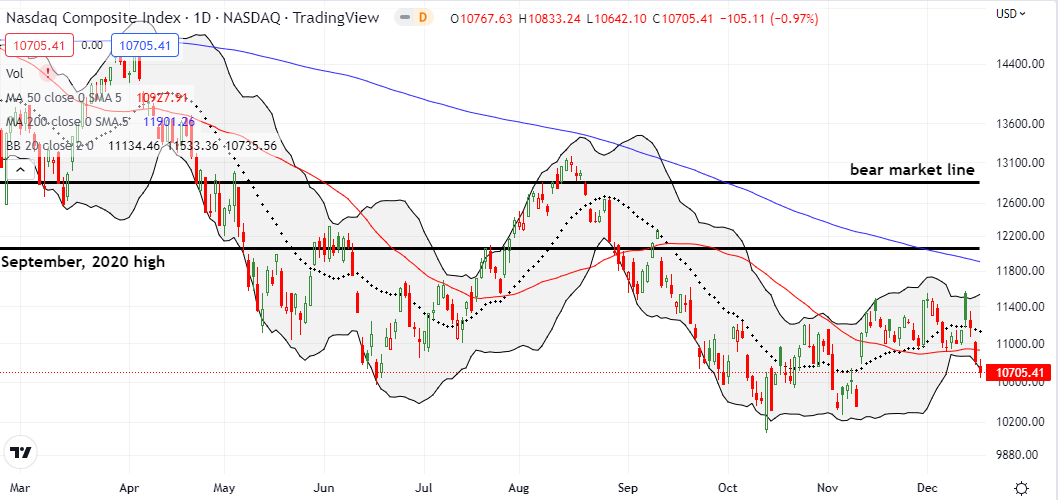
The NASDAQ (COMPQ) is in fresh trouble. The tech-laden index confirmed a 50DMA breakdown with a 1.0% Friday loss. The NASDAQ is now pushing into the gap created on November 10th when the NASDAQ finally broke out above its 50DMA. The catalyst then was the October CPI report (imagine that). Note to self, place bets on post-CPI report rallies! Anyway, I followed the 50DMA breakdown with a QQQ Dec 30 $270/$260 put spread.
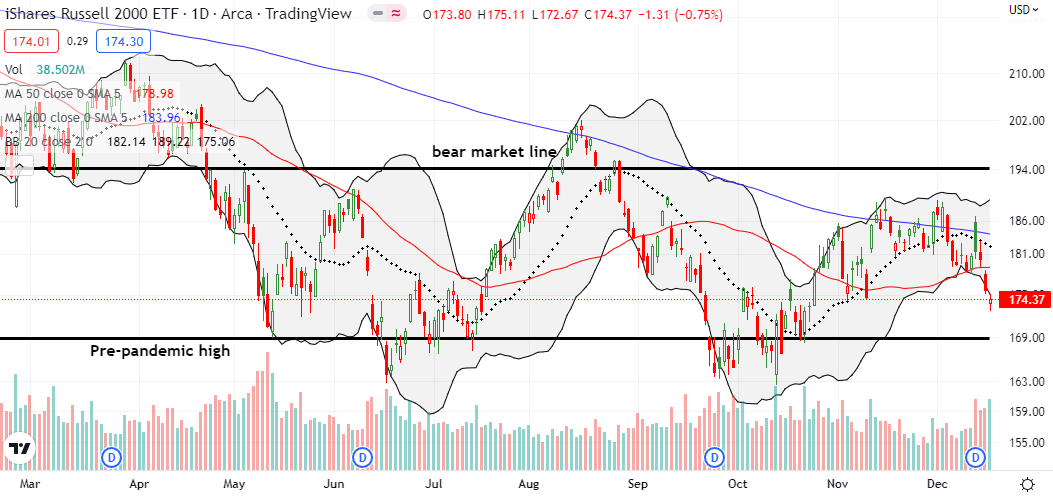
In the prior week, the iShares Russell 2000 ETF (IWM) was in the most precarious position of the major indices. Last week, the ETF of small cap stocks joined the NASDAQ in confirming a 50DMA breakdown. I also bought an IWM put spread to play selling pressure going into January. I sold a weekly December 23rd $170 put against a long January $170 put. This position reduces the cost of making the bearish bet into January.
Stock Market Volatility
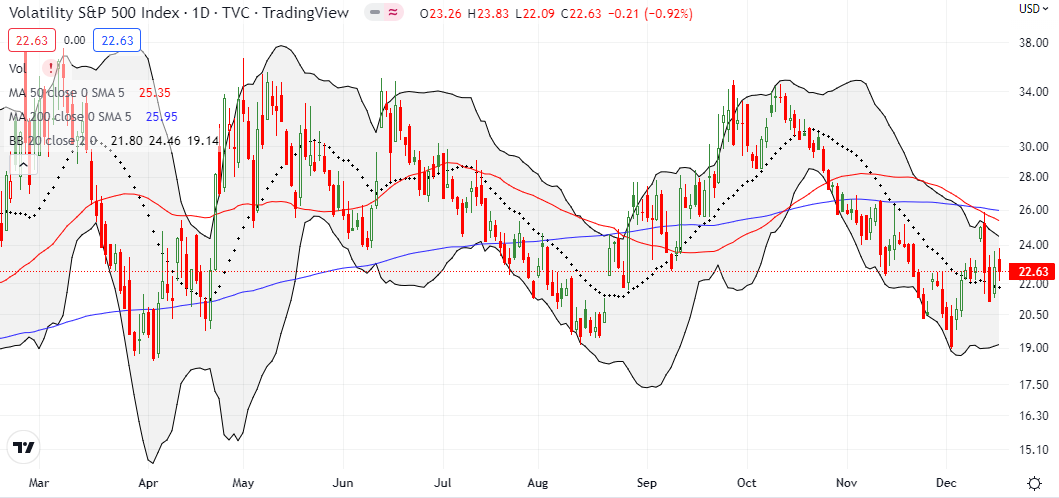
The volatility index (VIX) somehow closed the week FLAT. The VIX had a truly bizarre week. It gapped up and soared 9.6% to start the week. It promptly reversed all those gains and then some the next day as if someone corrected a pricing mistake. With selling following the Fed disappointment, the VIX declined some more anyway. The VIX woke up on Thursday but barely budged on Friday. All I can do is scratch my head in bewilderment. Some truly strange positioning must be going on in the S&P 500 options pit.
The Short-Term Trading Call With A Naughty Fed
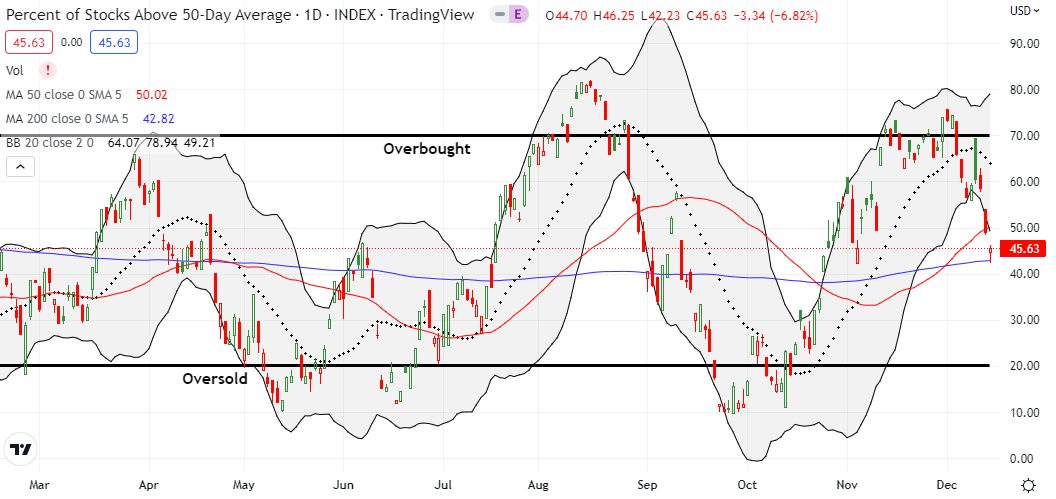
- AT50 (MMFI) = 45.6% of stocks are trading above their respective 50-day moving averages
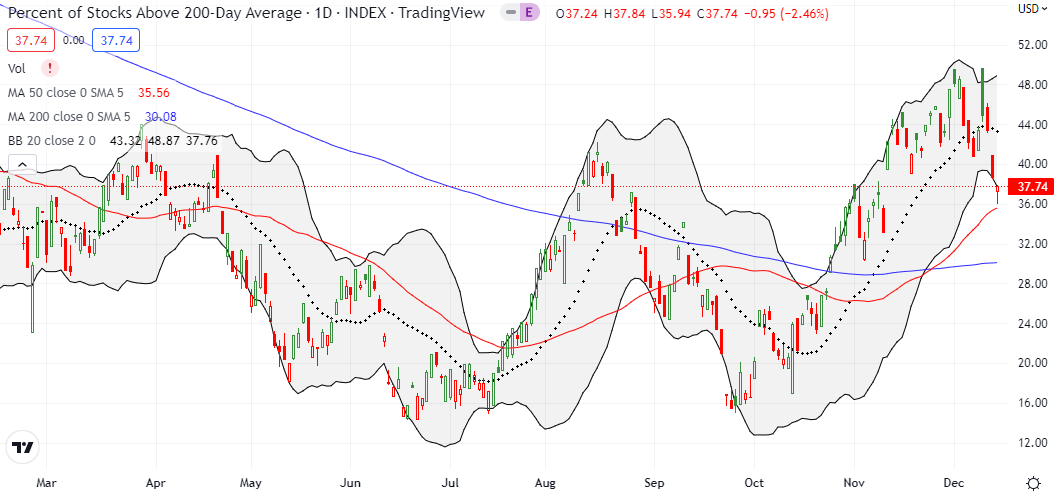
- AT200 (MMTH) = 37.7% of stocks are trading above their respective 200-day moving averages
- Short-term Trading Call: cautiously bearish
AT50 (MMFI), the percentage of stocks trading above their respective 50DMAs, fell to a 6-week low. Tuesday’s fade from the overbought threshold (70%) sealed the fate for my favorite technical indicator. AT50 spent the rest of the week in retreat and once again confirmed the (cautiously) bearish short-term trading call. However, since AT50 closed right at its low from the November 3rd pullback, there is some potential for a technical rebound and relief rally. I will look to fade rallies, especially going in the January, 2023 earnings season.
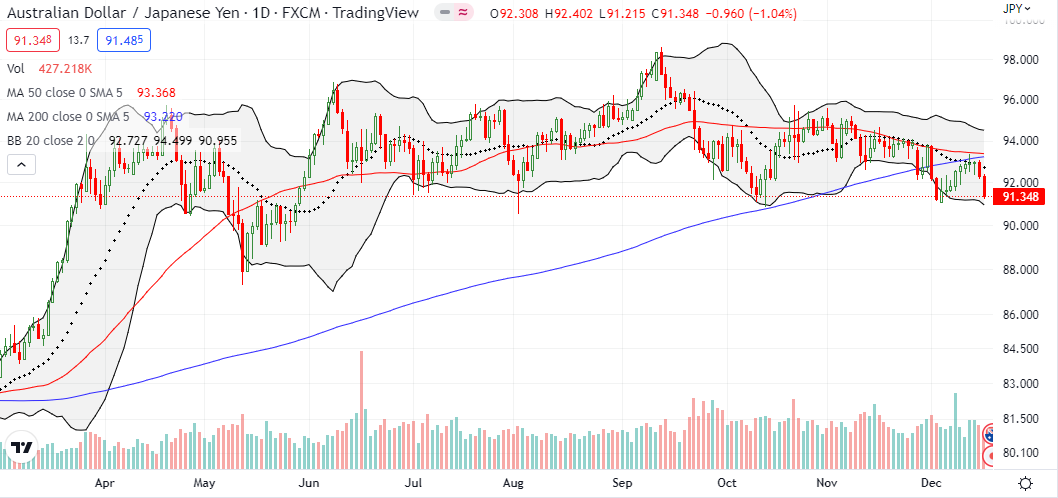
The Australian dollar versus the Japanese yen (AUD/JPY) added its own confirmation of bearish trading signals. Two straight down days confirmed 200DMA resistance. I started watching AUD/JPY more closely after the first 200DMA breakdowns in late November and early December given what this currency pair can say about risk tolerance. AUD/JPY is just a nudge away from its own bearish breakdown as it teeters on a level that has held as support for much of the year.
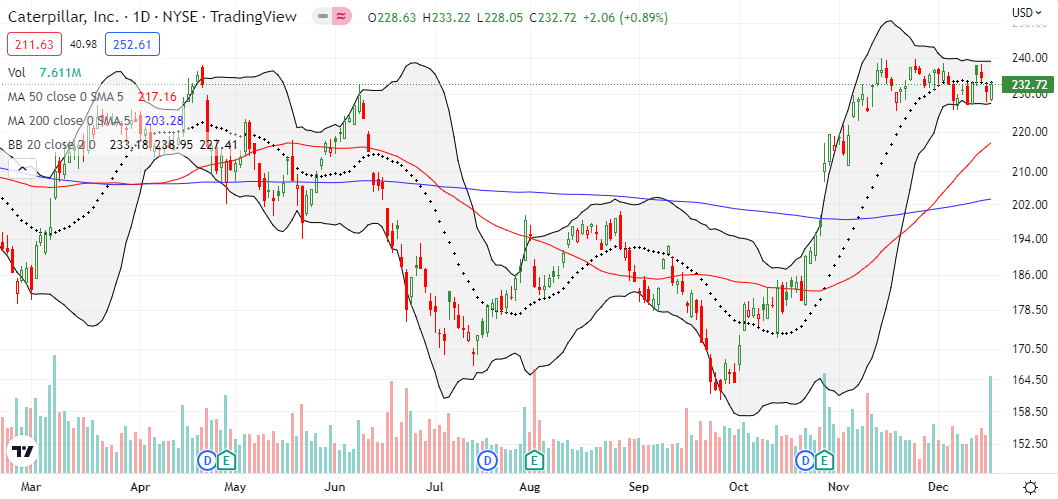
Caterpillar, Inc (CAT) has stayed amazingly resilient during this bearish period. CAT is holding a trading range in place for the last 6 weeks. CAT even gained 0.9% on Friday. I am looking to follow CAT in the direction of a breakout or a breakdown independent of my short-term trading call.
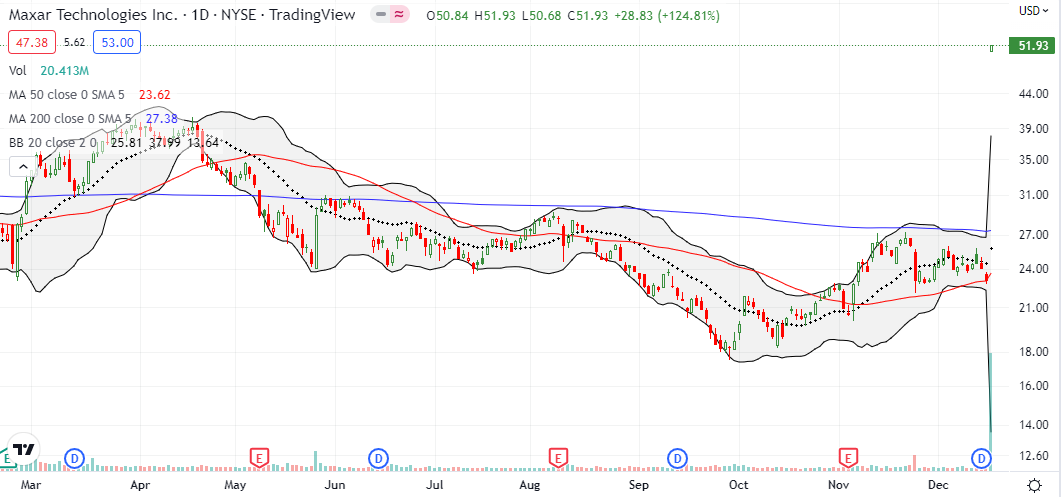
I first made the case for Maxar Technologies (MAXR) almost a year and a half ago. At that time, Goldman Sachs (GS) issued a $52 price target. MAXR finally hit that (now expired) target thanks to a buyout offer from Advent International. I had acquired a substantial position in MAXR so I practically fell out of my seat upon seeing the 125% surge. I promptly locked in the gain; I am not interest in waiting until next year for the full value of the deal to come through. A M&A activity this month cautions me to avoid getting overly bearish on individual stocks with reasonable to low valuations.
Be careful out there!
Footnotes
“Above the 50” (AT50) uses the percentage of stocks trading above their respective 50-day moving averages (DMAs) to measure breadth in the stock market. Breadth defines the distribution of participation in a rally or sell-off. As a result, AT50 identifies extremes in market sentiment that are likely to reverse. Above the 50 is my alternative name for “MMFI” which is a symbol TradingView.com and other chart vendors use for this breadth indicator. Learn more about AT50 on my Market Breadth Resource Page. AT200, or MMTH, measures the percentage of stocks trading above their respective 200DMAs.
Active AT50 (MMFI) periods: Day #44 over 20%, Day #40 over 30%, Day #38 over 40% (overperiod), Day #2 under 50% (underperiod), Day #8 under 60%, Day #10 under 70%
Source for charts unless otherwise noted: TradingView.com
Full disclosure: long IWM calendar put spread, long SPY calendar call spread, long QQQ put spread
FOLLOW Dr. Duru’s commentary on financial markets via StockTwits, Twitter, and even Instagram!
*Charting notes: Stock prices are not adjusted for dividends. Candlestick charts use hollow bodies: open candles indicate a close higher than the open, filled candles indicate an open higher than the close.


VIX: the weird behavior was NOT duplicated by its dependent ETFs, such as VIXY. I can see the VIX term structure here
http://vixcentral.com
… but does it explain – or further confuse – the disparity?
CAT: beware, my understanding is that CAT is heavily dependent on China’s economy. China is evidently relaxing its zero-Covid policy, for multiple reasons (1: it’s not achievable, 2: it’s killing their economy, 3: it’s causing unprecedented protests and even calls for Xi to step down). China’s fundamentals can apparently drive CAT contrary to the USA’s.
I STILL don’t know what to make of the VIX. Just looks screwy. And ultimately, if the dependent ETFs did not reflect the VIX volatility, then this price action is not actionable.
For CAT, I think following the technicals beats trying to guess whether the market cares about what’s going on with China. I am expecting a breakout or breakdown to be a key tell on what’s going on…or at least what the market wants to believe about what’s going on in China.