Stock Market Commentary:
I did not back my way into an explanation for Wednesday’s post-Fed rally in the stock market, and I will not do so to explain the rest of the market’s impressively relentless comeback. In fact, the rally makes little sense given the prevailing narrative of fears over higher rates – not to mention the weighty and tragic images accumulating from Russia’s invasion of Ukraine. Those fears dropped the market into low fuel levels going into the Fed meeting. Sure, a little relief rally on the news was well within the realm of possibilities, but an all out burst of euphoria is quite outstanding. This display of strength sits at the extremes.
Still, the technicals continue to flag bullish conditions. The relentless comeback melted away key resistance levels across major indicators. The baton returns to the sellers to prove a point.
The Stock Market Indices
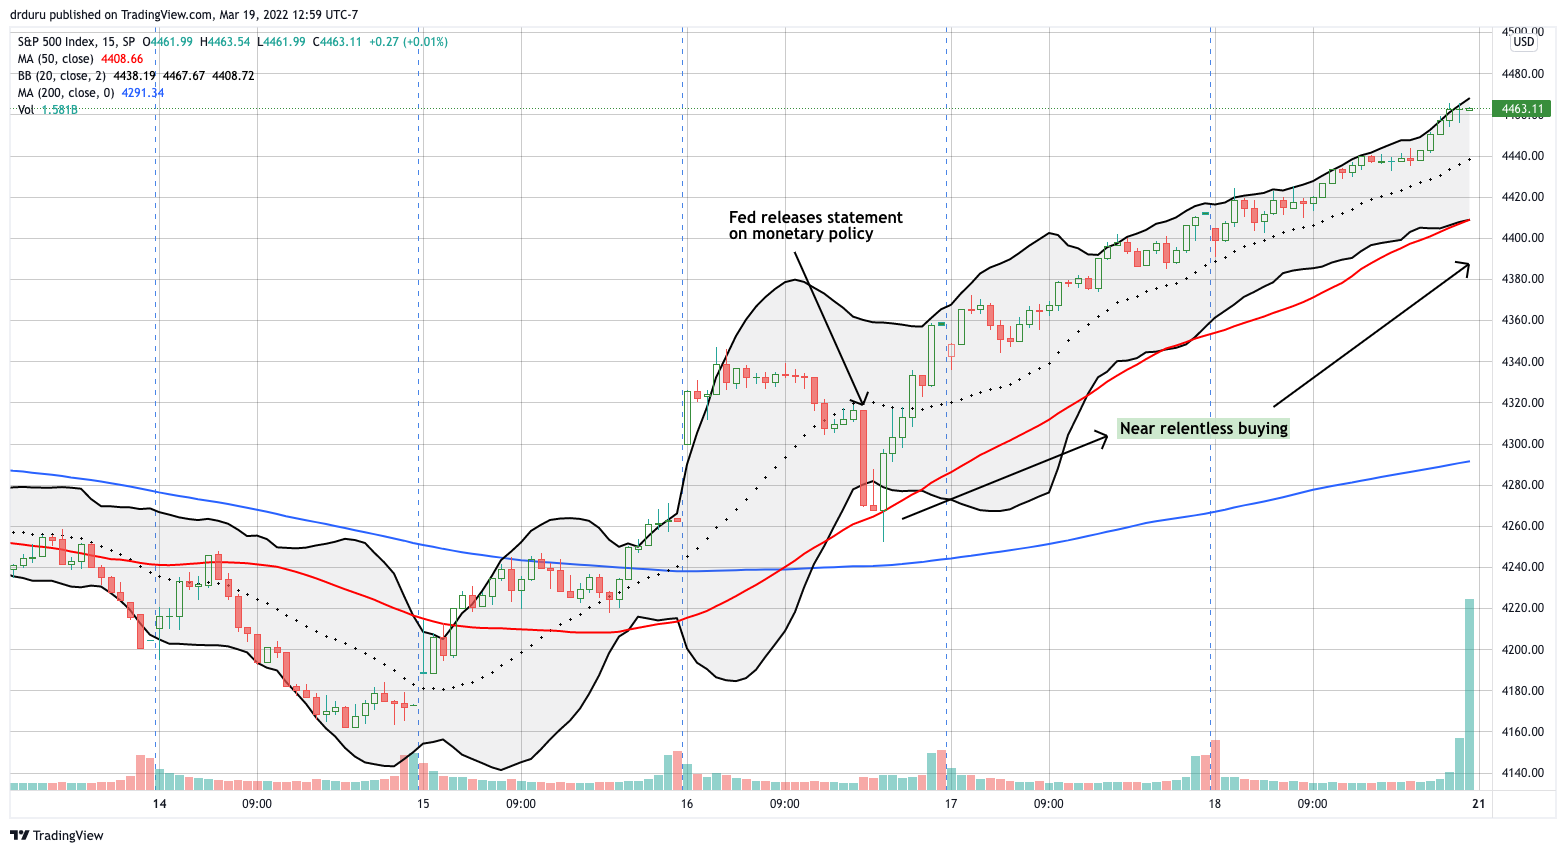
I am tempted to bring back the churn zones to guide my thinking on the stock market technicals. (As a reminder, the top of the S&P 500’s churn zone aligned with the closing low on December 1st at 4513). However, other technicals now loom larger from the 50-day moving average (DMA) (red line below) and the 200DMA. The S&P 500 (SPY) easily followed through on its 20DMA breakout with a 2-day march that sliced right through 50DMA resistance. The relentless comeback was so strong that I think only the closing trading bell prevented the index from slicing right through 200DMA resistance as well. The second chart below shows how sellers exhausted themselves in the first minutes following the release of the Fed’s latest statement on monetary policy. From there, buyers took over with their relentless comeback.
The S&P 500 gained 6.2% for the week. Friday’s 1.2% run-up providing the cherry on top.

The NASDAQ (COMPQX) quickly transformed from a bear market to an angry bull run on a relentless comeback. The tech-laden index traded nearly straight up from its picture-perfect test of the 2022 intraday low to finish with an 8.2% gain on the week. The NASDAQ closed just above downtrending 50DMA resistance. Follow-through from here will put the twin highs of February into play.
The iShares Russell 2000 ETF (IWM) did one better on the indices. While the ETF of small caps “only” gained 5.4% for the week, IWM cleared its February closing highs. IWM looks like it has a decent shot to grind its way higher toward 200DMA resistance.
Stock Market Volatility
The volatility index (VIX) broke down below another uptrend. The VIX looks ready to retest the important 20 level; 20 represents the threshold of “elevated” volatility. By the time the VIX reaches that depth, the S&P 500 in particular will be flashing very bullish signs.
The Short-Term Trading Call with A Relentless Comeback
- AT50 (MMFI) = 54.0% of stocks are trading above their respective 50-day moving averages
- AT200 (MMTH) = 39.0% of stocks are trading above their respective 200-day moving averages
- Short-term Trading Call: cautiously bullish
AT50 (MMFI), the percentage of stocks trading above their respective 50DMAs, surged to 54.0%. More importantly, my favorite technical indicator sliced through the 44-45% level that served as a cap in January and February. AT50 even closed at its highest level of the year. Since AT50 is now stretched well above its own upper Bollinger Band (BB), I fully expect the broad-based rally in the stock market to cool down. Accordingly, I toyed with downgrading my short-term trading call to neutral. In the end, I decided to wait to see whether the S&P 500 fails its test at its 200DMA. A close below the 50DMA will put me into neutral.
AT50 opened up a path to revisit overbought territory for the first time in 264 trading days. Note well how AT50’s inability to break into overbought territory in November marked an important top in the stock market. This setback happened just as the stock market experienced a bullish expansion in market breadth. As a result, I expect to downgrade at least to neutral on a return to overbought’s neighborhood.
As planned I sold my last long QQQ call spread on Thursday. The relentless comeback in the stock market did not provide a desirable opening for new positions. Accordingly, I ended up placing several refreshes near Friday’s close. I left SPY calls alone and will return after (if?) the S&P 500 breaks out above 200DMA resistance. I added what could be my last hedge for this cycle: an April/May $300/$310 put calendar spread on the iShares Expanded Tech-Software Sector ETF (IGV). IGV rallied right into its 50DMA resistance at Friday’s close.
Be careful out there!
Footnotes
“Above the 50” (AT50) uses the percentage of stocks trading above their respective 50-day moving averages (DMAs) to measure breadth in the stock market. Breadth defines the distribution of participation in a rally or sell-off. As a result, AT50 identifies extremes in market sentiment that are likely to reverse. Above the 50 is my alternative name for “MMFI” which is a symbol TradingView.com and other chart vendors use for this breadth indicator. Learn more about AT50 on my Market Breadth Resource Page. AT200, or MMTH, measures the percentage of stocks trading above their respective 200DMAs.
Active AT50 (MMFI) periods: Day #484 over 20%, Day #9 over 30%, Day #3 over 40%, Day #1 over 50% (overperiod ending 50 days under 50%), Day #84 under 60%, Day #264 under 70%
Source for charts unless otherwise noted: TradingView.com
Full disclosure: net long QQQ call spreads, long IWM call spread, long IGV put calendar spread
FOLLOW Dr. Duru’s commentary on financial markets via StockTwits, Twitter, and even Instagram!
*Charting notes: Stock prices are not adjusted for dividends. Candlestick charts use hollow bodies: open candles indicate a close higher than the open, filled candles indicate an open higher than the close.
