
Housing Market Intro and Summary
The pandemic recession ended for housing in July. August demonstrated that an all-out housing boom is underway.
I was expecting the housing data to start normalizing. Instead, demand pushed ever higher and supply tightened further.
Housing Stocks
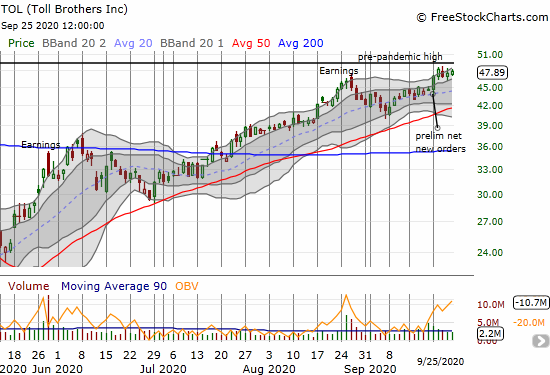
Toll Brothers (TOL) started last week with a preliminary report on net new order activity. The 110% year-over-year increase in net signed contracts stunned me into accepting that the housing market is not yet normalizing and instead in the midst of a housing boom. The South and Pacific divisions led the way with 170% and 165% year-over-year surges respectively. Toll Brothers added that “the strong demand in our third quarter has continued into mid-September of our fourth quarter throughout our twenty-four states and across our product lines and price points. We continue to raise prices to manage the pace of growth, offset rising costs, and maximize profitability.” This kind of business activity is about as bullish as it gets.
TOL responded to the news with a 5.1% gain. The stock has yet to make additional progress as overhead resistance looms from TOL’s high just ahead of the coronavirus pandemic in the U.S.
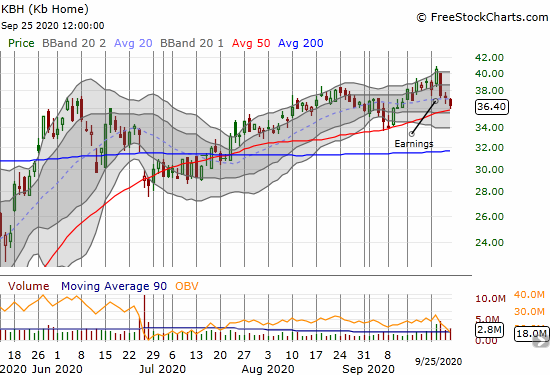
KB Home (KBH) dampened the mood last week with earnings that apparently disappointed the stock market. KBH fell 7.5% and ended the week testing support at its 50-day moving average (DMA). The headline results looked good, so I have to assume that TOL’s strong results set the bar too high for KBH. I have an outstanding task to do a complete review of KBH’s Q3 results.
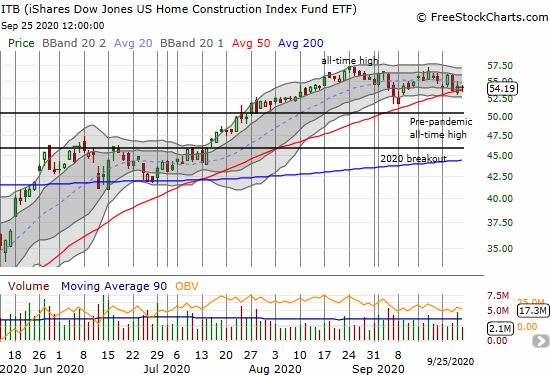
Despite all the good news about a housing boom, the iShares Dow Jones US Home Construction Index Fund ETF (ITB) made no progress over the past month. The general sell-off in the stock market in September weighed on ITB. The ETF now sits on top of important support at its 50DMA. ITB last traded below this trendline five months ago in the middle of the stock market’s sharp rebound form the March lows. I am patiently waiting until October/November to begin the seasonal trade on home builders in earnest.
Housing Data
New Residential Construction (Single-Family Housing Starts) – August, 2020
After reviewing the latest sales numbers for LGI Homes (LGIH), I prematurely concluded that the housing market was normalizing. However, in addition to the preliminary news from Toll Brothers, single-family housing starts tell a much different story. An historic housing boom continues to unfold.
August single-family home starts hit 1,021,000 which was 4.1% above July’s 981,000 starts and 12.1% above August, 2019. The July starts represent a second straight month of significant upward revisions; previously reported starts were 869,000. The rate of year-over-year change flipped positive in July for the first time since March, 2020. The continuation of these year-over-year gains is truly impressive.
Source: US. Bureau of the Census, Privately Owned Housing Starts: 1-Unit Structures [HOUST1F], first retrieved from FRED, Federal Reserve Bank of St. Louis, September 25, 2020.
For August, the Northeast was the one region that somehow managed to print a year-over-year decline in starts. This decline contrasts with robust new and existing home sales in the region and all-time high builder sentiment. The Northeast, Midwest, South, and West each changed -6.6%, +23.7%, +9.6%, +15.8% respectively. Starts in the West surged off a 13-month low but are still not yet back to the post financial crisis high set in January, 2020.
Existing Home Sales – August, 2020
Existing home sales reached a near 14-year high in August despite a continued decline in inventory and increase in prices. Even condo sales are spiking alongside single-family homes in this housing boom.
In June, existing home sales increased month-over-month for the first time since the February, 2020 peak in sales. For July, existing home sales jumped past the February peak, and August sales pushed on toward a 14-year high. The National Association of Realtors (NAR) marveled at the on-going strength. Yet, the organization still lamented the obstacles of low inventory and high prices as if sales numbers were poor: “Home sales continue to amaze…Housing demand is robust but supply is not, and this imbalance will inevitably harm affordability and hinder ownership opportunities.” These concerns did not prevent the NAR from continuing to predict stronger sales ahead: “Further gains in sales are likely for the remainder of the year, with mortgage rates hovering around 3% and with continued job recovery.”
The seasonally adjusted annualized sales in August of 6.00M were up 2.4% month-over-month from the unrevised 5.86M in existing sales for July. Year-over-year sales increased with a jump of 10.5%.
Condos led the way downward during the pandemic by plunging to levels unseen since at least 1999 (available data). Condos are playing catch-up but still lagging the overall growth in sales. While condo sales soared 31.8% from June to July, they were flat with July, 2019 sales. In August, condo sales increased 8.6% from July and 6.8% year-over-year.

(As of the March, 2018 data, the NAR further reduced historical data to just 13 months. For historical data from 1999 to 2014, click here. For historical data from 2014 to 2018, click here) Source for chart: National Association of Realtors, Existing Home Sales© [EXHOSLUSM495S], retrieved from FRED, Federal Reserve Bank of St. Louis, September 26, 2020.

The absolute inventory levels of 1.49M homes dropped slightly from June by 0.7%. Inventory plunged 18.6% from a year ago (compare to July’s 21.1%, June’s 18.2%, May’s 18.8%, April’s 19.7%, March’s 10.2%, February’s 9.8%, January’s 10.7% and December’s 8.5% year-over-year declines, unrevised). “Unsold inventory sits at a 3.0-month supply at the current sales pace, down from 3.1 months in July and down from the 4.0-month figure recorded in August 2019.” The on-going year-over-year decline in inventory is now on a 15-month streak. The tightening constraint on supply will help prices continue to climb.
The median price of an existing home hit a new record of $310,600, a year-over-year surge of 11.4% and the 102nd straight month of a year-over-year gain. The median price jumped from July by 2.4%. The price pressures during the recession are driving the price per square feet higher. Note that price per square feet slowly declined during the second half of 2019.
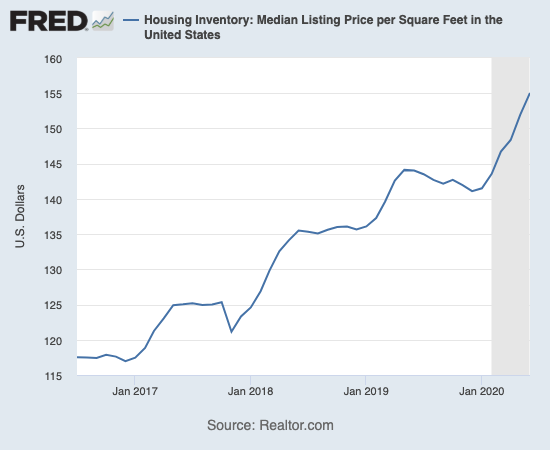
Source for chart: Realtor.com, Housing Inventory: Median Listing Price per Square Feet in the United States [MEDLISPRIPERSQUFEEUS], retrieved from FRED, Federal Reserve Bank of St. Louis; September 26, 2020.
First-timer home buyers took a 33% share of sales in August. This share has little changed since March in a bit of a contrast with the narrative of millennials driving the surge in home sales during the pandemic. The NAR’s 2017 Profile of Home Buyers and Sellers reported an average of 34% for 2017, 33% for 2018, and 33% for 2019.
Investors stepped into the breach in May by increasing from April’s 10% share of sales to 14%. This share plunged down to 9% in June which seemed to be a seasonal pattern. Investors freshly rushed into the market by grabbing a 15% share of sales in July and stayed steady at 14% in August. I keep waiting to see this investor share drive much higher as a way to explain the housing boom despite the poor economic environment.
The Northeast joined the other three regions with year-over-year gains in sales, but it still lags. In August, the regional year-over-year changes were: Northeast +5.7%, Midwest +9.3%, South +13.0%, West +9.6%.
From September, 2019 through April, 2020, all regions experienced notable and robust price jumps. In May, the West finally broke that streak with a rare price pullback. The regions all lined up for solid gains in June, greater gains in July, and continued gains in August. Here are the August regional year-over-year changes in median home prices: Northeast +10.4%, Midwest +10.7%, South +12.3%, West +11.8%.
Single-family home sales increased 1.7% from July and increased on a yearly basis by 11.0%. The small sequential gain could signal a normalization in the market for existing homes. Compare this small gain to the large 23.9% monthly gain in July. The median price of $315,00 was up 11.7% year-over-year and up significantly from June’s $307,800.
California Existing Home Sales – August, 2020
The report from the California Association of Realtors (C.AR.) revealed some startling records and extremes in California in July. August was another month of notable milestones. Demand was extremely strong and supply plummeted to new depths as additional highlights for this housing boom.
In May, California suffered an historic drop in sales of existing single-family homes. The 238,740 annualized existing homes sold was the lowest total since at least March, 2008. June delivered a rebound for the record books as sales increased 42.4% for the largest month-over-month gain since the C.A.R. started collecting records almost 40 years ago. July sales jumped to a 2 1/2 year high. August sales increased 6.3% from July to 465,400, a 14.6% year-over-year gain. These three consecutive monthly gains constitute the first such streak since 2016.
A further shift in mix toward more expensive homes sent the median price up 6.1% from July, just off the 6.5% monthly record set in July. The median price surged 14.5% year-over-year which was the largest since March, 2014. For three straight months, the median price has hit all-time highs. These large shifts in mix run contrary to the push of home builders toward more affordable offerings and is consistent with the soaring expense of buying an existing home across the U.S.
The Californian housing boom sent inventory plunging further as sellers remain as reluctant as ever to post listings. Active listings plunged 50.3% year-over-year in August which exceeded the 43% year-over-year drop in June and 48% in July. July’s drop was the largest year-over-year decline since 2013. August’s decline was the largest since 2008. Every region in California suffered at least a 37% drop in active listings. The drop in active listings contradicts C.A.R.’s monthly Google poll that showed consumers are growing ever more positive about selling: “…58 percent of consumers said it is a good time to sell, up from 54 percent a month ago, and up from 46 percent a year ago.” Clearly, not enough of these consumers are home owners!
Inventory was 4.3 months of supply in May. June’s supply dropped to 2.7 months, and July’s dropped even further to 2.1 months. August’s supply held steady with July, but was still significantly down year-over-year from the 3.2 in August, 2019. Inventory was lowest in resort communities.
New Residential Sales (Single-Family) – August, 2020
New home sales took me aback in June. For July, the data startled me. August just left me speechless. The market for new homes continues to soar to new heights, another element of a housing boom in the middle of pandemic hangover for the larger economy.
July new home sales hit a 13 1/2 year high. August new home sales hit a 14-year high. Pent-up demand from years of lower than normal sales activity is suddenly uncorking. Who could have guessed even a year ago that lower rates and a perceived need to rush for the suburbs would be such momentous driving factors?
The 1,011,000 in annualized new home sales jumped 4.8% from July’s upwardly revised 965K (significantly up from 901K) sales. Year-over-year sales skyrocketed 43.2%. Year-over-year sales changes were last this strong in January, 1992.
Source: US. Bureau of the Census, New One Family Houses Sold: United States [HSN1F], first retrieved from FRED, Federal Reserve Bank of St. Louis, September 26, 2020.
Median home prices have hit an extended period of stabilization, largely thanks to the rush for lower-priced homes. The median price hit a peak in November, 2017 at $343,400. Since then, it hit a low of $305,400 in January, 2019. In August, the median price dropped 4.6% from July and dropped 4.3% year-over-year. This price range is an interesting contrast to the relentless ascent in price for existing homes. I am now assuming new home prices are mostly stable because builders have been shrinking the footprint of their homes to create the appearance of affordability. Indeed, the median square footage of housing starts peaked in 2015. The size of new housing starts is down to a 10-year low.
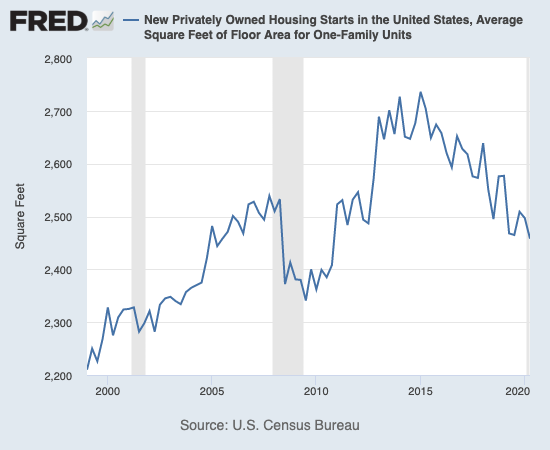
Source for chart: U.S. Census Bureau and U.S. Department of Housing and Urban Development, New Privately Owned Housing Starts in the United States, Average Square Feet of Floor Area for One-Family Units [HOUSTSFLAA1FQ], retrieved from FRED, Federal Reserve Bank of St. Louis; September 27, 2020.
Home builders talk a lot about driving sales at more affordable price points yet the shift from May to June was mostly about homes at higher price points. Homes priced from $150,000 to $199,999 plunged in share from 11% to 6% while all homes priced $400,000 and above increased in share. The script flipped in July as the $400-499K price range plunged in share from 19% to 12%. The $200 to 299K range was the only other price band that decreased. For August, a bi-modal shape took hold where the $300,000-$399,999 price range hollowed out and the two adjacent price ranges surged in market share.
The monthly inventory of new homes continued its decline from a peak in April at 6.1 months of sales. That inventory plunged to 4.8 in May and now sits at 3.4. It is surprising to see that this inventory squeeze has not translated to a higher median home price even with the shift to cheaper homes in various regions and from expensive to cheaper regions.
July year-over-year sales in the Northeast “cooled down” from a 111.5% growth rate to 25.0% (unrevised). In August, the growth rate nudged a little higher to 27.3%. The Midwest jumped 54.7%. The South accelerated from recent months with a 50.0% growth rate in August. The West cooled down from recent high levels of growth to 26.5% in August.
Home Builder Confidence: The Housing Market Index – September, 2020
The National Association of Home Builders (NAHB) reported another historic NAHB/Wells Fargo Housing Market Index (HMI). In August, the HMI hit an all-time record of 78 which tied the HMI from December, 1998. For September, the HMI hit an uncontested record of 83. All three components of the HMI hit all-time highs as well. The HMI went from an 8-year low to an all-time high in just 5 months. This swift move from collapse to all-out housing boom is truly astounding.
Builders are more optimistic than ever and soaring lumber prices are not dampening the mood. The NAHB warned that “lumber prices are now up more than 170% since mid-April, adding more than $16,000 to the price of a typical new single-family home…” Given the current price and sizing trends, I expect builders to continue adjusting homes smaller and building on cheaper plots of land to accommodate the higher lumber prices. Strong housing demand means consumers will be quite willing to buy wherever they can find the inventory.
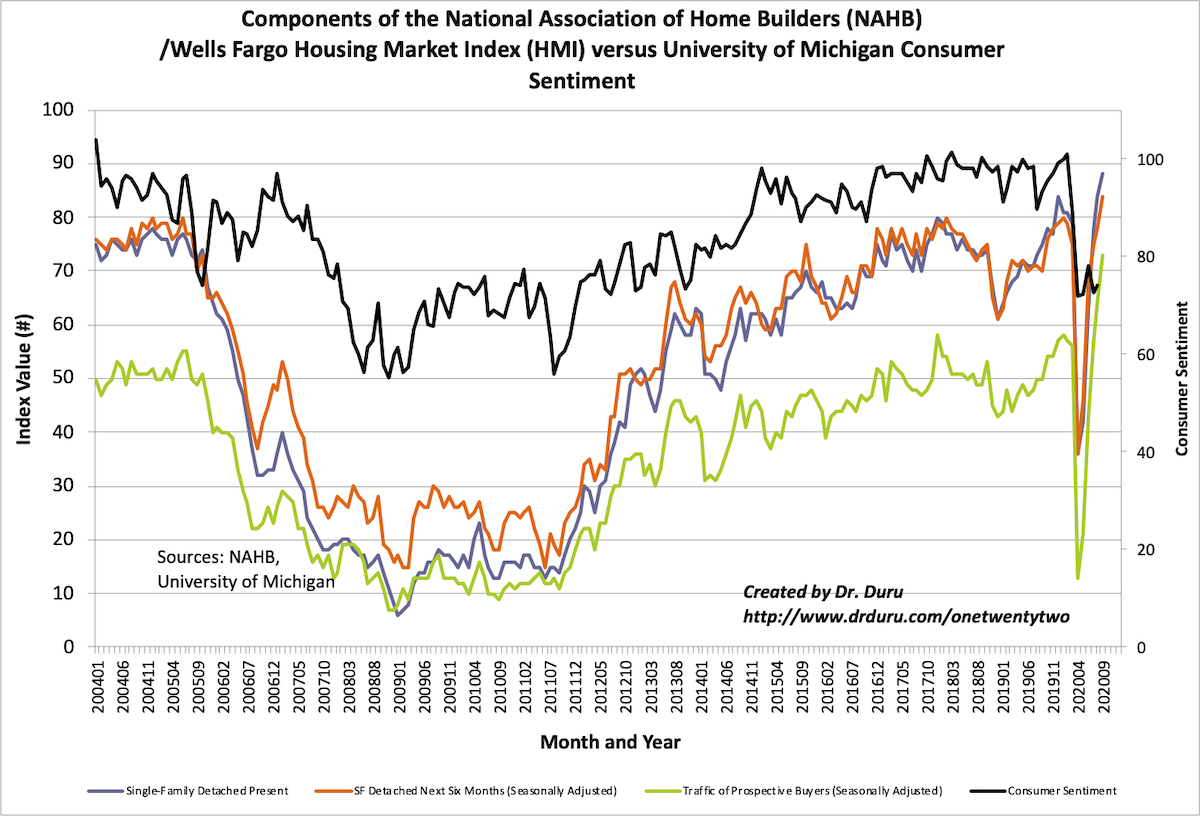
Source: NAHB
Builder optimism pushed sentiment to all-time highs except in the West. The West’s high of 91 from October, 2004 represents the heights of a housing mania and bubble. In September, the West’s HMI hit 87. These levels are particularly impressive given the fires raging through so much of the western United States.
Home closing thoughts
A Rethink for American Housing
Time-to-time in these housing market reviews, I reference the inequities in the housing market. The divergence in fortunes are becoming particularly acute with a housing boom in the middle of a deep recession. Employees with jobs, working-from-home are able to confidently shop from their computers while the millions of newly unemployed are burdened with concerns about making rent or mortgages when forbearance programs end. This divide will likely have lasting consequences for American society for years to come.
Public broadcaster KQED launched a podcast on this topic called Sold Out: Rethinking Housing in America. The 5-part series covers inequities across the country and looks for ways housing prosperity can be shared more broadly.
The Island of San Francisco
The California Association of Realtors reported that San Francisco and San Mateo were the only counties in California which experienced a year-over-year increase in listings. San Francisco listings soared 45.5% while San Mateo had a very modest 2.9% increase, both stark contrasts to the plunge in listings reported across the rest of California. The impact in San Francisco is clear: fewer bids per listing, longer listing times, and lower prices.
In “San Francisco housing has cooled as some flee the city, but demand is still there”, CNBC reported the following key points for August about the country’s second most expensive housing market in San Francisco:
- Home listings hit a 4-year high at 1,483.
- The median listing price dropped to an 18-month low going below $1.4M.
- Inventory is at a 6 or 7 year high.
The article interviewed households whose prior plans to eventually leave San Francisco accelerated thanks to the coronavirus pandemic.
Be careful out there!
Full disclosure: long TOL calendar spread