
AT40 = 43.8% of stocks are trading above their respective 40-day moving averages (DMAs)
AT200 = 47.4% of stocks are trading above their respective 200DMAs
VIX = 16.4
Short-term Trading Call: neutral
Stock Market Commentary
Over the weekend, I wrote about a “constructive stock market” as a reference to the stock market’s consistently positive responses to U.S. vs China trade war headlines pronouncing progress or positive commentary from government officials. A standard line from these officials describes negotiations as “constructive” which the market laps right up.
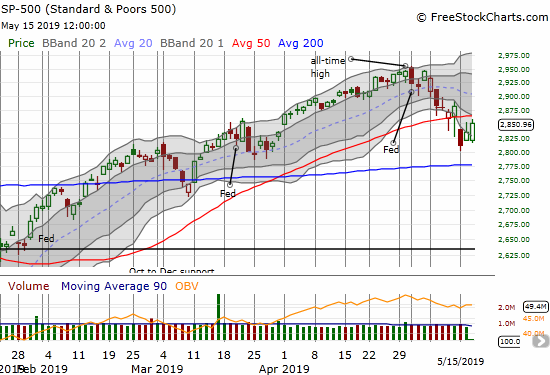
The stock market also looked constructive on Friday as the major indices rebounded off intraday lows two days in a row and held critical 50DMA support lines. Monday’s sell-off turned the construction into a sink hole which flipped bullish setups into bearish breakdowns (aka bull traps). The S&P 500 (SPY) flipped from bullish run-ups from intraday lows to a large gap down and close well below its lower Bollinger Band (BB).
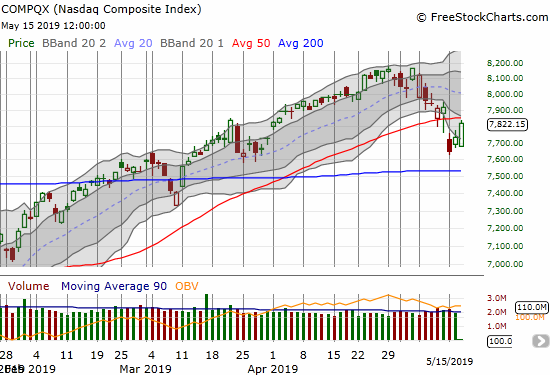
The NASDAQ (NDX) flipped similarly to the S&P 500, but its rally on Wednesday makes the index look a little more prepared for a breakout.
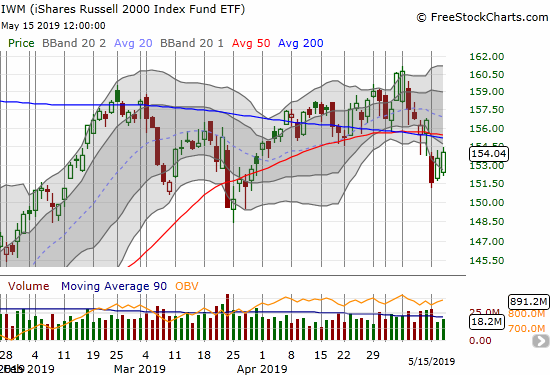
The iShares Russell 2000 ETF (IWM) also flipped. IWM’s situation is a little more precarious given the downtrending 200DMA and a 50DMA that is now turning downward. On Monday I added to my IWM call options in case of a strong rally to close out the week despite the formidable-looking overhead resistance.
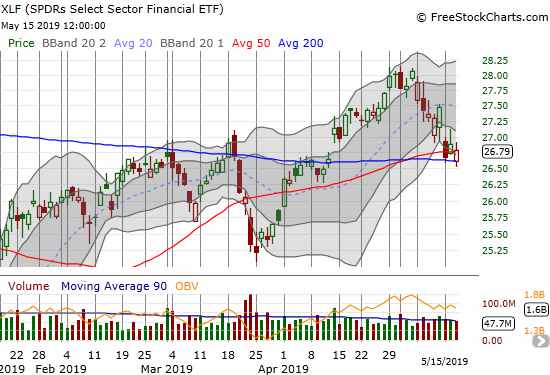
The Financial Select Sector SPDR ETF (XLF) is doing its own dance around its 50 and 200DMAs. I added to my June XLF call options in an on-going expectation that the financials have another rally pending.
The volatility index (VIX) imploded after Monday’s surge delivered the highest close in 4 months. I used the surge as another opportunity to buy a put option on Ultra VIX Short-Term Futures ETF (UVXY) to protect profits in my UVXY call spread. That spread finally sold at my target profit level in today’s trading. With UVXY closing at its lows of the day, I bought call options (no more spreads!) in case the VIX still has at least one more surge left.
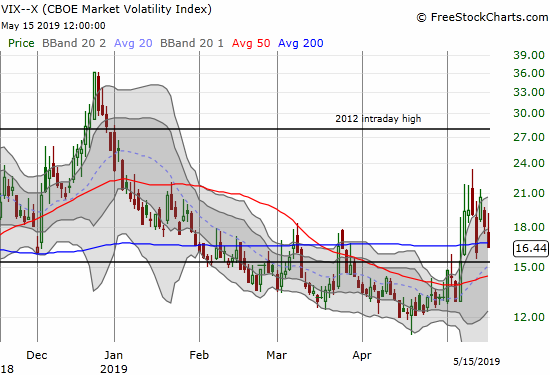
AT40 (T2108), the percentage of stocks trading above their respective 40DMAs, closed on Monday at a 4-month low and traded as low as 32.9%. Such a downward plunge makes a lot of stocks look “oversold” to bargain hunters. The subsequent two days of buying are not surprising in that context. Still, the buying looks tepid and AT40 only closed at 43.8% today.
The Hedges
If the rush of institutional funds is any indication, market fears peaked with Monday’s jump in the VIX and the drop in AT40. According to Reuters reporting:
Global investors’ equity allocations fell 6 percentage points in May and over a third of fund managers have taken out protection against sharp stock market falls in coming months, Bank of America Merrill Lynch’s latest monthly survey found on Tuesday…The proportion of investors preparing for equity falls is the highest in the survey’s history…
Extremes of fear are rarely sustainable in financial markets. They are more indicative of bottoms than tops. They create the foundations of buying opportunities. However, given the S&P 500 is barely off its all-time highs and in the middle of a 50DMA breakdown, I think this extreme in fear will lead to some kind of stalemate: the hedges reduce the need to sell while at the same time fear dampens buying interest.
The Bearish Divergence
Bearish divergence steepened this week. The Australian dollar versus the Japanese yen (AUD/JPY) continues to tumble. I expected AUD/JPY to trade into levels last seen during the January flash crash, but I expected the move to drag the stock market down with it. The current bearish divergence balances out my sense that market fears have peaked with the institutional hedging. In between, I have to assume then that wild, abrupt, and short-lived swings lie ahead.
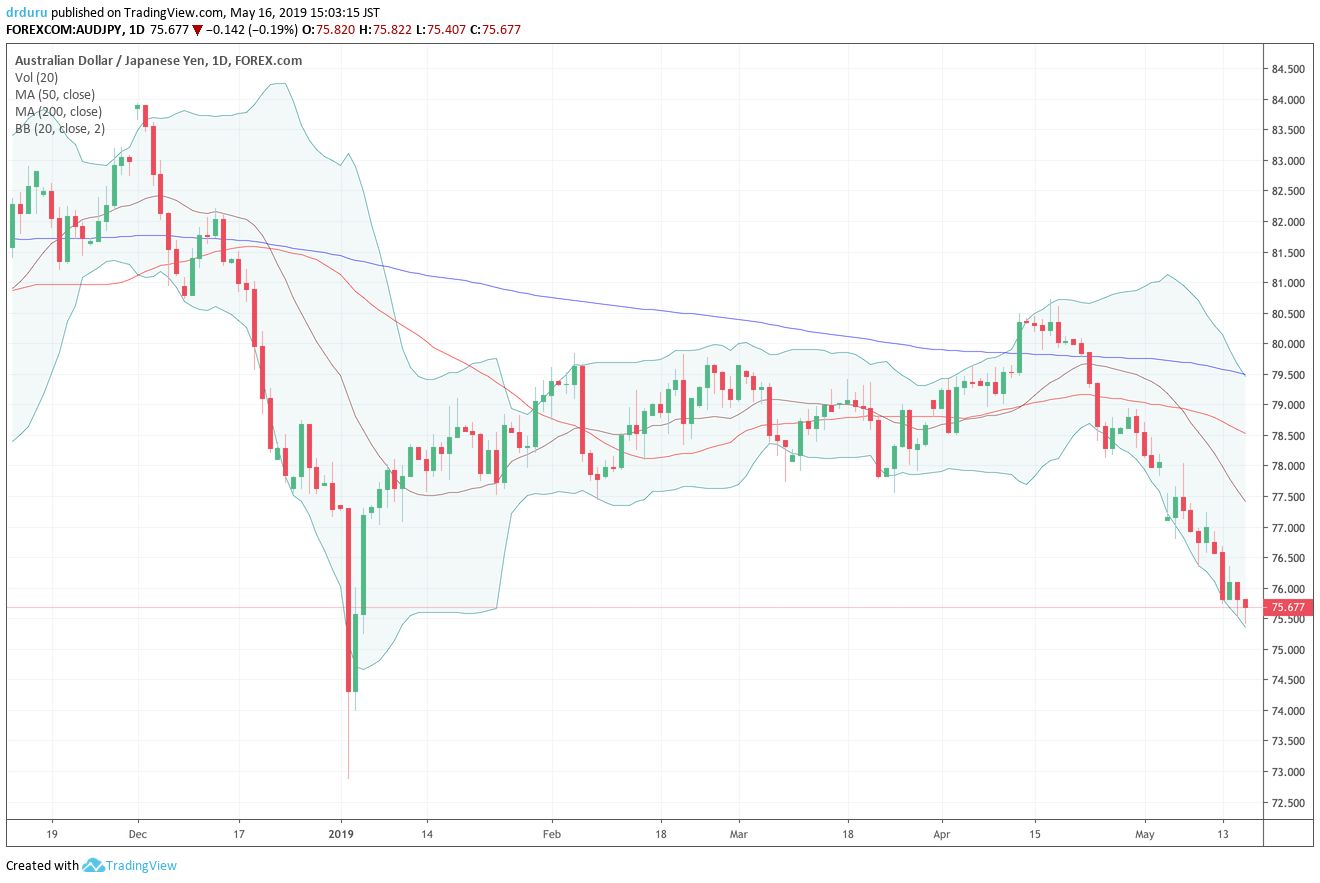
Source: TradingView
The Trade War
The macro-economic numbers are reportedly showing little to no impact from the U.S. – China trade war. Yet, individual companies and regions do seem to suffer, sometimes tremendously. Marketplace is channeling these stories. Today’s story from Spartanburg, South Carolina is a representative.
In the following interview, David Britt, a member of the Spartanburg County Council, rattled off a series of numbers demonstrating the economic damage being done by the trade war. Britt called out the way uncertainty has stalled investment and called Trump’s trade war “a game of Russian roulette.” Britt claims the tariffs are “drawing out the oxygen” from the economies of the Southeast.
Next up is one more reminder from Hu Xijin, the Editor-in-chief of Chinese and English editions of the Global Times, that China has little interest in rolling over in this fight. Indeed, China appears quite motivated to try to turn this fight into a losing lesson for the U.S.
No wonder institutional money is rushing to protect its portfolios!
Stock Chart Reviews – Bearish
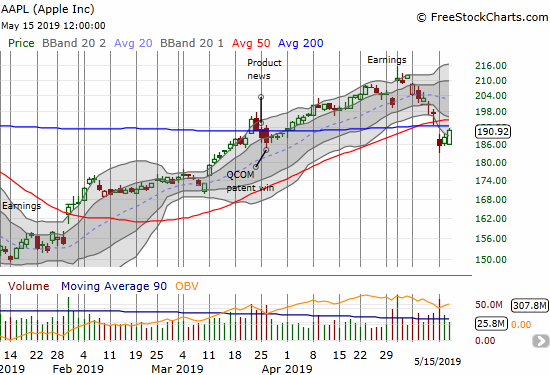
Apple (AAPL)
When I lined up bearish bets on Friday, I did not think to load up on put options on Apple (AAPL). AAPL is near or at the epicenter of negative trade headlines, so I should have toned down my weekly call option trade. Monday’s gap down wiped out the call options with a quickness. Now AAPL is in a bearish position struggling with the fallout from a 200DMA breakdown.
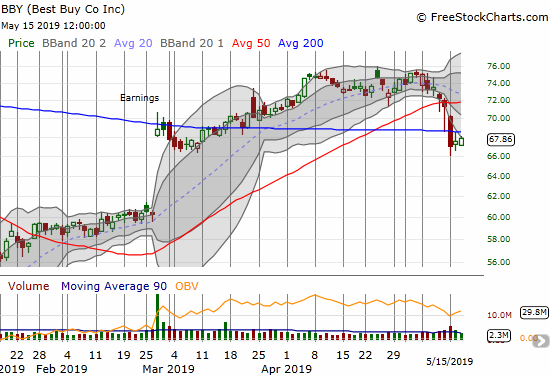
Best Buy (BBY)
My put options in Best Buy (BBY) came in very handy on Monday as the stock quickly plunged into a steep breakdown. I took profits into the selling. BBY is now contending with 200DMA resistance.
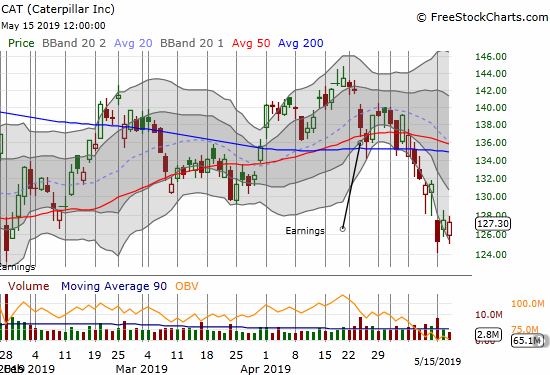
Caterpillar (CAT)
I did not have put options ready in Caterpillar (CAT) on Monday morning. I was expecting to get a chance to reload on a rally back into 50/200DMA resistance. I bought put options on Tuesday’s gap up and rebound.
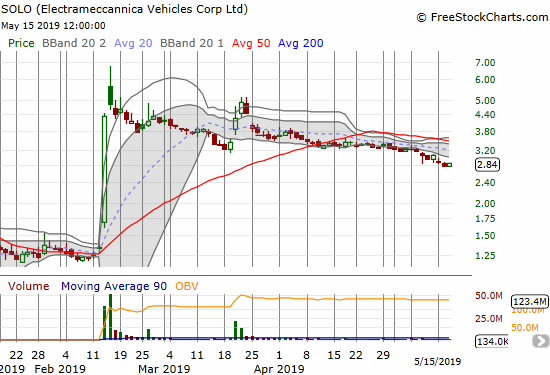
Electrameccannica Vehicles (SOLO)
I am ready to take my lumps and give up on Electrameccannica Vehicles (SOLO). I should have sold into the March rally. Since then, the stock has just drifted lower in search of a fresh catalyst. The stock now looks destined to reverse its entire February surge. I do not want to be around for that milestone. After I sell, I am not looking for a new entry point.
Stock Chart Reviews – Bullish
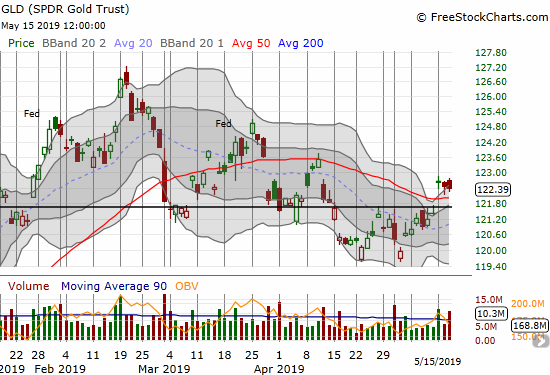
SPDR Gold Trust (GLD)
The SPDR Gold Trust (GLD) has severely underperformed relative to my expectations since the February peak. The market volatility helped to push GLD above its 50DMA once again. I still have a $124/127 GLD call spread, but it expires on Friday. I am preparing to reload if support holds going into the end of the week.
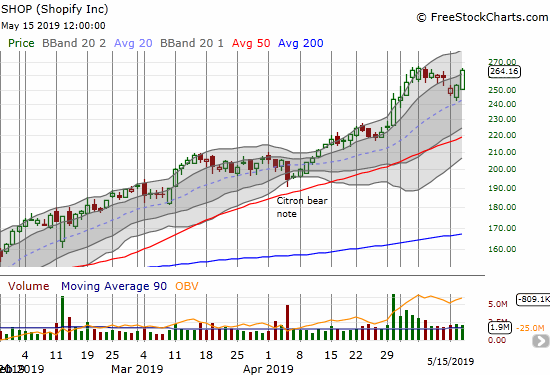
Shopify (SHOP)
Shopify (SHOP) is on a tremendous rally this year. The stock is in near constant accumulation mode. The last dip looks like the pause that refreshes on the way to new all-time highs.
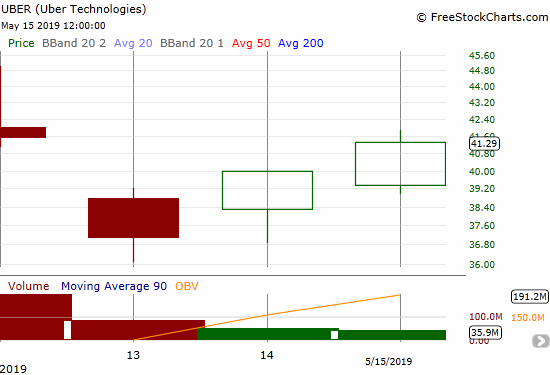
Uber (UBER)
Right after I posted thoughts on how to pick a spot for buying Uber (UBER) shares, the stock pushed right through the bullish trigger. I was reluctant to dive in because I was looking for a longer-term setup. A friend who acted ahead of the bullish setup convinced me to join him. I am targeting the $45 IPO price.
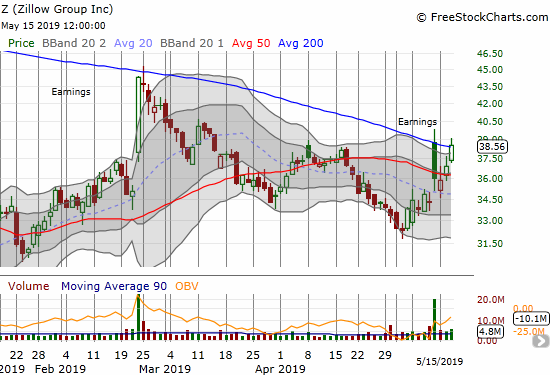
Zillow Group (Z)
Zillow Group (Z) flipped from a bearish post-earnings gap and crap to a fresh 200DMA breakout. On Monday, the stock essentially finished reversing the post-earnings gains and buyers took over from there.
— – —
FOLLOW Dr. Duru’s commentary on financial markets via email, StockTwits, Twitter, and even Instagram!
“Above the 40” uses the percentage of stocks trading above their respective 40-day moving averages (DMAs) to assess the technical health of the stock market and to identify extremes in market sentiment that are likely to reverse. Abbreviated as AT40, Above the 40 is an alternative label for “T2108” which was created by Worden. Learn more about T2108 on my T2108 Resource Page. AT200, or T2107, measures the percentage of stocks trading above their respective 200DMAs.
Active AT40 (T2108) periods: Day #88 over 20%, Day #89 over 30%, Day #2 over 40% (82-day 40% overperiod ended 5/13/19), Day #7 under 50% (underperiod), Day #7 under 60%, Day #50 under 70%
Daily AT40 (T2108)
")
Black line: AT40 (T2108) (% measured on the right)
Red line: Overbought threshold (70%); Blue line: Oversold threshold (20%)
Weekly AT40 (T2108)

*All charts created using FreeStockCharts unless otherwise stated
The T2108 charts above are my LATEST updates independent of the date of this given AT40 post. For my latest AT40 post click here.
Related links:
The AT40 (T2108) Resource Page
You can follow real-time T2108 commentary on twitter using the #T2108 or #AT40 hashtags. T2108-related trades and other trades are occasionally posted on twitter using the #120trade hashtag.
Be careful out there!
Full disclosure: long UVXY calls and put, long IWM calls, long AUD/JPY (as a hedge), long SOLO, long GLD shares and call spread, long CAT puts, long UBER
*Charting notes: FreeStockCharts stock prices are not adjusted for dividends. TradingView.com charts for currencies use Tokyo time as the start of the forex trading day. FreeStockCharts currency charts are based on Eastern U.S. time to define the trading day.
Dr. Duru, I am a member of your email list. I have been reading each post now for a couple of months. I get tired reading opinions and senseless commentary which are typical fueled by fear and assumptions. Your analysis is a breath of fresh air in a sea of nonsensical jibber jabber. Thank you so much for the work that you do, and I look forward to reading more!
-Robert
Thanks, Robert, for joining the list and and checking in! It’s always good to hear from readers. Keeps me motivated to share my thoughts. 🙂