
AT40 = 19.3% of stocks are trading above their respective 40-day moving averages (DMAs) – 1st day of oversold period following 4-day oversold period
AT200 = 37.7% of stocks are trading above their respective 200DMAs (up 6 percentage points)
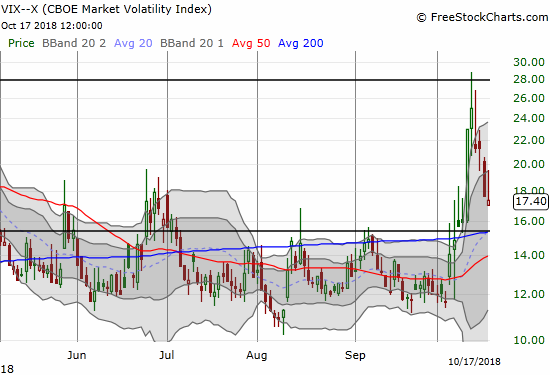
VIX = 17.4
Short-term Trading Call: bullish
Commentary
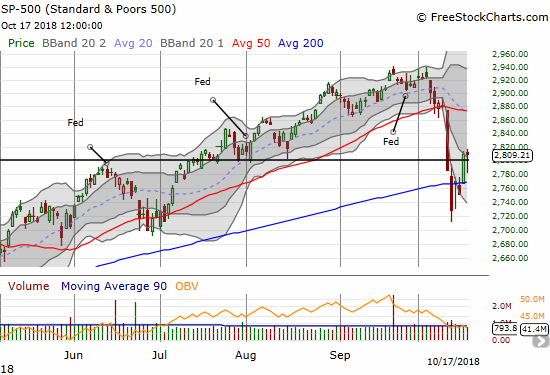
The stock market was unable to follow-through from the previous day’s big burst out of oversold territory. AT40 (T2108), the percentage of stocks trading above their respective 40DMAs, closed slightly lower and below the 20% oversold threshold. While I have to reset the clock to count down a new oversold period, this drop was so slight that it looks like noise. In fact, the more important technical event was the ability of buyers to rally the market well off its intraday lows. THIS move looks like a continuation of a transition of market power back to buyers.
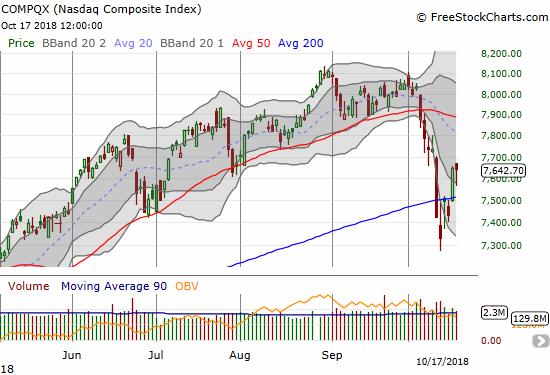
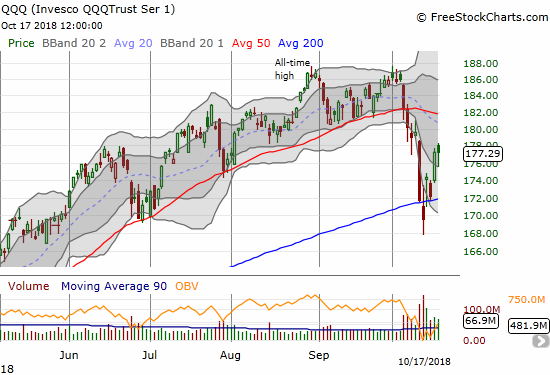
The S&P 500 (SPY) closed essentially flat after trading down as much as 1.0%. The NASDAQ and the Invesco QQQ Trust (QQQ) did nearly the same.
The volatility index, the VIX, closed slightly down and faded well off its intraday high. The VIX now looks poised to drop below the 15.35 pivot after failing near perfectly under the 20 “elevated” level.
Since I am in accumulation mode (buy the dips specifically), I automatically placed a fresh order for SPY call options. Unlike Monday’s fortuitous execution, I did not get a fill this time. I failed to adjust my order and thus failed to profit from the bullish rebound. Time is also running out on my ProShares Ultra VIX Short-Term Futures (UVXY) put options. The VIX is down 39.7% from its intraday high and down 30.3% from its closing high during this fear cycle; yet, I will likely end up with a loss trying to ride this fade. I clearly need to continue working on execution of the volatility fade. I will likely need to extend duration and choose higher strikes for the next fade of a VIX pop.
CHART REVIEWS
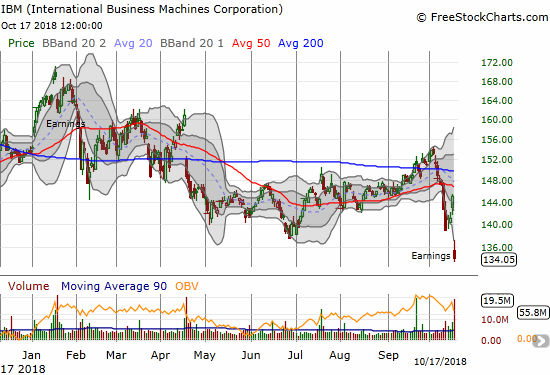
International Business Machines (IBM)
IBM provided another reminder of the significant single-stock risk this earnings season that makes pre-earnings speculative longs unattractive even during an oversold period. Sellers sent IBM plunging to a stomach-churning 31-month low.
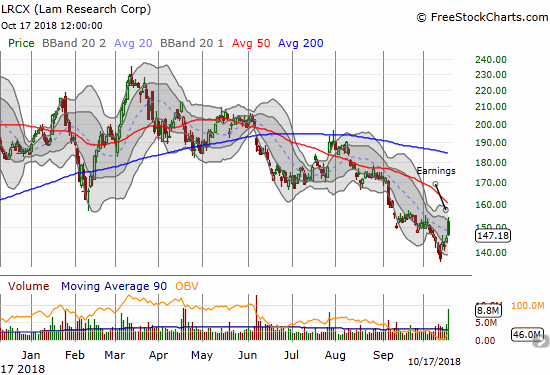
Lam Research Corporation (LRCX)
The semiconductor sector held its breath for LRCX’s earnings report. The company delivered with strong headline earnings. After buyers celebrated with an initial gap up, sellers got back to work fading the stock. With a close under the steep 20DMA downtrend, the health of the semis remains highly in doubt here. (Speaking of which, the oversold period sent my between earnings play on Intel (INTC) up in smoke!)
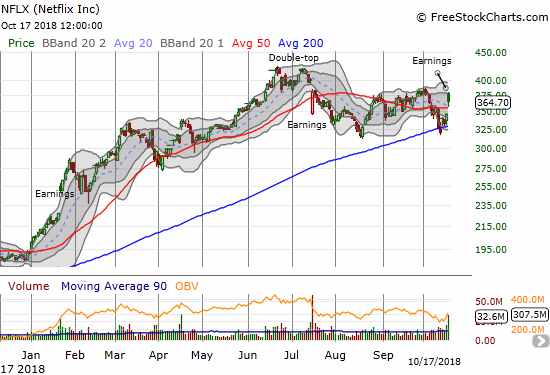
Netflix (NFLX)
In my previous Above the 40 post, I held out NFLX as a potential sign of hope coming out of the previous oversold period: “Assuming Netflix (NFLX) can hold its monster after hours post-earnings gains from Tuesday night, the stock will add one more signal that breaks the selling spell with a confirmation of 200DMA support.” NFLX failed to hold its large gains and ended up with less than half of the gains from the after hours surge. More importantly, NFLX failed at resistance formed at the previous high. This failure means the double top holds firm for NFLX. Still, NFLX’s 50DMA breakout held and confirmed a bottom at its 200DMA. So, I went ahead and took advantage of the dip to play for potential residual upside from the positive post-earnings response. I bought a calendar spread with the short side expiring this Friday and a strike right at the resistance level of $380.
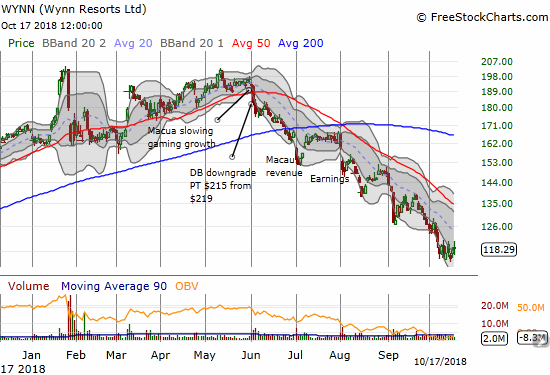
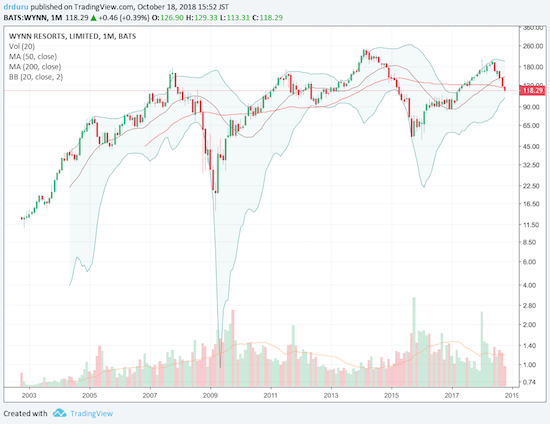
Wynn Resorts (WYNN)
While compiling a list of potential buys for this oversold period, WYNN came to mind. I had not looked at the chart for several weeks and it was almost 4 months ago when I last wrote about the stock. At the time I expressed surprise that investors latched on so quickly to a bullish M&A narrative in the wake of Steve Wynn’s exit from the scene. WYNN was just breaking down below its 200DMA. I guessed “what ails China, also ails WYNN.” THAT narrative has had a lot of staying power. WYNN is now down a whopping 40.6% from its 2018 and all-time high. The downtrend is so steep right now, I cannot even imagine an entry point yet.
— – —
FOLLOW Dr. Duru’s commentary on financial markets via email, StockTwits, Twitter, and even Instagram!
“Above the 40” uses the percentage of stocks trading above their respective 40-day moving averages (DMAs) to assess the technical health of the stock market and to identify extremes in market sentiment that are likely to reverse. Abbreviated as AT40, Above the 40 is an alternative label for “T2108” which was created by Worden. Learn more about T2108 on my T2108 Resource Page. AT200, or T2107, measures the percentage of stocks trading above their respective 200DMAs.
Active AT40 (T2108) periods: Day #1 below 20% (1st oversold day, ending 1 day over 20%), Day #6 under 30%, Day #13 under 40%, Day #18 under 50%, Day #34 under 60%, Day #87 under 70%
Daily AT40 (T2108)
")
Black line: AT40 (T2108) (% measured on the right)
Red line: Overbought threshold (70%); Blue line: Oversold threshold (20%)
Weekly AT40 (T2108)

*All charts created using freestockcharts.com unless otherwise stated
The charts above are my LATEST updates independent of the date of this given AT40 post. For my latest AT40 post click here.
Related links:
The AT40 (T2108) Resource Page
You can follow real-time T2108 commentary on twitter using the #T2108 or #AT40 hashtags. T2108-related trades and other trades are occasionally posted on twitter using the #120trade hashtag.
Be careful out there!
Full disclosure: long UVXY puts, long NFLX calendar call spread
*Charting notes: FreeStockCharts.com stock prices are not adjusted for dividends. TradingView.com charts for currencies use Tokyo time as the start of the forex trading day. FreeStockCharts.com currency charts are based on Eastern U.S. time to define the trading day.