
AT40 = 71.1% of stocks are trading above their respective 40-day moving averages (DMAs) (first overbought day)
AT200 = 57.9% of stocks are trading above their respective 200DMAs (a 4-month high)
VIX = 12.4
Short-term Trading Call: bullish
Commentary
After 92 trading days, the stock market is finally overbought again.
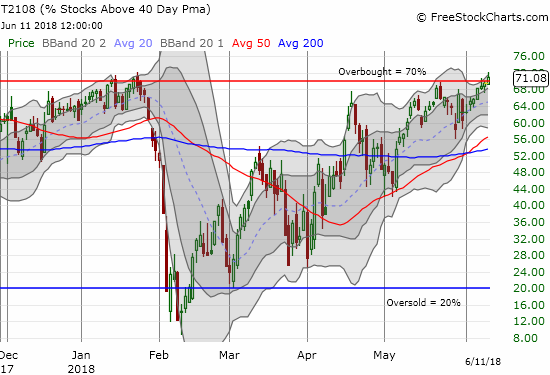
The last overbought period ended very poorly as it gave way to the February swoon, so this achievement is both good news and bad news. This time around, the overbought period could sustain an extended overbought rally because the stock market comes to this juncture with very divergent performances. Going into the last overbought period, the entire global financial system seemed like it was synchronized and locked into bullishness. Not this time; upside opportunities abound for playing catch-up.
By rule, the flip into an overbought period flips me to bullish (from neutral). This is a market full of churn, so I am fully aware of the downside potential and getting forced to downgrade. The formula for switching to bearish after the end of an overbought period changes based on the context. Given the amount of swirling catalysts, I will be quick to flip to bearish if AT40 closes below 65% AND the S&P 500 (SPY) closes below its upper-Bollinger Band uptrend channel. A blow-off topping pattern in the middle of an overbought period is an automatic trigger to flip bearish.
The S&P 500 hid the overbought milestone well. The index only gained 0.1% and faded from its high of the day. Not a good start!
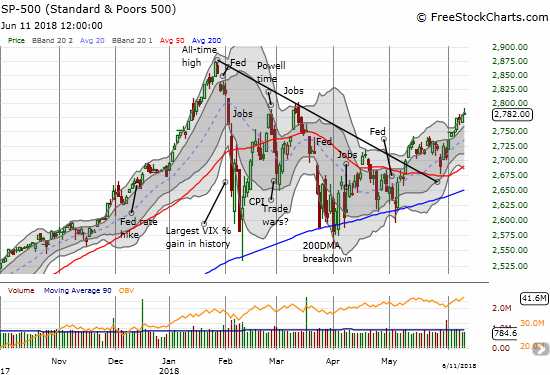
The volatility index, the VIX, refused to cooperate by actually gaining 1.4% on the day. I am not surprised that the VIX is staying aloft given all the political, macro, and monetary events of this week. In fact, I am more surprised the VIX is not much higher as a result. I bet on volatility spike going into and/or post the Fed, but the market currently looks extremely comfortable with all the uncertainties. As a reminder, this low VIX means that buying protection (put options) is very cheap.
With complacency running high, the environment is ripe for bottom-fishing and playing catch-up with the stock market with more speculative names. Some of the charts below show this scramble is well underway. They provide evidence that the stock market may be ready to sustain this overbought period even while the S&P 500 did not deliver a ringing endorsement.
CHART REVIEWS
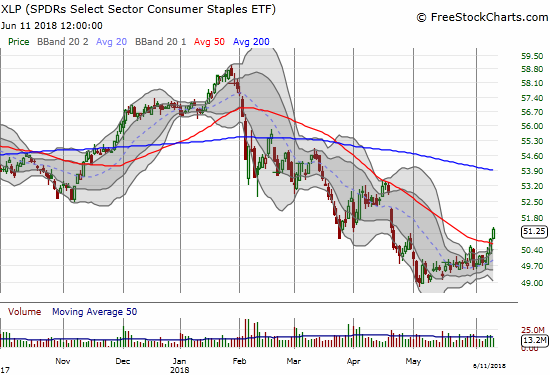
Consumer Staples Select Sector SPDR ETF (XLP)
Consumer staples failed to participate in the market’s recovery attempts from the February swoon. Fortunes started to change ever so subtly in May with XLP making a bottom and then grinding ever so slowly higher. XLP finally broke resistance at its 50DMA on Friday and buyers followed-through today in convincing fashion. XLP should be a good place to check on the health of the overbought period. It is catch-up time.
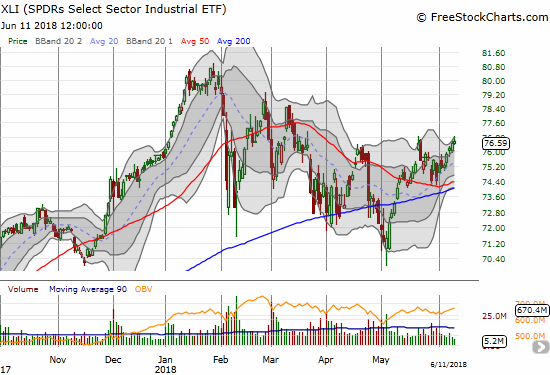
Industrial Select Sector SPDR ETF (XLI)
The stock market rally has also left behind industrials. XLI is doing better than XLP, but the index still has two other points of resistance from prior highs before it can challenge its all-time high from February. Today’s 3-month closing high marginally confirms support at the now uptrending 50DMA.
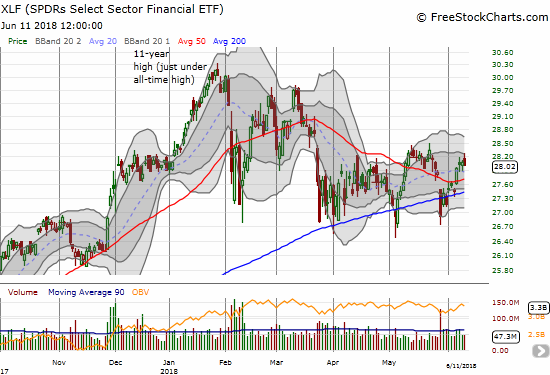
Financial Select Sector SPDR ETF (XLF)
Financials are important laggards since the S&P 500 topped out in February. On the positive side, XLF convincingly held support at its 200DMA. A close above the May high should act as a confirmation of the market’s bullish potential.
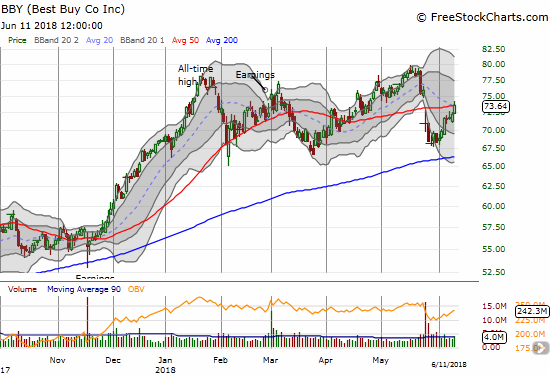
Best Buy (BBY)
BBY had a disastrous earnings report last month. Sellers were not able to pressure the stock into a lower low and now buyers are taking back control. With retail stocks resurgent and finally acting out my 2018 recovery thesis, BBY is an archetype catch-up stock. The stock closed right on its 50DMA resistance (yep, cannot make this stuff up!). A close above today’s intraday high confirms the return of bullishness for BBY and should further confirm bullish stock market sentiment.
Fitbit (FIT)
When it comes to scraping the bottom of the barrel for catch-up plays, FIT is surely a prime candidate. The stock of this wearable device maker is already up 34.1% in June. Citron thinks FIT is a perfect contrarian play and could be a $15 stock. The stock still has 20.9% of its float sold short. I am not sure what the bears are still waiting for…bankruptcy?
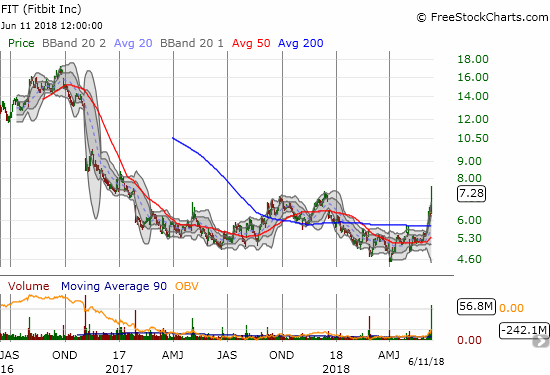
"$FIT IS IN GOOD SHAPE"-tgt $15. The future of wearables is undeniable. $FIT transformation from consumer products to med-tech is real. FDA/Google/Dexcom know it. Andrew Left on Bloomberg TV 2:30 est to discuss https://t.co/nLqByDUMwK
— Citron Research (@CitronResearch) June 11, 2018
In other trades: took profits on CMG calendar call spread
— – —
FOLLOW Dr. Duru’s commentary on financial markets via email, StockTwits, Twitter, and even Instagram!
“Above the 40” uses the percentage of stocks trading above their respective 40-day moving averages (DMAs) to assess the technical health of the stock market and to identify extremes in market sentiment that are likely to reverse. Abbreviated as AT40, Above the 40 is an alternative label for “T2108” which was created by Worden. Learn more about T2108 on my T2108 Resource Page. AT200, or T2107, measures the percentage of stocks trading above their respective 200DMAs.
Active AT40 (T2108) periods: Day #79 over 20%, Day #48 over 30%, Day #43 over 40%, Day #25 over 50%, Day #8 over 60%, Day #1 over 70% (1st overbought day, ending 92 days under 70%)
Daily AT40 (T2108)
")
Black line: AT40 (T2108) (% measured on the right)
Red line: Overbought threshold (70%); Blue line: Oversold threshold (20%)
Weekly AT40 (T2108)

*All charts created using freestockcharts.com unless otherwise stated
The charts above are my LATEST updates independent of the date of this given AT40 post. For my latest AT40 post click here.
Related links:
The AT40 (T2108) Resource Page
You can follow real-time T2108 commentary on twitter using the #T2108 or #AT40 hashtags. T2108-related trades and other trades are occasionally posted on twitter using the #120trade hashtag.
Be careful out there!
Full disclosure: long UVXY calls
*Charting notes: FreeStockCharts.com stock prices are not adjusted for dividends. TradingView.com charts for currencies use Tokyo time as the start of the forex trading day. FreeStockCharts.com currency charts are based on Eastern U.S. time to define the trading day.