
The fundamentals have changed little. Sentiment is making a dramatic shift.
The last Housing Market Review covered data reported in April, 2018 for March, 2018. At the time, I lamented a dissonance of decelerating housing data and diverging home builder stocks. Over a month later, the deceleration is a little less pronounced while the divergence continues. This time around, the divergence is occurring alongside a noticeable shift in sentiment that is lifting the stocks of home builders off recent lows and sending a very select number into key technical breakouts. I marvel at how sharply sentiment can change even as the data show little to no change in the fundamental story. Moreover, the stories from the earnings of home builders have beat a nearly consistent bullish melody for months on end.
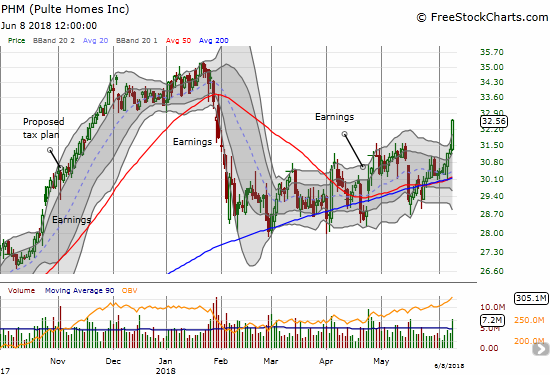
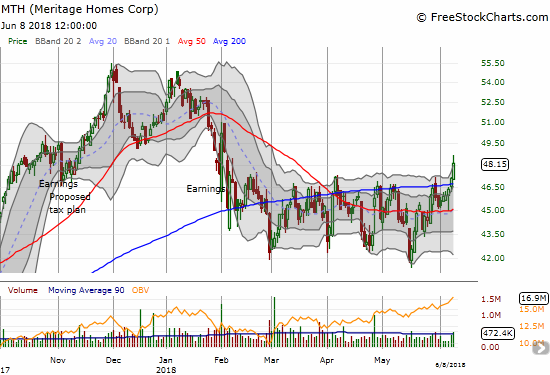
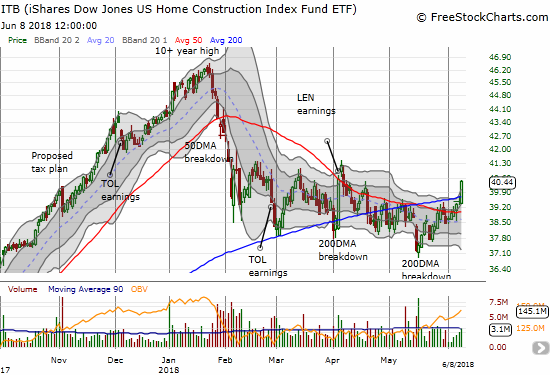
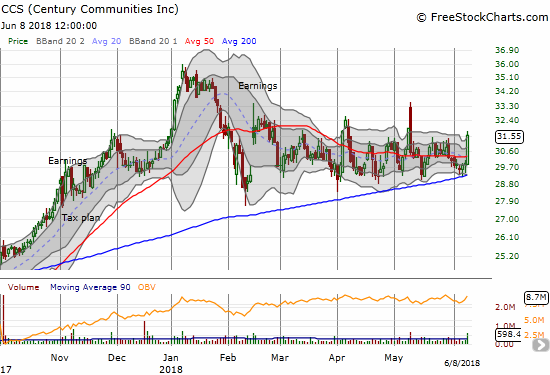
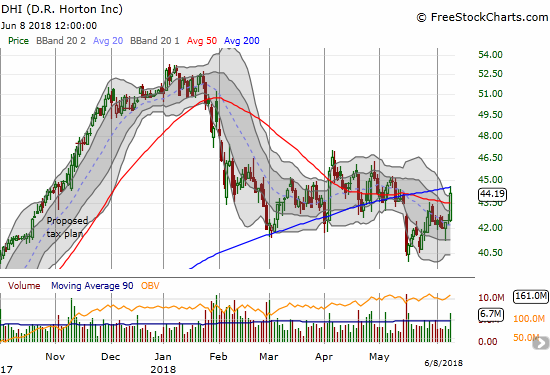
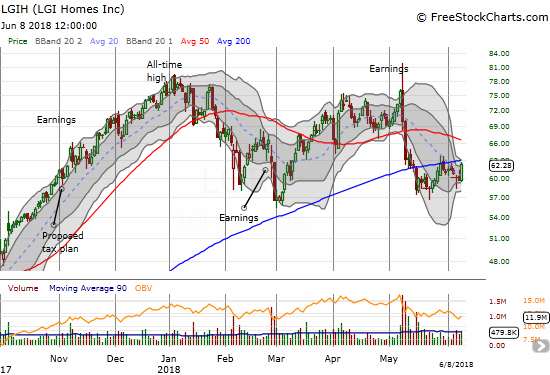
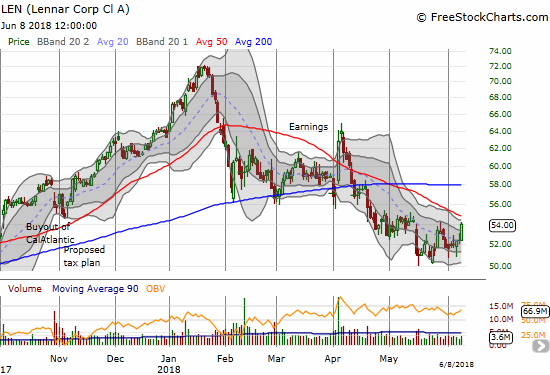
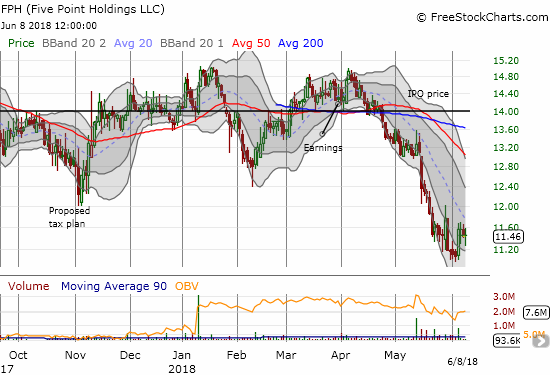
To show the growing divergence in home builder stocks, I sequenced the charts below starting from what I think is the best to the least of the bunch. Pulte Homes (PHM) and Meritage Homes (MTH) are clear buys based on the technicals, and I have put them on my list of targets. I already made a fresh move on iShares US Home Construction ETF (ITB) with a calendar call spread at the $41 strike and the months of July and October. This is a “no regret” position which allows me to profit a small amount if ITB stays within a small range from current levels. I am not expecting the entire index to break free for a challenge of the January high, especially given the seasonally strong period for home builders stocks is over and does not restart until November. If a wholesale rally does develop, then positions in PHM and MTH should be tremendous beneficiaries. (Recall that I also singled out PHM as looking particularly strong in the last Housing Market Review.)
Source for charts: FreeStockCharts.com
New Residential Construction (Housing Starts) – April, 2018
Single-family housing starts for March were revised significantly upward from 867,000 to 893,000. As a result April starts barely increased month-over-month by 0.1% to 894,000. On an annual basis, single-family housing starts increased 7.2%. This is a small drop from March’s revised annual growth rate of 8.0%. These two months delivered a welcome break from February’s 2.6% year-over-year increase which was the smallest annual gain since October, 2017 at 1.8%.

Source: US. Bureau of the Census, Privately Owned Housing Starts: 1-Unit Structures [HOUST1F], retrieved from FRED, Federal Reserve Bank of St. Louis, June 6, 2018.
Over the last eight months, regional year-over-year changes in starts have exhibited wide dispersion. The Northeast, Midwest, South, and West each changed 19.1%, -15.2%, 13.3%, and 4.4% year-over-year respectively in April. The West’s strong streak of starts finally came to an end while the Northeast soared.
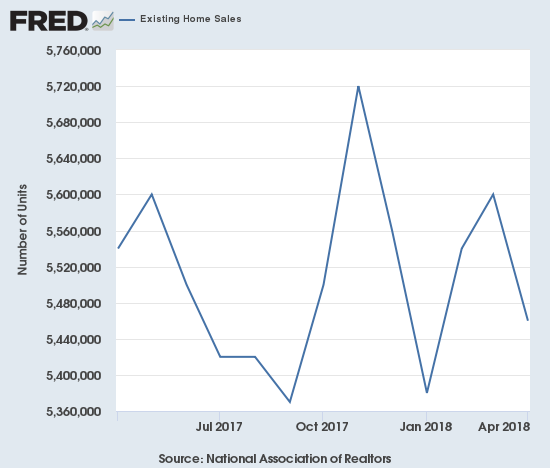
Existing Home Sales – April, 2018
The February existing sales numbers ended a 2-month sales decline and softened a bit my alarm bells. In March, monthly sales continued to increase, but the year-over-year change was a decrease. For April, both monthly and year-over-year changes were declines. I am back to a cautious stance on existing home sales.
The routine description for existing sales is usually sales decline because of a shortage of inventory and sales increase in spite of inventory shortages. Per the script, for April, the National Association of Realtors (NAR) emphatically singled out inventory as the market’s problem: “The root cause of the underperforming sales activity in much of the country so far this year continues to be the utter lack of available listings on the market to meet the strong demand for buying a home…inventory shortages are even worse than in recent years, and home prices keep climbing above what many home shoppers are able to afford.”
The NAR attributed February’s sales gains to a “seasonal” jump in inventory. In the April press conference the NAR noted that new listings were up year-over-year and optimistically projected that inventory could actually increase in late summer or fall. That optimism went unrewarded in April’s data, so I will continue to wait and see.
The seasonally adjusted annualized sales in April of 5.46M was down 2.5% month-over-month from 5.60M in sales for March (no revision). Year-over-year sales decreased 1.4% and thus stayed consistent with the current trend of decelerating existing home sales.
(As of the March, 2018 data, the NAR further reduced historical data to just 13 months. For historical data from 1999 to 2014, click here. For historical data from 2014 to 2018, click here)
Source for chart: National Association of Realtors, Existing Home Sales© [EXHOSLUSM495S], retrieved from FRED, Federal Reserve Bank of St. Louis, June 6, 2018.
The share of sales going to first-time buyers increased to 33%. This share was 30% in March, 29% in February and November and was 32% a year ago. Recall that September was the first time in two years where the share dropped below 30%. The NAR warned in last month’s report that “Realtors® in several markets note that entry-level homes for first-timers are hard to come by, which is contributing to their underperforming share of overall sales to start the year.” This second consecutive increase in first-timer share somewhat refutes/confounds the narrative of relatively poor affordability. First-timer share will need to quickly decline again to maintain the narrative. A regional breakdown of the data could also reveal important features of the current trends.
The average share for first-time homebuyers for 2016 was 35%. The NAR’s 2017 Profile of Home Buyers and Sellers reported an average of 34% for 2017. Investors purchased 15% of homes in April, the same as February and March and a year ago. Investor sales averaged a share of 15% in 2017 and 14% in 2016.
The absolute level of inventory of existing homes fell year-over-year for the 35th straight month. By contrast, inventory increased from March to April by 9.8%, a FOURTH straight monthly increase. The NAR noted in its February press conference that inventory “always” increases after the Christmas holiday. However, I think I was correct in suspecting that this increasing trend looks like more than post-holiday effects. The trend is also consistent with the NAR’s expectation of a potential inventory inflection point later this year. For contrast, recall that during its June, 2017 press conference, the NAR talked about a housing crisis in supply in some housing markets. For now the supply crisis continues to run deep at 4.0 months of supply at the current sales rate, down from 4.2 a year ago. The 1.80M homes for sale represents a 6.3% decrease from the previous April.
The regional story on existing home sales had one bright spot in the South: Northeast -11.0%, Midwest -3.0%, South 2.2%, West -0.8% year-over-year. As usual, regional sale fluctuations had no relationship to the on-going price run-ups. Each region once again logged notable to substantial year-over-year jumps in median prices: Northeast 2.8%, Midwest 4.6%, South 3.9%, West 6.2%.
April’s 5.3% year-over-year increase in the overall median price of an existing home delivered the 74th consecutive month with a year-over-year increase. The median price of $257,900 is significantly higher than March’s $250,400. This is a new record that surpasses the previous record set in August, 2017 at $253,500. Surprisingly, the NAR did not acknowledge this record.
Single-family sales declined 3.8% on a monthly basis and decreased on a yearly basis by 1.6%. The median price of $259,900 was up 5.5% year-over-year.
During the April press conference, the NAR provided an update on the impact of tax reform on existing home sales. The NAR observed that fewer and fewer people are expressing concern about the limits on the mortgage tax deduction. However, they ARE starting to worry about increasing interest rates. In May’s conference call, the NAR pointed out that higher rates do have a real cost impact on top of price increases: the average homeowner’s mortgage has gone from $1072 to $1190 per month, an 11% increase. The NAR pointed out that wages have certainly not gone up this much. It was an ominous footnote even though the NAR also pointed out that so far demand remains quite strong.
New Residential Sales – April, 2018
In February, new home sales barely eked forward. New home sales were resurgent in March. April sales did not keep pace on a monthly basis but delivered a strong year-over-year performance.
The Census Bureau revised March sales of new single-family homes downward from 694,000 to 672,000, ending two straight months of sizable upward revisions. New home sales for April decreased 1.5% month-over-month and increased 11.6% year-over-year to 662,000. Year-over-year gains have regularly hit double digits since 2012; November’s 26.6% jump was the highest since February, 2015 when new home sales soared 29.8% year-over-year. April breaks a string of three months of single-digit gains which represented a concerning deceleration in new home sales.
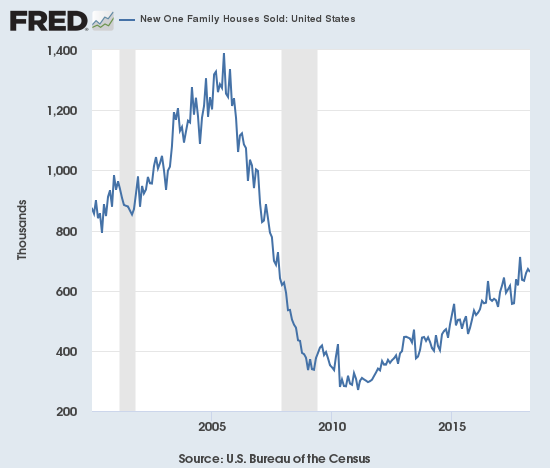
Source: US. Bureau of the Census, New One Family Houses Sold: United States [HSN1F], retrieved from FRED, Federal Reserve Bank of St. Louis, June 8, 2018.
In December, the inventory of new homes jumped to 5.7 months of supply and ended several months of imbalance. A market for homes is in balance at 6 months of supply. February’s inventory stood at 5.9 months. March’s inventory dropped back to 5.2 months. April’s inventory sat at 5.4 months worth of sales.
March’s revised median price of $335,400 was a 4.3% year-over-year gain. The revised average sales price of $366,000 was a 4.8% year-over-year decline so lower-priced new homes well outpaced the sales of high-priced new homes. For April, higher-priced homes surged back. April median price of $312,400 was a mere 0.4% gain, but the average price soared 11.3%.
On a regional basis, new home sales exhibited divergence but was across the board strong. After a string of very strong gains since August, the Northeast finally ran out of gas in January with a 44.2% year-over-year plunge. For February the Northeast returned to gains with an 8.8% jump only to plunge again 52.5% in March. For April, Northeast scraped out a 5.3% gain. The Midwest soared 26.4%. The South gained 6.0% year-over-year. The West cooled off from January’s blistering 33.2% year-over-year gain to gain 3.1% year-over-year for February. The West heated up again in March with a 24.7% jump. The West stayed hot in April with an 18.9% gain in sales.
Home Builder Confidence: The Housing Market Index – May, 2018
In the previous housing market review, I explained why I would not have thought much of March’s slight decline in the Housing Market Index (HMI). At 70, the HMI was still higher than it was for most of 2017. For April, the HMI declined yet again, that time by two points to 68 (revised downward by a point). May’s HMI popped back up to 70. In March the Traffic of Prospective Buyers dropped from 54 to 51 and reversed all its gains since November, 2017. In April, this component held steady while the other two fell. In May, this component sat at 51 yet again. I am assuming the HMI has peaked until later in the year.
The statement from the NAHB was very positive. The only caveat related to prices:
“The solid May report shows that builders are buoyed by growing consumer demand for single-family homes. Tight housing inventory, employment gains and demographic tailwinds should continue to boost demand for newly-built single-family homes. With these fundamentals in place, the housing market should improve at a steady, gradual pace in the months ahead. However, the record-high cost of lumber is hurting builders’ bottom lines and making it more difficult to produce competitively priced houses for newcomers to the market.”
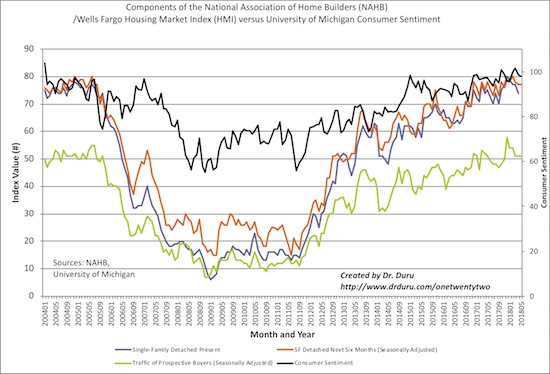
Source: NAHB
While the overall HMI increased, the South and West HMI’s declined by a point. The Midwest was the big winner by rebounding from the March and April (revised) dip. The Northeast stayed flat.
Parting thoughts
My parting thoughts in recent Housing Market Reviews have focused on the financial struggles of home buyers and renters. For this month, I selected a recent story from American Marketplace explaining how young home buyers are finding ways to make things work. Young adults are just as interested in owning a house as previous generations; they are just finding it harder than previous generations to own.
“The homeownership rate among millennials is at roughly 35 percent, which is lower than any other generation of young adults in the last 50 years. There’s a common narrative that young people aren’t as interested in buying homes, that after watching what happened to their parents during the financial crisis, they’ve become wary of homebuying.
But poll after poll — including the Marketplace-Edison Research Poll — show that homeownership is as big of a goal for young people as it is for everyone else. It can just be difficult to do.”
Be careful out there!
Full disclosure: long ITB calendar call spread, long FPH