
(T2108 measures the percentage of stocks trading above their respective 40-day moving averages [DMAs]. It helps to identify extremes in market sentiment that are likely to reverse. To learn more about it, see my T2108 Resource Page. You can follow real-time T2108 commentary on twitter using the #T2108 hashtag. T2108-related trades and other trades are occasionally posted on twitter using the #120trade hashtag. T2107 measures the percentage of stocks trading above their respective 200DMAs)
T2108 Status: 57.5%
T2107 Status: 61.4%
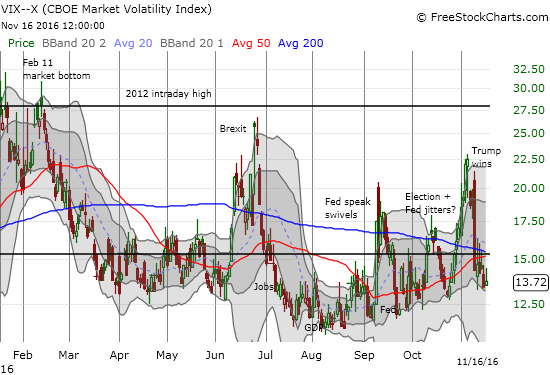
VIX Status: 13.7
General (Short-term) Trading Call: bullish
Active T2108 periods: Day #187 over 20%, Day #7 over 30%, Day #6 over 40%, Day #4 over 50% (overperiod), Day #51 under 60%, Day #77 under 70%
Commentary
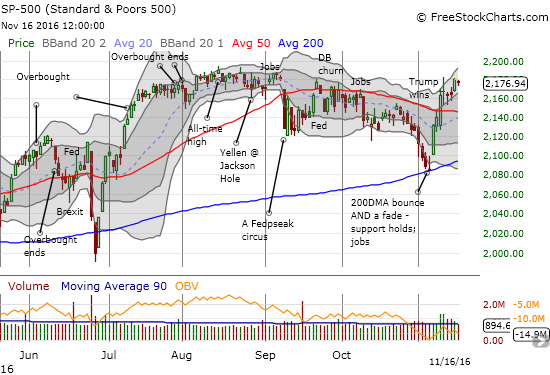
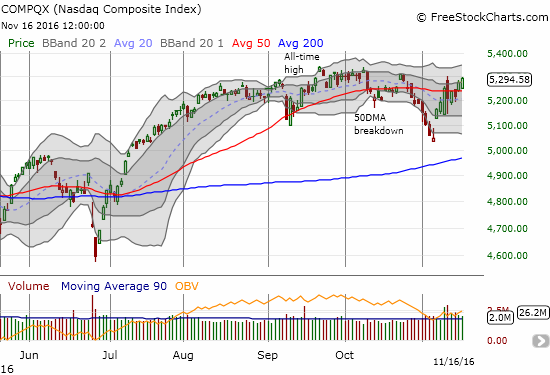
Financial markets took another (mixed) breather today this sixth day of post-election trading. The S&P 500 (SPY) closed fractionally down. Wednesday November 16th marked the fifth tradind day that the S&P 500 has struggled just under its all-time high. The NASDAQ (QQQ) gained 0.6%; the tech-laden index is creeping ever closer to its all-time high.
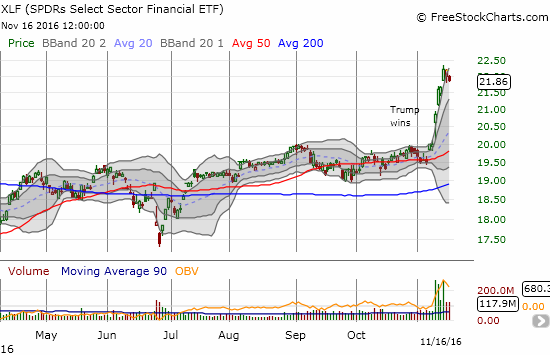
Financials settled down for a second straight day. I am nearly jumping out my seat at the chance to load up on a dip in Financial Select Sector SPDR ETF (XLF).
T2108, the percentage of stocks trading above their respective 40-day moving averages (DMAs), took its own rest and closed essentially flat with the previous day. The volatility index, the VIX, managed to print a marginal gain as it clinged to lower uptrending support.
I daresay the stock market is starting to settle into a comfort zone just as both the S&P 500 and the NASDAQ re-approach all-time highs. The U.S. Thanksgiving weekend is next week. After that, the Federal Reserve’s December meeting will loom larger and larger. I see plenty of motivation for market participants to cool down until these catalysts reveal themselves.
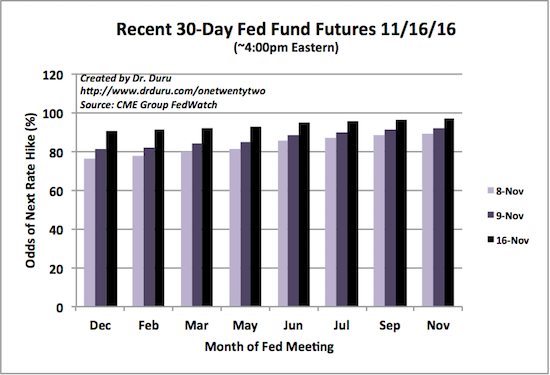
Source: CME Group FedWatch
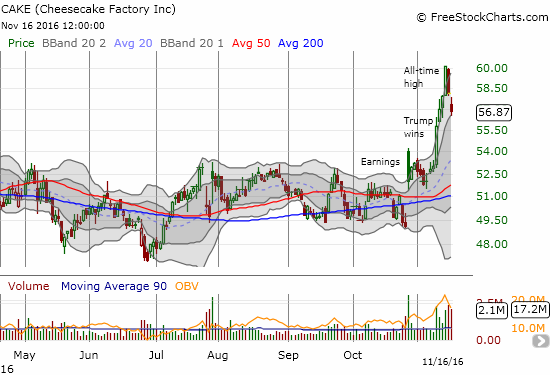
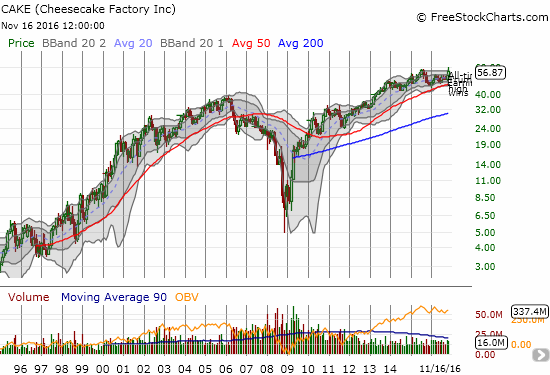
I continue to marvel at some of the breathtaking moves in the stock market on individual stocks. Theme trades abound and thrive. In previous posts I completely passed over the restaurant/dining stocks. The Cheesecake Factory (CAKE) is one of many in this sector that makes me salivate. CAKE gapped up post-earnings and then lingered in wait for a fresh catalyst. The election propelled CAKE to a new all-time high. Sellers stepped in with force from there: the last 2 days of selling reversed the previous 2 days of gains. I am good buying into a third day of selling that takes CAKE back to its post-election reaction. First, I will be looking to see whether Wednesday’s low holds.
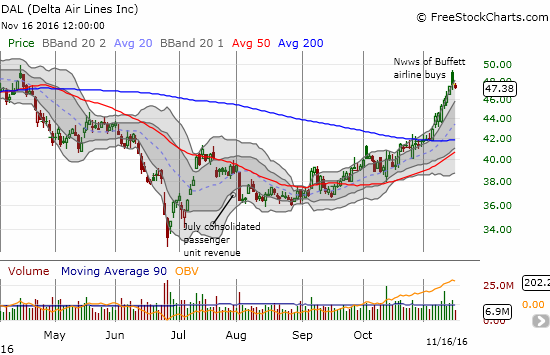
The latest theme stocks come from airlines. On Tuesday, November 15, 2016, news went out that Buffett reversed his long-standing aversion to airline stocks and loaded up. Unfortunately, this news came in the middle of a 2 1/2 month run-up. Indeed, Delta Airlines (DAL), for example, gapped up on the Buffett news and proceeded to sell-off right back to the previous day’s close. That kind of move tells me that DAL is closer to the end than the beginning of the current rally.
I post the following chart as an exmaple of how the technicals can provide traders clues on a change in sentiment. DAL sold-off in early August on its release of July passenger revenue numbers. That low held all month and provided the launch pad for a 50DMA breakout in September. The change in sentiment was confirmed when DAL proceeded to break out above 200DMA resistance at the beginning of November. Incredibly, DAL has experiecned just two (very minor) losing days this month.
I am really kicking myself on DAL. Back on August 2nd, this is what I had to say about the stock:
“Delta Airlines (DAL) ran into trouble with its July report on passenger revenue. I noticed that Delta claimed the numbers were exactly as they expected. So, the depths of the selling surprised me; if I were bullish, I might be looking to buy this dip. Instead, I am noting that the high-volume selling confirmed 50DMA resistance. DAL is now down a whopping 28% year-to-date. With oil prices tumbling again, I have to resist the urge to think of the selling in DAL as a buying opportunity for now. On a technical basis, DAL is one to fade in a bearish market on any rallies up to the 50DMA.”
If I had kept tabs on Delta, I would have turned bullish as my read on the market turned more bullish as well. What a lesson!
— – —
FOLLOW Dr. Duru’s commentary on financial markets via email, StockTwits, Twitter, and even Instagram!
Daily T2108 vs the S&P 500
")
Black line: T2108 (measured on the right); Green line: S&P 500 (for comparative purposes)
Red line: T2108 Overbought (70%); Blue line: T2108 Oversold (20%)
Weekly T2108

*All charts created using freestockcharts.com unless otherwise stated
The charts above are the my LATEST updates independent of the date of this given T2108 post. For my latest T2108 post click here.
Related links:
The T2108 Resource Page
Be careful out there!
Full disclosure: long UVXY shares and long UVXY put