
Stock Market Analysis Summary
|
Stock Market Commentary
This holiday shortened week looked like a time for the sellers to go on vacation. The buyers stepped right in to celebrate the Black Friday shopping specials left in their wake. The cracks that opened wide up in the stock market look healed; nothing like holidays spirits to heal a cracked stock market. My anticipation for an overdue visit to oversold trading conditions (with the S&P at 6200) has given way to expectations for a resumption of the prior melt-up rally.
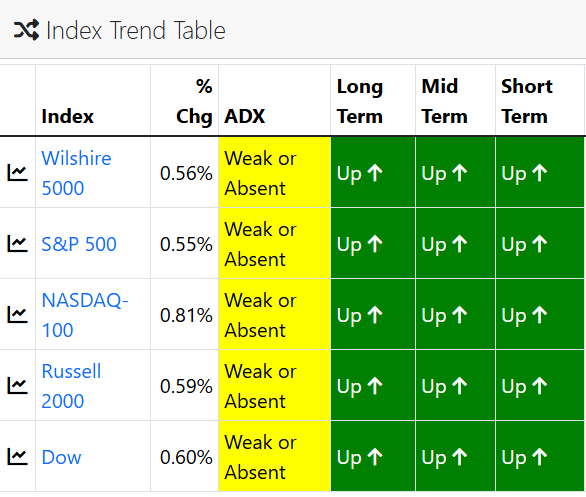
In a very familiar pattern for this year, the stock market already looks like nothing ever happened. All those cares and concerns have evaporated even faster than they blossomed. Swingtradebot summarizes everything: all the trends are up for every time frame and every major index.
The Stock Market Indices
S&P 500 (SPY)
The S&P 500 barely paused at resistance at its 50-day moving average (DMA). On Monday, the index gained 1.6% and stopped just short of the 50DMA. After the bullish breakout, I decided to stay neutral given my preference to avoid churning the short-term trading call. Still, the window clearly closed quickly for shorting and betting against stocks.
")
NASDAQ (COMPQX)
The NASDAQ cleaved right through 50DMA resistance and, like the S&P 500, popped above its 20DMA resistance. The tech laden index remains burdened by lingering AI-related fears, so it is not as close to its all-time high as the S&P 500 is to its all-time high. I will not be surprised to see the NASDAQ dip below its 50DMA at least one more time before printing a new all-time high.
")
iShares Russell 2000 ETF (IWM)
The iShares Russell 2000 ETF (IWM) launched straight up since its Friday turnaround. I completely underestimated the ability of the ETF of small caps to rally. Even though financial markets enthusiastically rallied around fresh hopes for a December rate cut from the Federal Reserve, I did not include in my likely trading scenarios an IWM shotting higher so sharply. IWM is now just two points away from its all-time high.
")
The Short-Term Trading Call and Heal A Cracked Stock Market
- AT50 (MMFI) = 52.8% of stocks are trading above their respective 50-day moving averages
- AT200 (MMTH) = 57.8% of stocks are trading above their respective 200-day moving averages
- Short-term Trading Call: neutral
AT50 (MMFI), the percentage of stocks trading above their respective 50DMAs, closed the week at 52.8%. Market breadth expanded throughout the entire week as buyers seemed to snap everything and anything not nailed to a bearish narrative. With the current momentum, market breadth looks like it could hit the primary downtrend in short order. Overbought trading conditions, AT50 above 70%, should follow soon after such a breakout. Such a move would be consistent with the long-awaited year-end rally.
I left my short-term trading call at neutral because I downgraded just a week and a half ago. I will flip back to bullish on a successful retest of 50DMA support before a run-up to overbought trading conditions. (Yes, I know – I am asking for a very specific set of trading conditions). In the meantime, I see no reason to go short except as a small hedge against bullish trading positions.
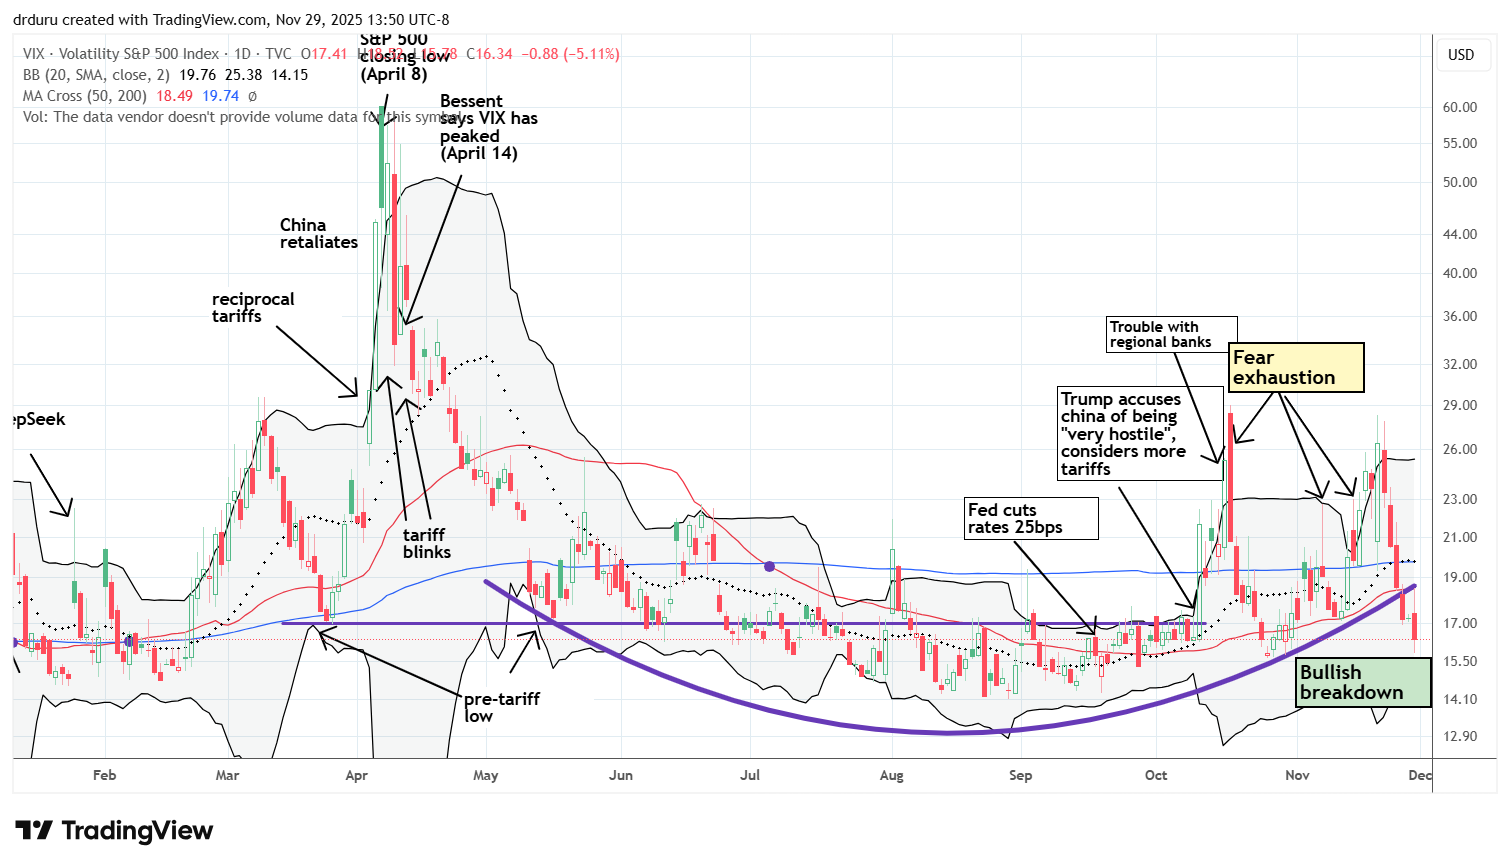
Even the volatility index (VIX) has cleared the runway for bullishness. The bowl I drew to highlight the upward pressure on the VIX broke down over the last two trading days.
The Equities: Heal A Cracked Stock Market
Kohl’s Corporation (KSS)
Description: Kohl’s Corporation (KSS) operates retail department stores offering apparel, footwear, accessories, beauty products, and home goods.
Technical status: Kohl’s Corporation (KSS) soared 42% post-earnings and formed a sharp V-shaped recovery that returned the stock to a one-and-a-half-year high.
Trade commentary: I did not take this member of the DORK meme stocks seriously enough. I got the trade setup I wanted in KSS and proceeded to take profits after the stock jumped to $14 in August. Now, it is clear KSS in some kind of sustained recovery. Last week the stock soared 42% post-earnings and buying momentum continued from there. The stock trades at a year-and-a-half high with a strong V-shaped recovery. Perhaps the consumer is just fine after all.
")
Dick’s Sporting Goods (DKS)
Description: Dick’s Sporting Goods (DKS) sells sporting equipment, apparel, footwear, and related outdoor and athletic goods through retail stores and an online platform.
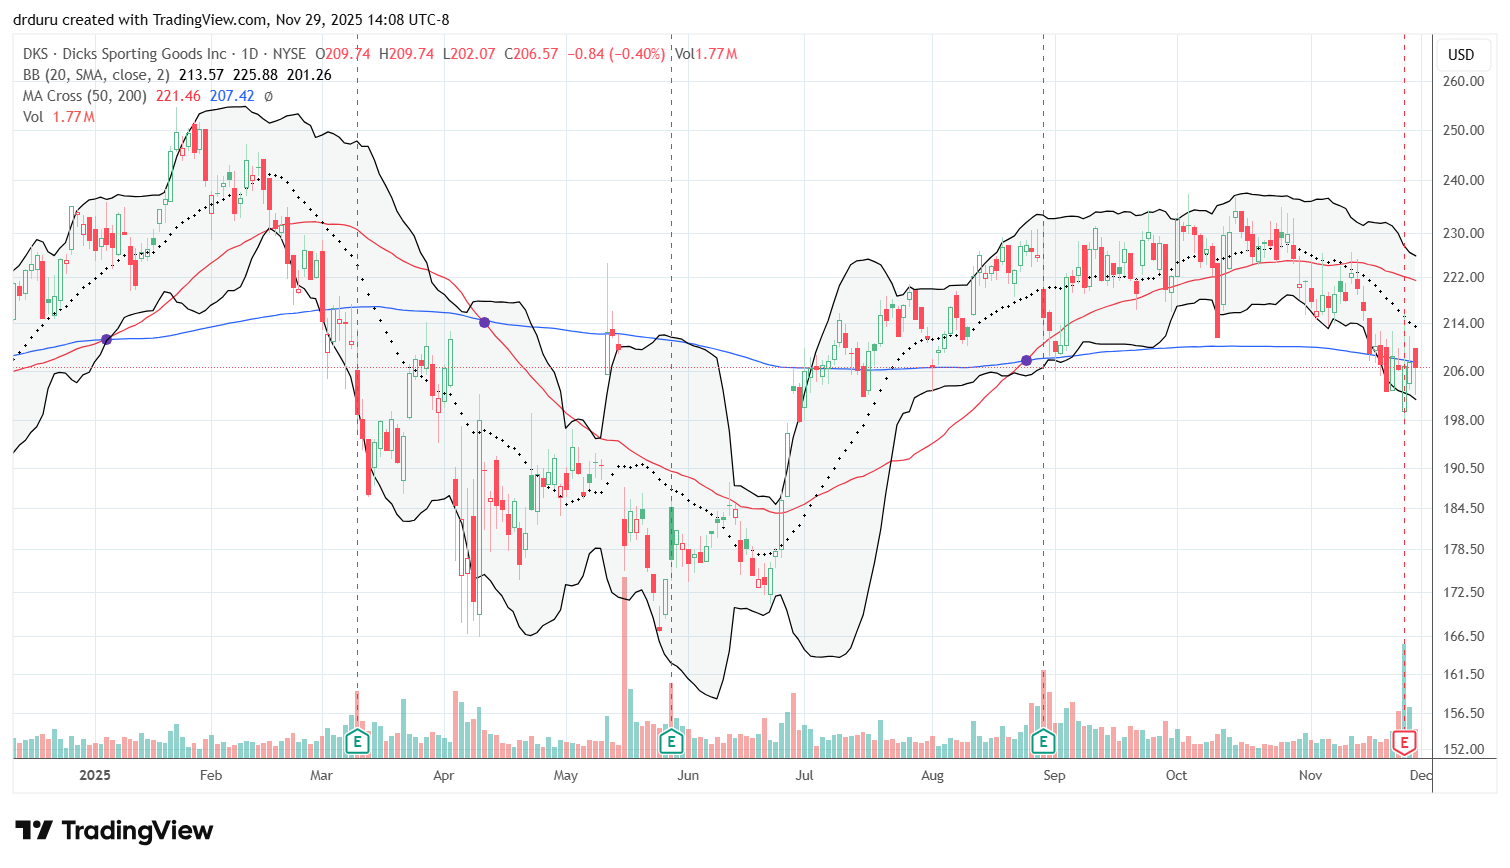
Technical status: Dick’s Sporting Goods (DKS) held 200DMA support after an earnings dip and maintained its long-standing trading range.
Trade commentary: DKS clung to 200DMA support. The company reported earnings, dipped, and buyers stepped in. The stock has actually not gone anywhere since early 2024, so I see no trade here. Still, I am an observer in an attempt to connect the dots on what the market really thinks about the health of the consumer and consumer spending.
Best Buy (BBY)
Description: Best Buy (BBY) sells consumer electronics, appliances, and related services through retail stores and digital platforms.
Technical status: Best Buy (BBY) gained 1.1% post-earnings and continued to trade within a multi-year sideways range.
Trade commentary: Best Buy reported earnings and gained 1.1%. Like DKS, there is not much of a story here because multi-year churning in a range. In fact, BBY has not gone anywhere since 2022 and even 2018 depending on your perspective. So, there is no trade here, just an observation that BBY provided another indication the consumer is not dead. From the transcript of the earnings conference call: “Importantly, while customers continue to be thoughtful about big-ticket purchases in the current environment, they are willing to spend on high price point products when they need to or when there is technology innovation.”
")
Six Flags Entertainment Corporation (FUN)
Description: Six Flags Entertainment Corporation (FUN) operates amusement parks and related entertainment attractions.
Technical status: Six Flags Entertainment Corporation (FUN) broke below its pandemic lows before stabilizing near long-term support with insider and institutional buying.
Trade commentary: I bought FUN last week after seeing news about a new CEO. I had FUN on watch ever since Jana Partners and Travis Kelce bought a significant 9% stake that sent FUN up 17.7% in October. However, since I have seen this kind of news fade before (see Novo Nordisk (NVO)), I did not jump at the bait. Institutional investors are not insiders, so they can be making guesses just as good or bad as the rest of us. Anyway, after the fade, FUN dropped like a rock and plunged toward pandemic lows. I made an exception to my rule to avoid buying into extended downtrends given the accumulation of potentially positive catalysts. My stop loss is at new lows.
")
Roblox (RBLX)
Description: Roblox Corporation (RBLX) provides an online entertainment platform that allows users to create and play immersive digital experiences.
Technical status: Roblox Corporation (RBLX) broke below 200DMA support and moved into bearish territory.
Trade commentary: I had circled a pending test of the 200DMA (the blue line), but that support did not hold. RBLX cleaved right through it and turned technically bearish. With the stock down significantly from former highs, I am keeping an eye on the stock for a potential rebound trade on a 200DMA breakout to at least 50DMA resistance.
")
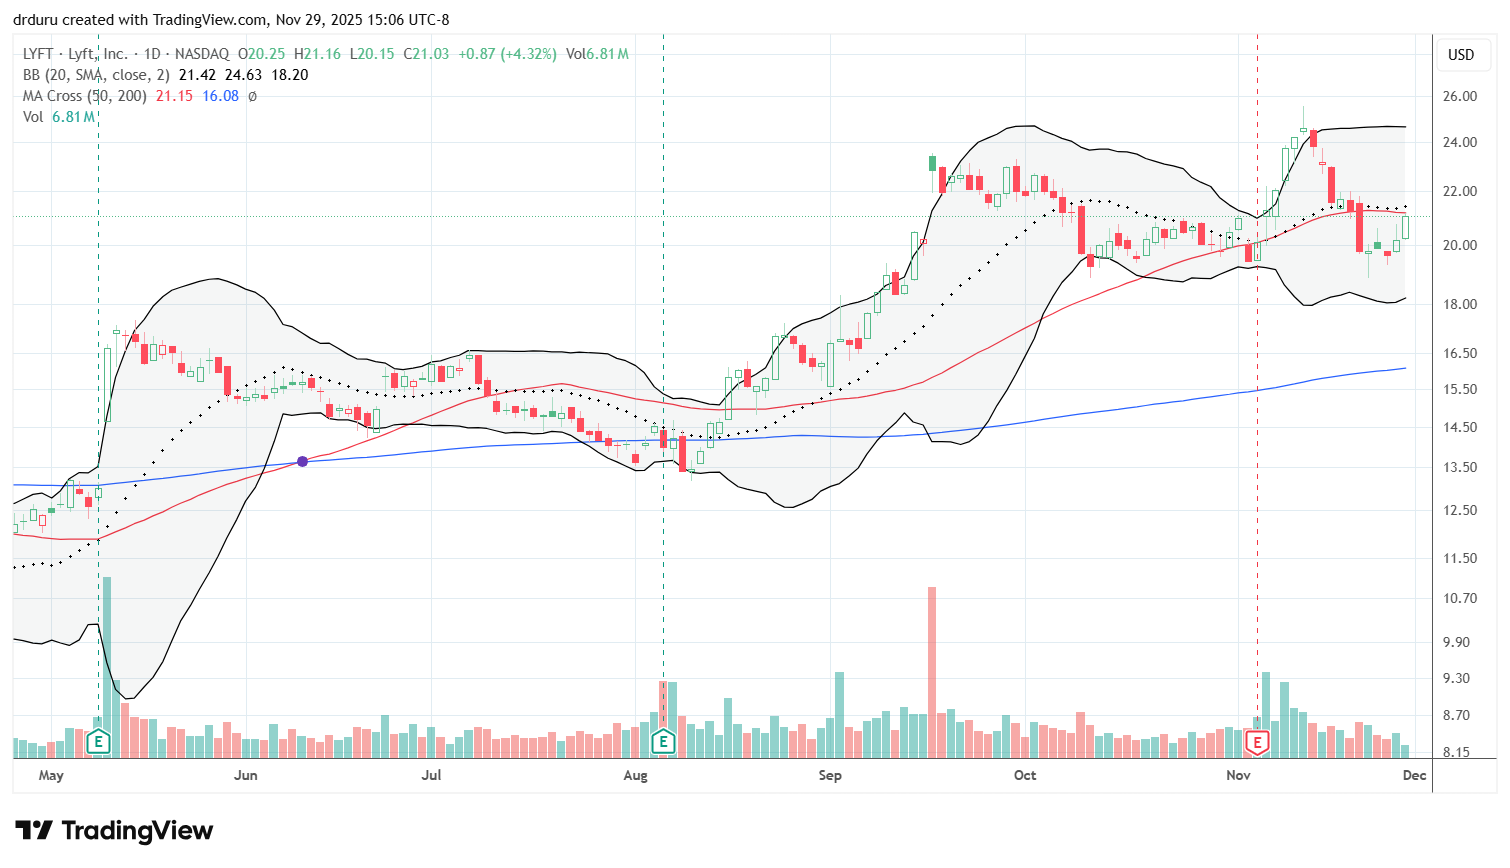
Lyft (LYFT)
Description: Lyft (LYFT) provides ride-hailing and transportation services through its digital platform.
Technical status: Lyft (LYFT) reversed its post-earnings gains but held firm as sellers failed to push the stock below recent lows.
Trade commentary: LYFT gained 5.8% post-earnings and continued higher for 4 more trading days before sentiment completely reversed. A 50DMA breakdown completed the reversal of post-earnings gains. I am looking to buy the stock on a 50DMA breakout in anticipation of a retest of recent highs.
Corsair Gaming (CRSR)
Description: Corsair Gaming (CRSR) designs and sells gaming peripherals, streaming gear, and performance hardware components.
Technical status: Corsair Gaming Inc (CRSR) rebounded slightly after a sharp decline and broke out above its 20DMA partially thanks to news about the CEO buying shares.
Trade commentary: CRSR dropped 13.2% post-earnings earlier this month, continuing a long-standing downtrend since initial post-IPO excitement. The stock caught my interest after news of the CEO stepping in to buy $35,000 worth of CRSR stock. I bought some shares with a stop at a new all-time low.
")
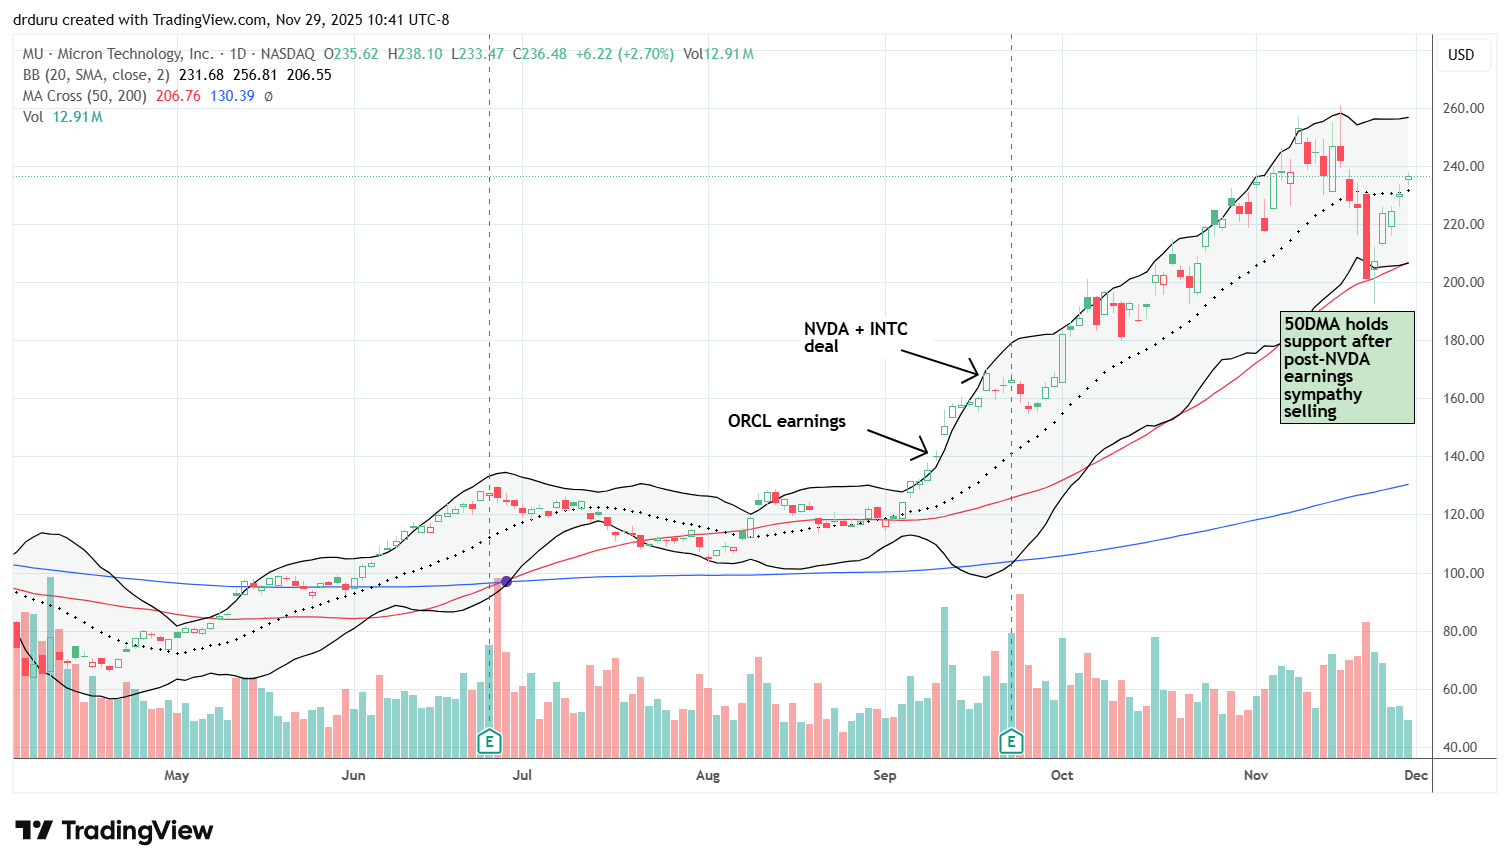
Micron Technology (MU)
Description: Micron Technology (MU) produces memory and storage products including DRAM and NAND solutions.
Technical status: Micron Technology (MU) defended its 50DMA and then surged 8%, recovering recent losses and resuming its uptrend.
Trade commentary: MU plunged in sympathy with the fade of NVDA earnings. I bought a 230/250 call spread after buyers defended 50DMA support. MU ended the week with a full recovery of the NVDA-driven loss. I expect MU to eventually test all-time highs and perhaps resume its earlier uptrend.
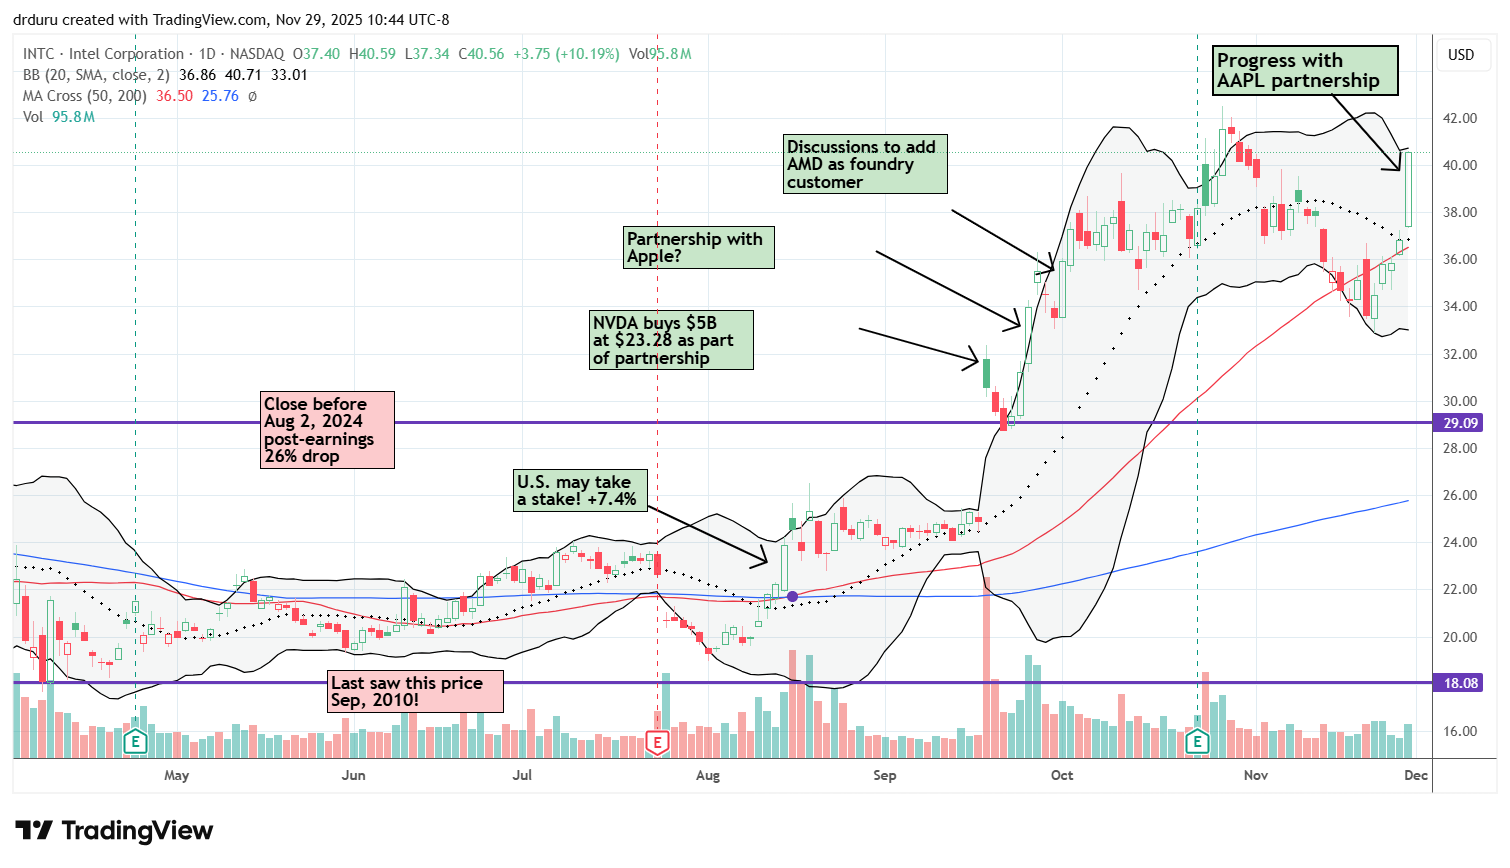
Intel (INTC)
Description: Intel (INTC) designs and manufactures semiconductor chips and related computing technologies.
Technical status: Intel (INTC) surged 10.2% and reclaimed 50DMA support on news about progress in its partnership with Apple.
Trade commentary: I took my eye off the ball on INTC; I failed to have a between earnings trade in place as the stock crept along its 50DMA. On Friday, INTC soared 10.2% on news that its partnership with Apple was taking shape. INTC is a buy on the dips from here to support from the converged 20DMA and 50DMA.
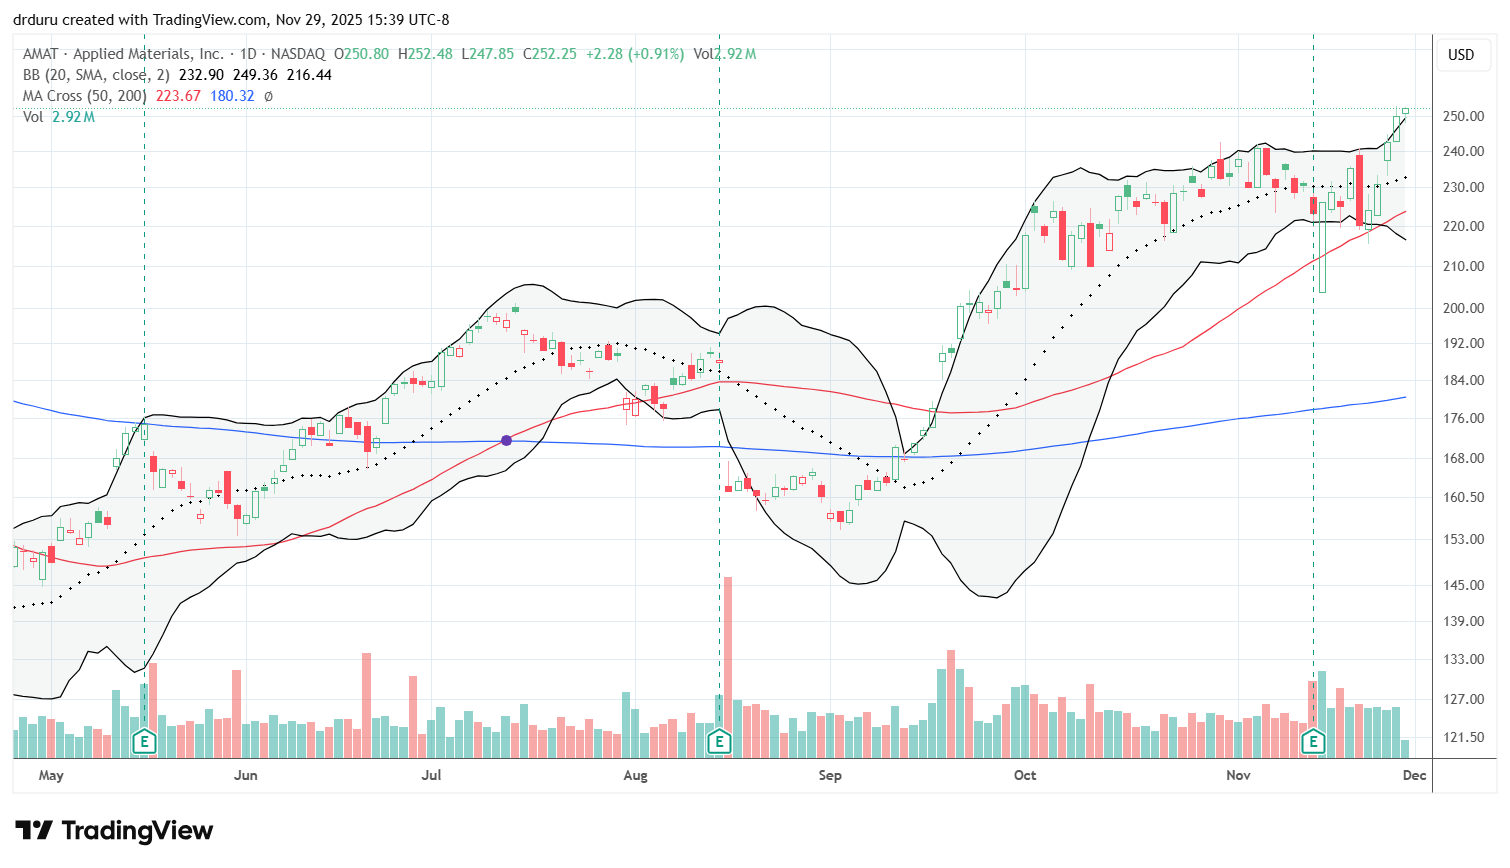
Applied Materials (AMAT)
Description: Applied Materials (AMAT) provides manufacturing equipment and services to the semiconductor industry.
Technical status: Applied Materials (AMAT) recovered quickly from a 50DMA breakdown and challenged its all-time high.
Trade commentary: AMAT had a big week by challenging its all-time high. After earnings, it plunged below its 50DMA but recovered right away in a bullish turn. I did not buy because I had enough semiconductor exposure at the time, but this rebound was a good signal for the entire semiconductor trade.
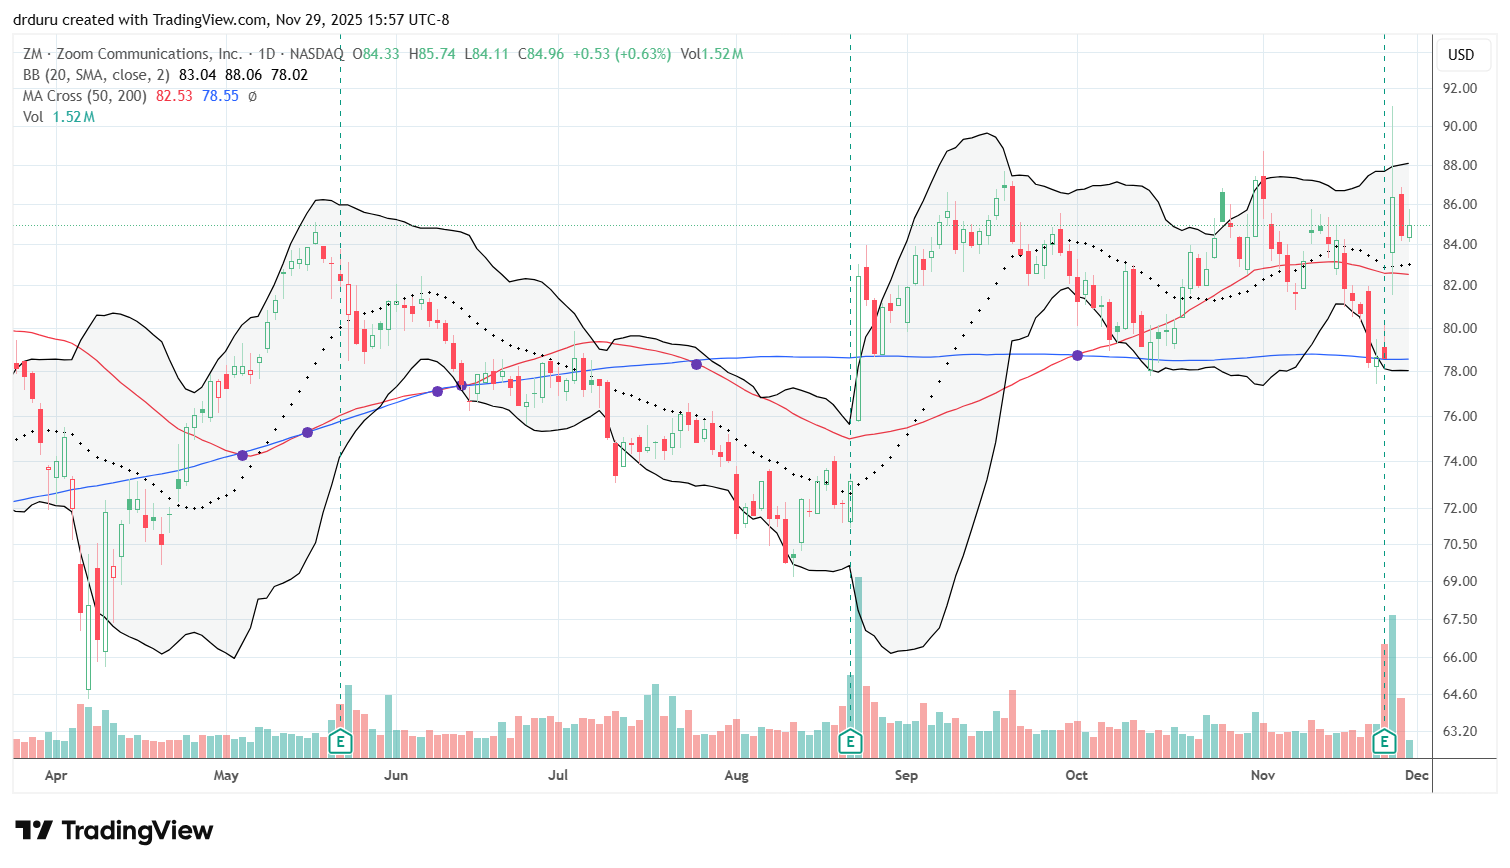
Zoom (ZM)
Description: Zoom Video Communications (ZM) provides video conferencing and unified communications solutions.
Technical status: Zoom Video Communications (ZM) failed to hold its post-earnings breakout and pulled back into its longstanding consolidation range.
Trade commentary: ZM just cannot break out. The stock gained 10% post-earnings and was up as much as 20% or so, but then faded hard. I stepped in and bought some shares. This time I plan to just sit on the position instead of getting thrown for loops with the bouncing within the trading range. At some point the company’s pile of cash and low valuation will motivate investors to push the stock into a breakout.
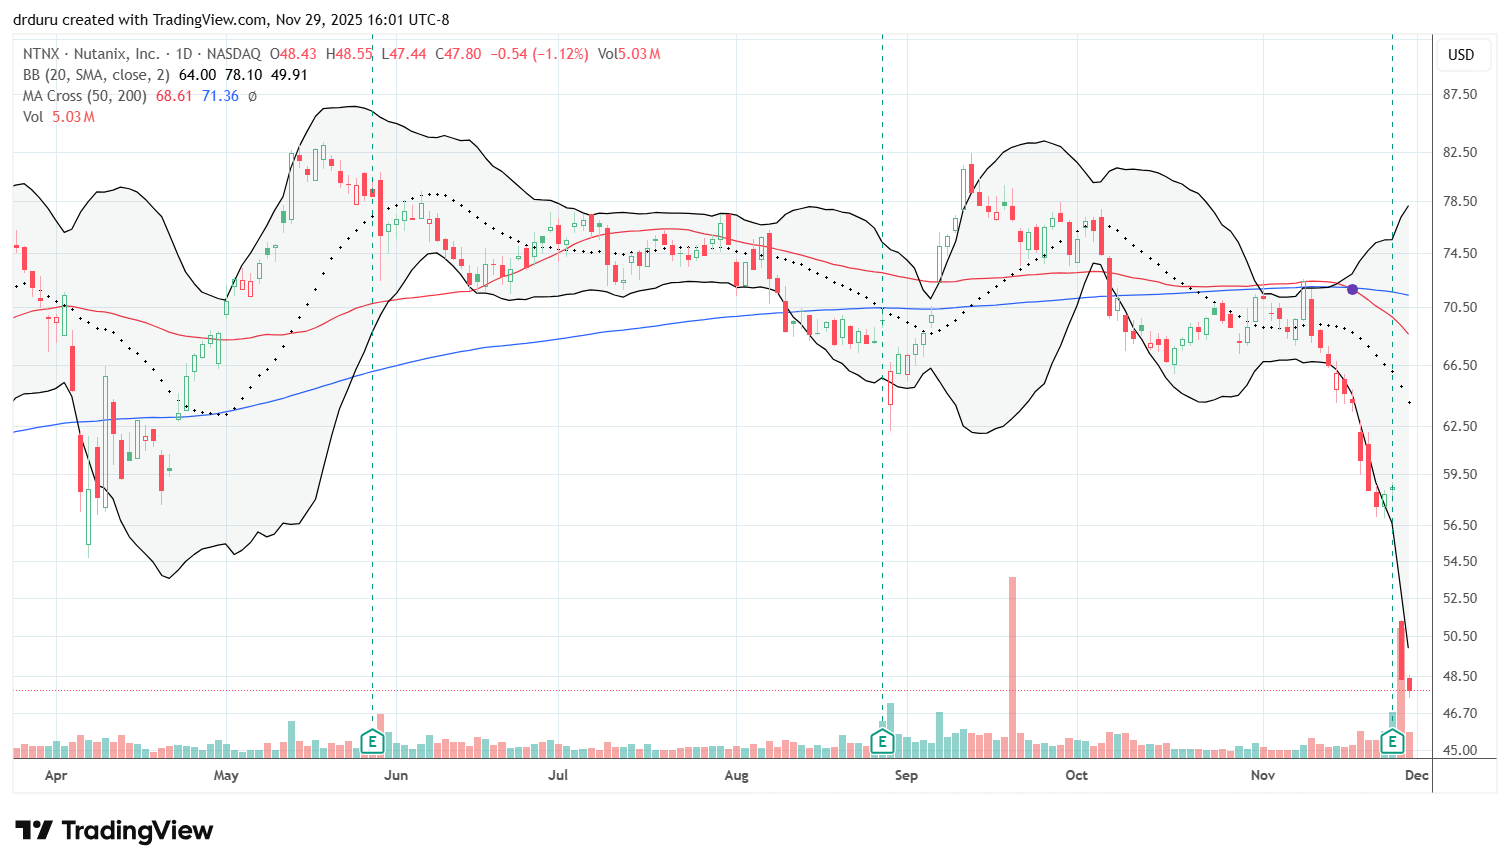
Nutanix (NTNX)
Description: Nutanix (NTNX) offers enterprise cloud software and hyperconverged infrastructure solutions.
Technical status: Nutanix (NTNX) plunged 17.8% post-earnings and returned to levels last seen in summer 2024 after shifting revenue timing spooked investors.
Trade commentary: NTNX collapsed 17.8% post-earnings after the company said it had to shift some revenue forward. Analysts hate such news and typically assume business is slowing no matter what assurances the company gives (like in this case). I see this panic as a long-awaited buying opportunity. Accordingly, I sold a December $45 put option as a starter position.
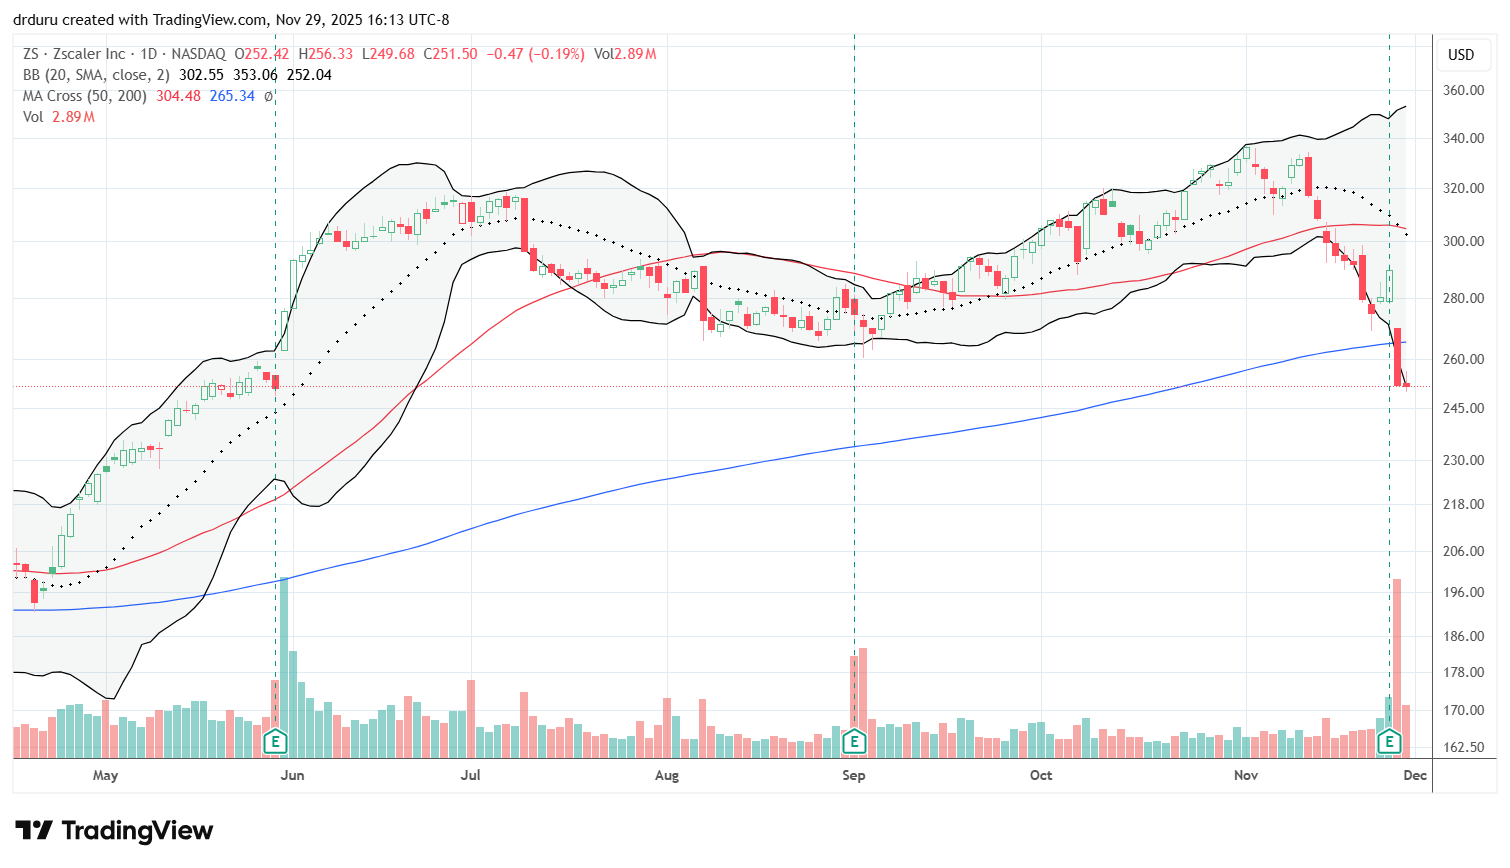
Zscaler (ZS)
Description: Zscaler (ZS) provides cloud-based cybersecurity services.
Technical status: Zscaler (ZS) broke sharply below its 200DMA after a 13.0% post-earnings loss and continued trading slightly lower on Friday.
Trade commentary: ZS surprised me. I tried a pre-earnings iron condor, expecting, at worst, a move to the 200DMA. Instead, it cleaved right through and lost 13%. Sellers nudged it lower. I would buy only if it closed back above the 200DMA. The fact that it had twice failed before reaching its all-time high was ominous.
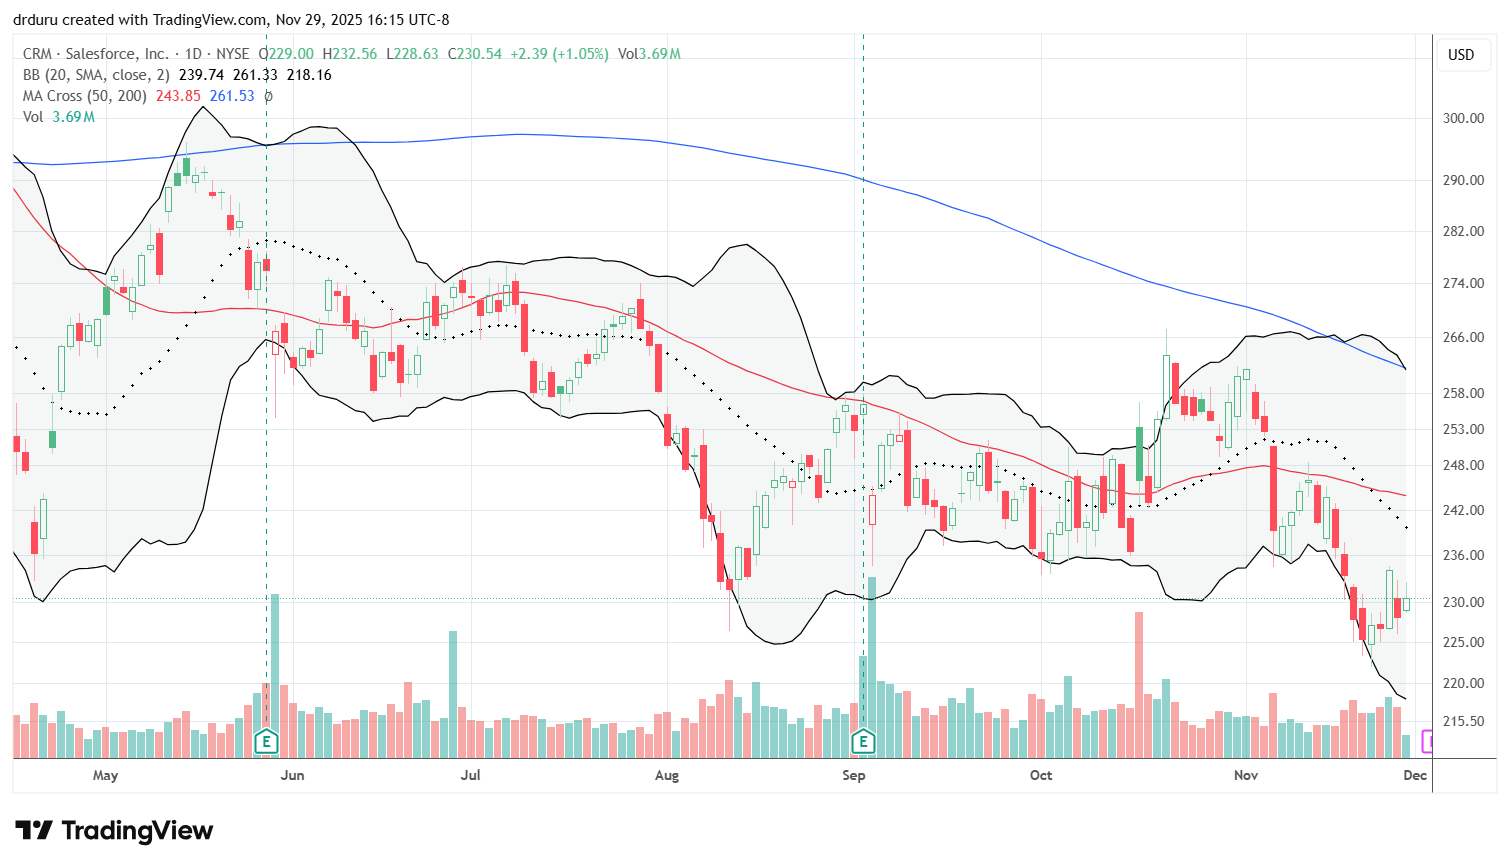
Salesforce (CRM)
Description: Salesforce (CRM) develops customer relationship management software and enterprise cloud applications.
Technical status: Salesforce (CRM) traded near year-to-date lows and continues to show persistent weakness.
Trade commentary: CRM continues to be suspiciously weak. The stock was trading around lows of the year and had not been this low since summer 2024. If this weakness continues into 2026, CRM could become dead money and eventually drag down a good portion of the enterprise software sector through valuation compression.
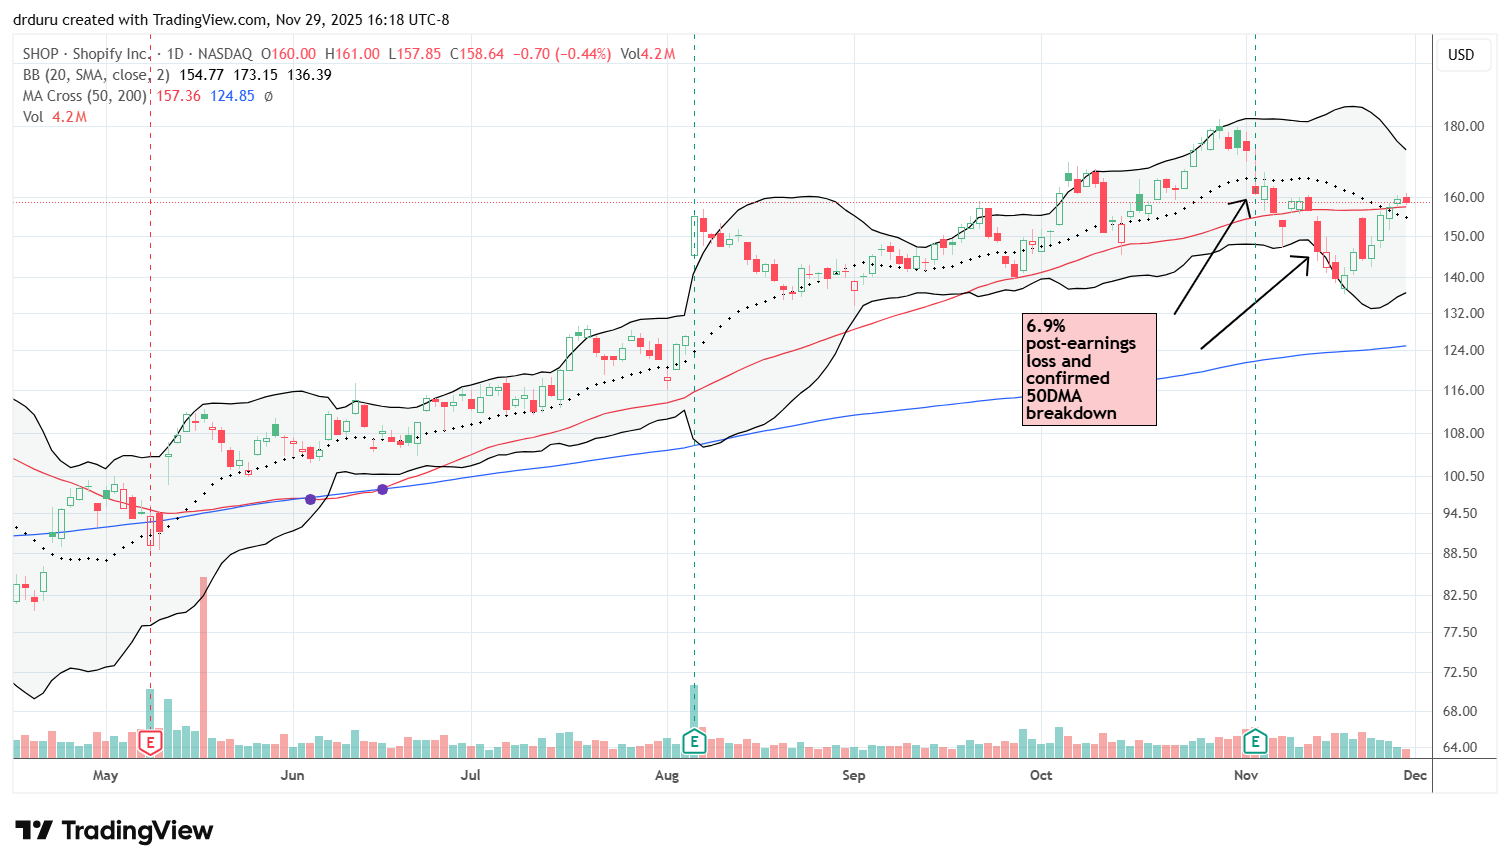
Shopify (SHOP)
Description: Shopify (SHOP) provides e-commerce software and services for online merchants.
Technical status: Shopify (SHOP) rebounded back above its 50DMA after confirming a breakdown earlier in the month.
Trade commentary: SHOP has been a tricky trade. After earnings, I traded for a defense of 50DMA support. That trade quickly failed. SHOP is finally above its 50DMA again, and I am trying a bullish trade for at least a closing of the post-earnings gap down. I jumped in with a $165/$175 call spread expiring in December.
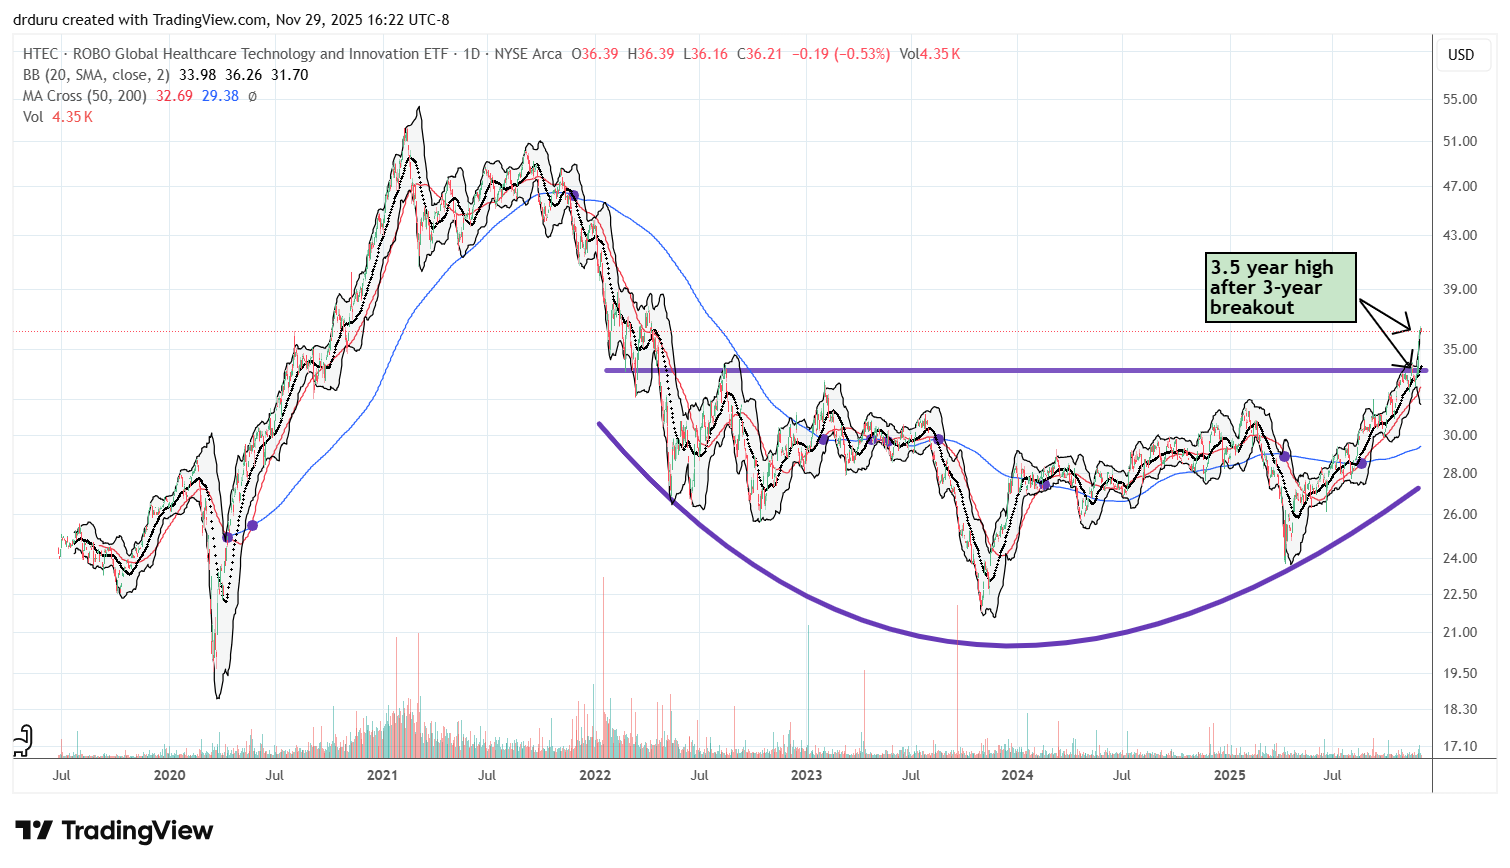
Robo Global Healthcare Technology and Innovation ETF (HTEC)
Description: The Robo Global Healthcare Technology and Innovation ETF (HTEC) invests in companies focused on healthcare innovation and medical technologies.
Technical status: The Robo Global Healthcare Technology and Innovation ETF (HTEC) broke out to a three-and-a-half-year high and confirmed a multi-year bottoming pattern.
Trade commentary: HTEC is one of my favorite ETFs. It has a classic bowl-shaped bottom years in the making that has allowed me to accumulate on the cheap while healthcare was out of favor or neglected in favor of flashy AI plays. HTEC’s breakout to a three-and-a-half-year high confirms the bottom.
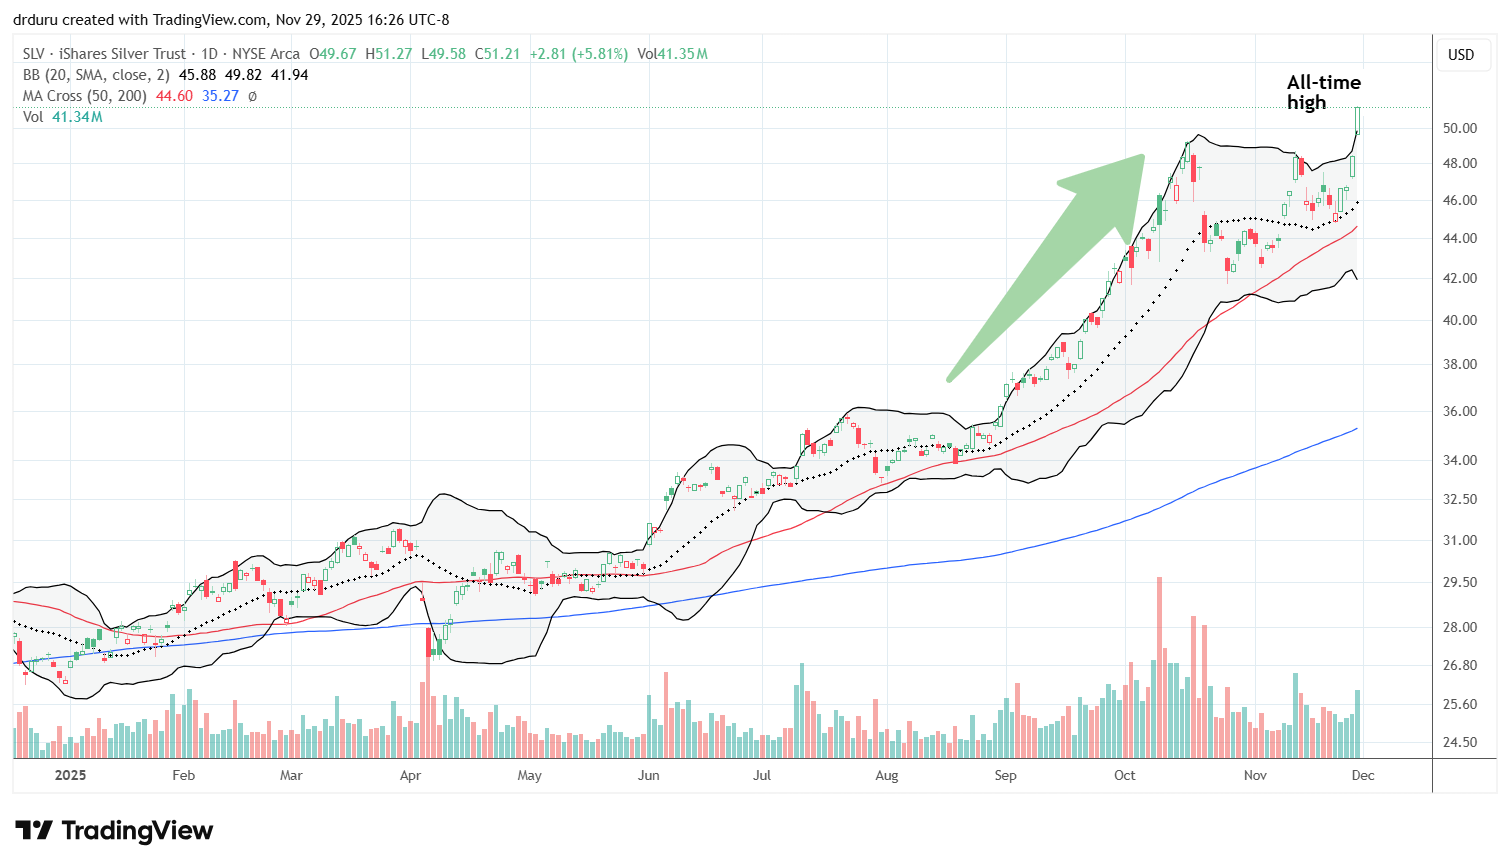
Silver / iShares Silver Trust (SLV)
Description: The iShares Silver Trust (SLV) holds physical silver to reflect the price performance of the silver commodity.
Technical status: The iShares Silver Trust (SLV) broke out to a fresh all-time high as the market anticipates Federal Reserve rate cuts.
Trade commentary: SLV broke out to a fresh all-time high. The ETF of the precious metal confirms my expectation of a December rate cut from the Federal Reserve. I suspect the Fed will try to jawbone its way out of an inflation problem while cutting rates as “insurance” for the labor market. Consumers are clearly spending just as enthusiastically as ever, so rate cuts into a strong economy carry inflation risks that the Fed will need to ignore in order to satisfy the financial market’s cravings. Meanwhile, I completely missed the perfect buying opportunity at 20DMA support!
")
")
Be careful out there!
Footnotes
Subscribe for free to get email notifications of future posts!
“Above the 50” (AT50) uses the percentage of stocks trading above their respective 50-day moving averages (DMAs) to measure breadth in the stock market. Breadth defines the distribution of participation in a rally or sell-off. As a result, AT50 identifies extremes in market sentiment that are likely to reverse. Above the 50 is my alternative name for “MMFI” which is a symbol TradingView.com and other chart vendors use for this breadth indicator. Learn more about AT50 on my Market Breadth Resource Page. AT200, or MMTH, measures the percentage of stocks trading above their respective 200DMAs.
Active AT50 (MMFI) periods: Day #116 over 20%, Day #5 over 30%, Day #3 over 40%, Day #2 over 50% (overperiod), Day #47 under 60% (underperiod), Day #89 under 70%
Source for charts unless otherwise noted: TradingView.com
Full disclosure: long IWM shares, long SPY put spreads, long FUN, long MU call spread, long ZM, short NTNX put, long SHOP call spread, long HTEC
FOLLOW Dr. Duru’s commentary on financial markets via StockTwits, BlueSky, and even Instagram!
*Charting notes: Stock prices are not adjusted for dividends. Candlestick charts use hollow bodies: open candles indicate a close higher than the open, filled candles indicate an open higher than the close.
* Blog notes: this blog was written based on the heavily edited transcript of the following video that includes a live review of the stock charts featured in this post. I used ChatGPT to process the transcript.