Stock Market Commentary
This week brought a return of market calm across the stock market following a sharp but brief trade-induced shock. The episode began with President Trump’s threat of significant tariffs on Europe (and foreign-made iPhones), which rattled the market. However, that fear evaporated after Trump walked back his threats with a 90-day pause (is 90 a favorite number?), sparking a major rebound perfectly off support to start the trading week (shortened by the Memorial Day holiday). However, buyers lacked momentum to push higher, and sellers could not gain traction. The resulting drift in prices came to a head on Friday after renewed trade concerns over Nvidia chips over-shadowed good inflation news. Yet, the buyers and bulls won the day with a firm bounce off intraday lows. The dust settled on a market sitting within established ranges and a return to overall market calm.
I thought the market had been in a good place to ignore trade noise again, as it had for a while before last week’s temporary panic. The quick return to calm has brought with it the viral Wall Street meme called the “TACO trade” – suggesting a new level of indifference to tariff drama.
The Stock Market Indices
S&P 500 (SPY)
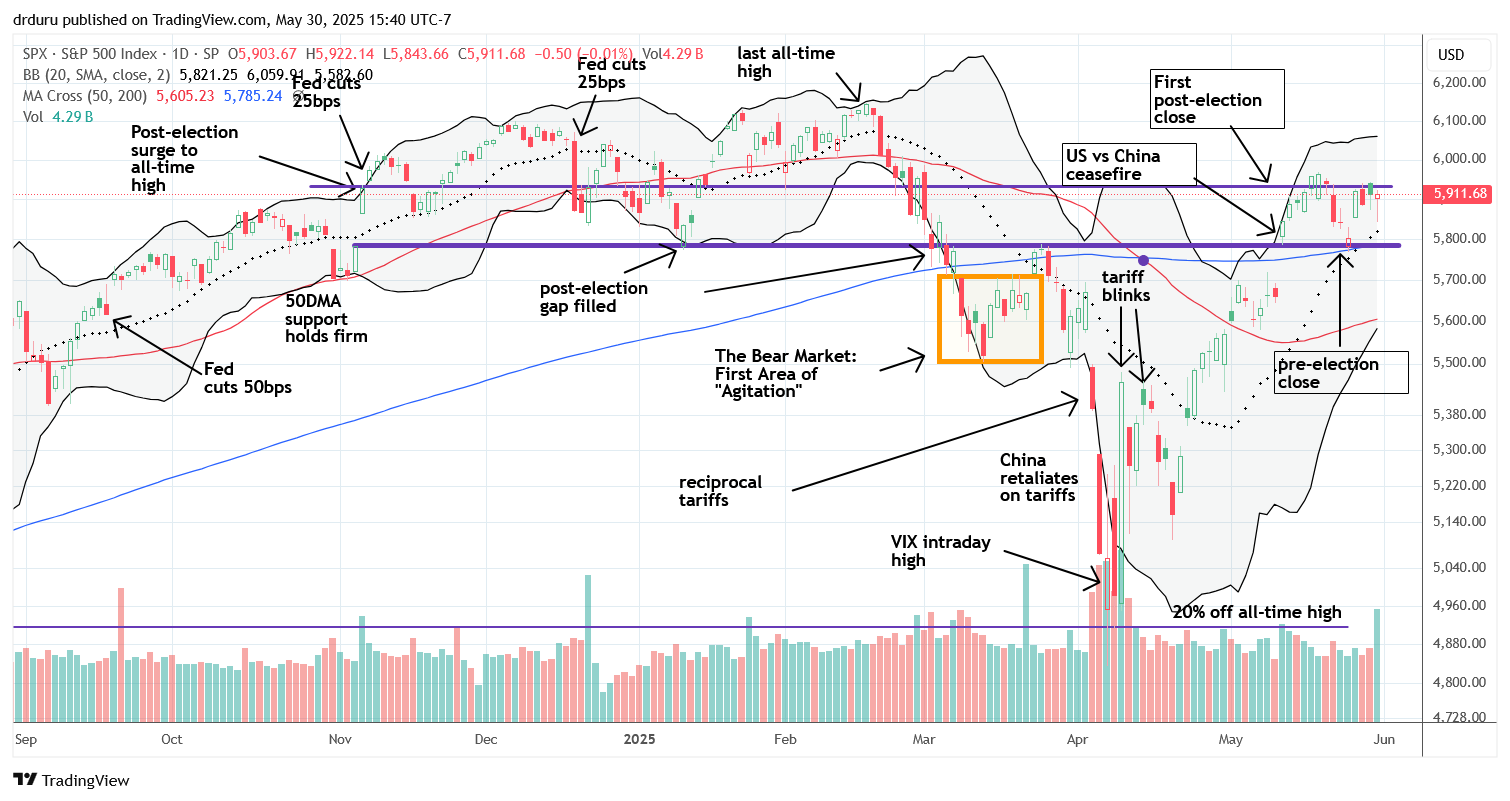
The S&P 500 (SPY) responded to the tariff shock by dropping precisely to support converged its 200-day moving average (DMA) (the blue line) and the price level from the close on election day. For the past two and a half weeks, SPY has traded between its election-day (or pre-election) close and its post-election close.
I successfully traded the rebound from 200DMA support but did not short the rejection at the top of the range because I remain cautiously bullish. A breakout above 5932 opens the door to retesting all-time highs, while a breakdown below 5788 turn me neutral. I will not shift to bearish unless SPY falls below its 50DMA (the red line), an event which would in turn risk a retest of the April lows.
NASDAQ (COMPQ)
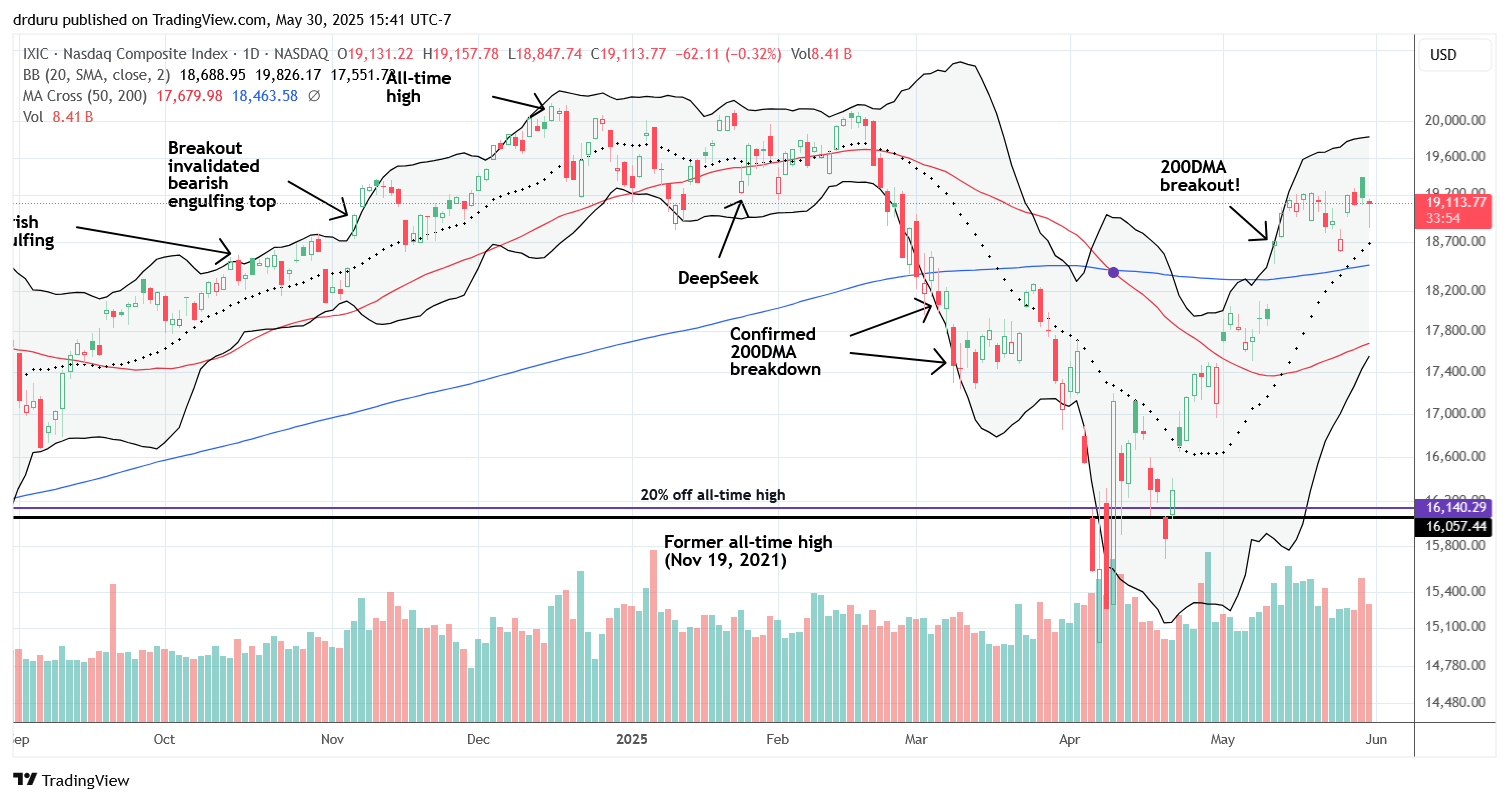
The NASDAQ had a similar trajectory to SPY. The tech-laden index broke above its prior high early in the week but sellers immediately faded the NASDAQ back into its trading range. While bears could interpret this fade as a sell signal, I am not trading the downside at this juncture – I am watching for a decisive breakout or breakdown before taking action.
iShares Russell 2000 ETF (IWM)
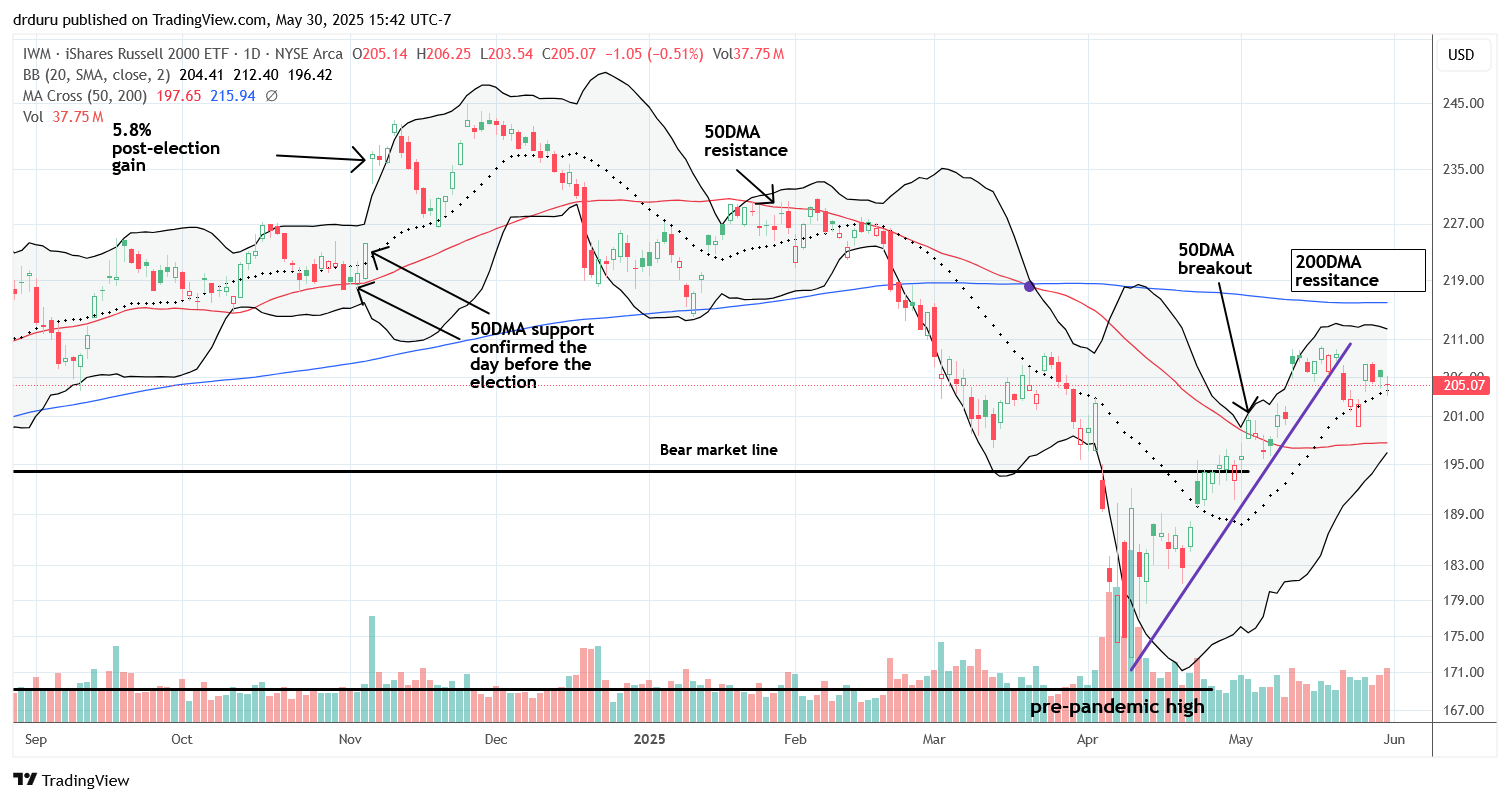
IWM briefly dipped below its 20DMA (the dotted line) last week but managed a 2.5% pop to start the week of market calm. The ETF of small caps next drifted lower, holding its 20DMA support into Friday. I was hesitant to buy calls this time around, as my last call option trade did not work. I suspect IWM may revisit its 50DMA at 197.68 before attempting a further bounce or challenge of its 200DMA resistance.
The Short-Term Trading With Market Calm
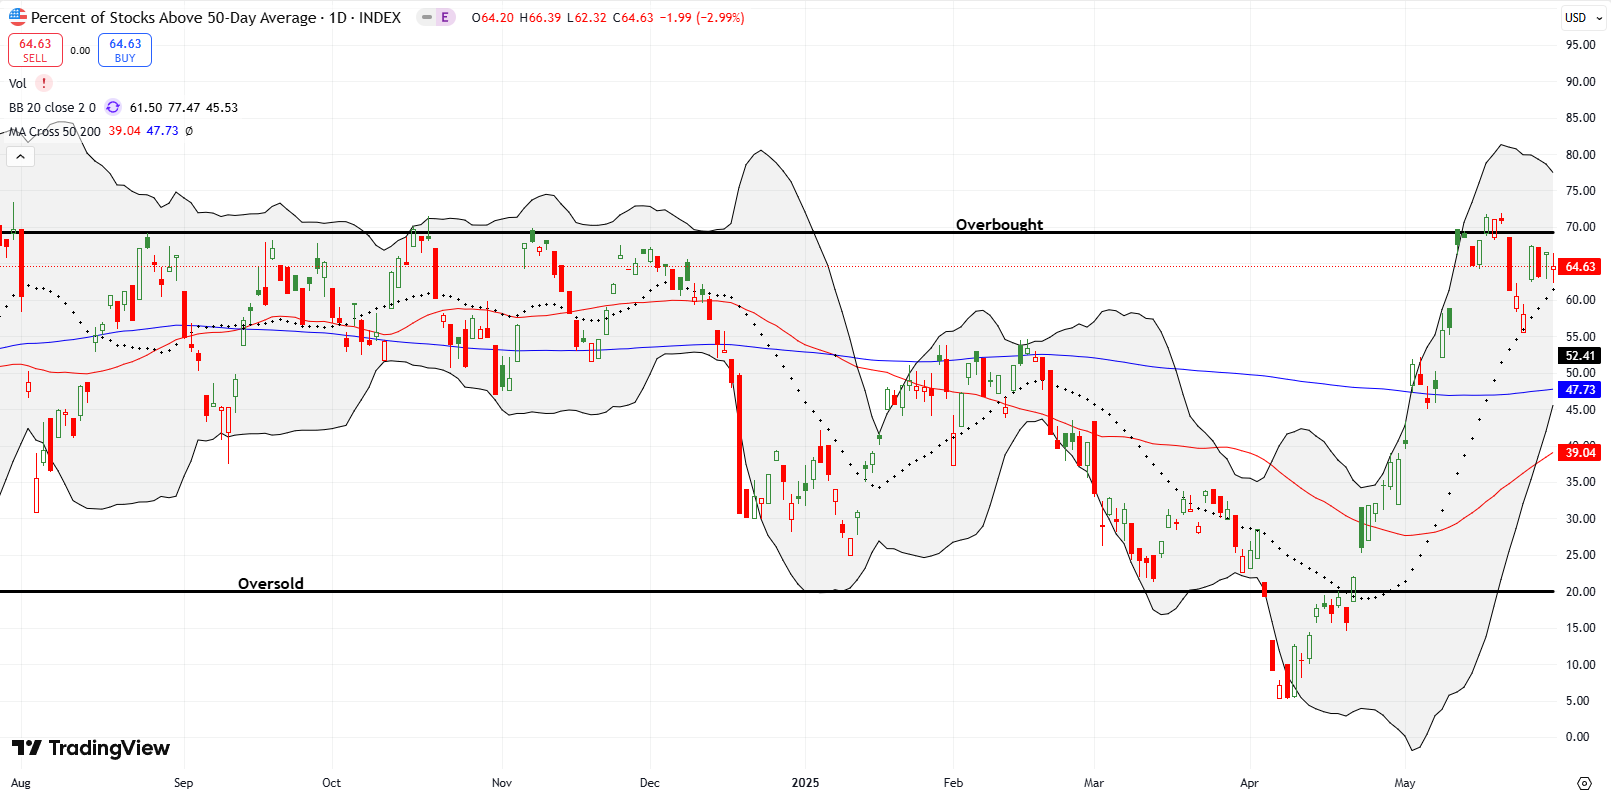
- AT50 (MMFI) = 64.6% of stocks are trading above their respective 50-day moving averages
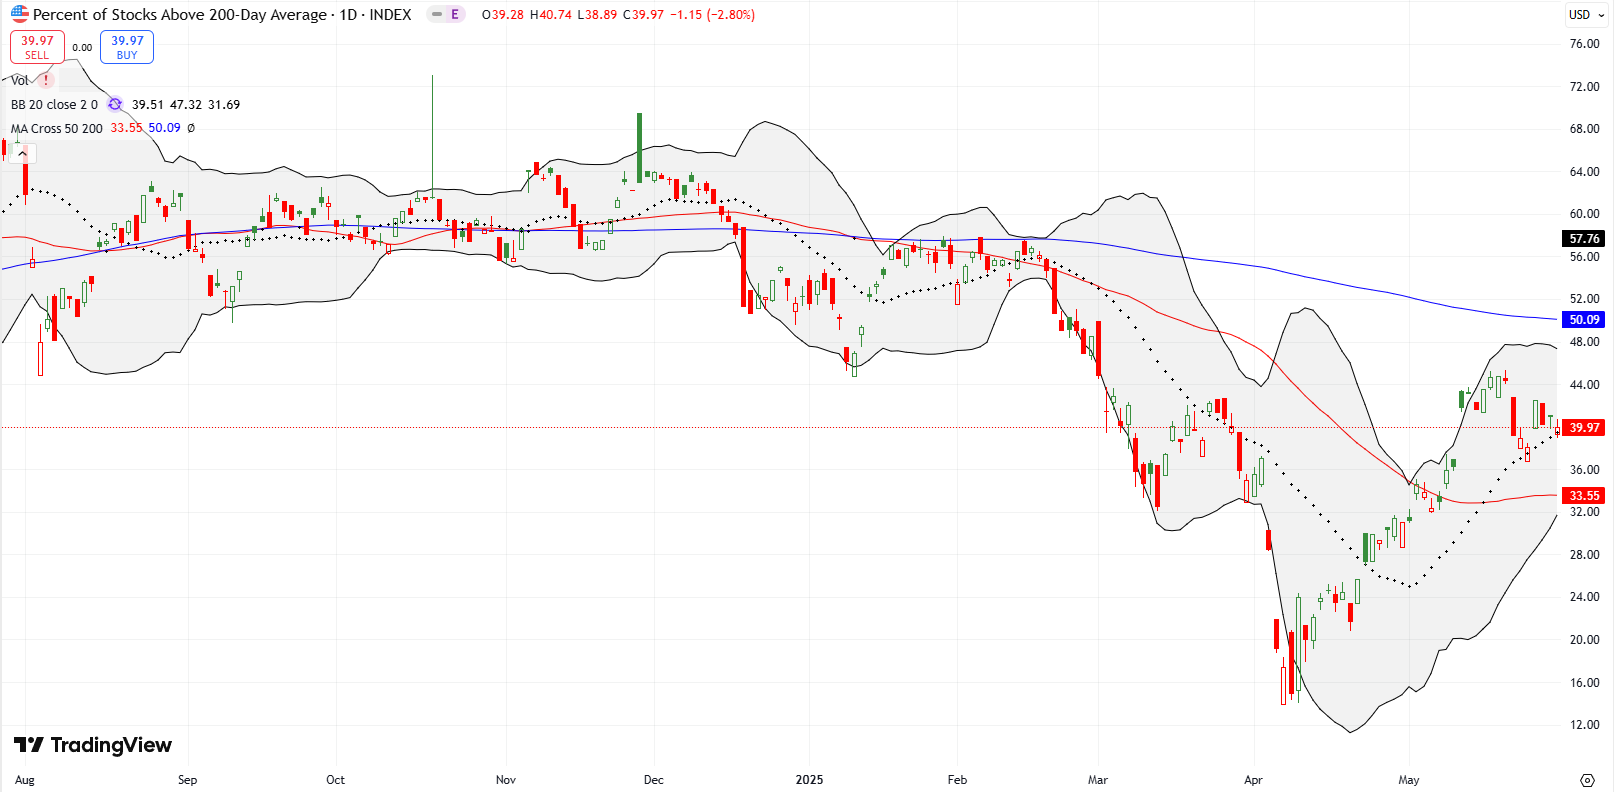
- AT200 (MMTH) = 40.0% of stocks are trading above their respective 200-day moving averages
- Short-term Trading Call: cautiously bullish
AT50 (MMFI), the percentage of stocks trading above their 50DMAs, jumped off a key support line, but, like the indices, made no further progress for the rest of the short trading week. My favorite technical indicator took a dip on Friday along with the indices, but it too reversed course by the close. Although AT50 continues to struggle at overbought resistance, strong underlying support remains. Thus, on balance, my short-term trading calls stays at cautiously bullish.
The Volatility Index (VIX)
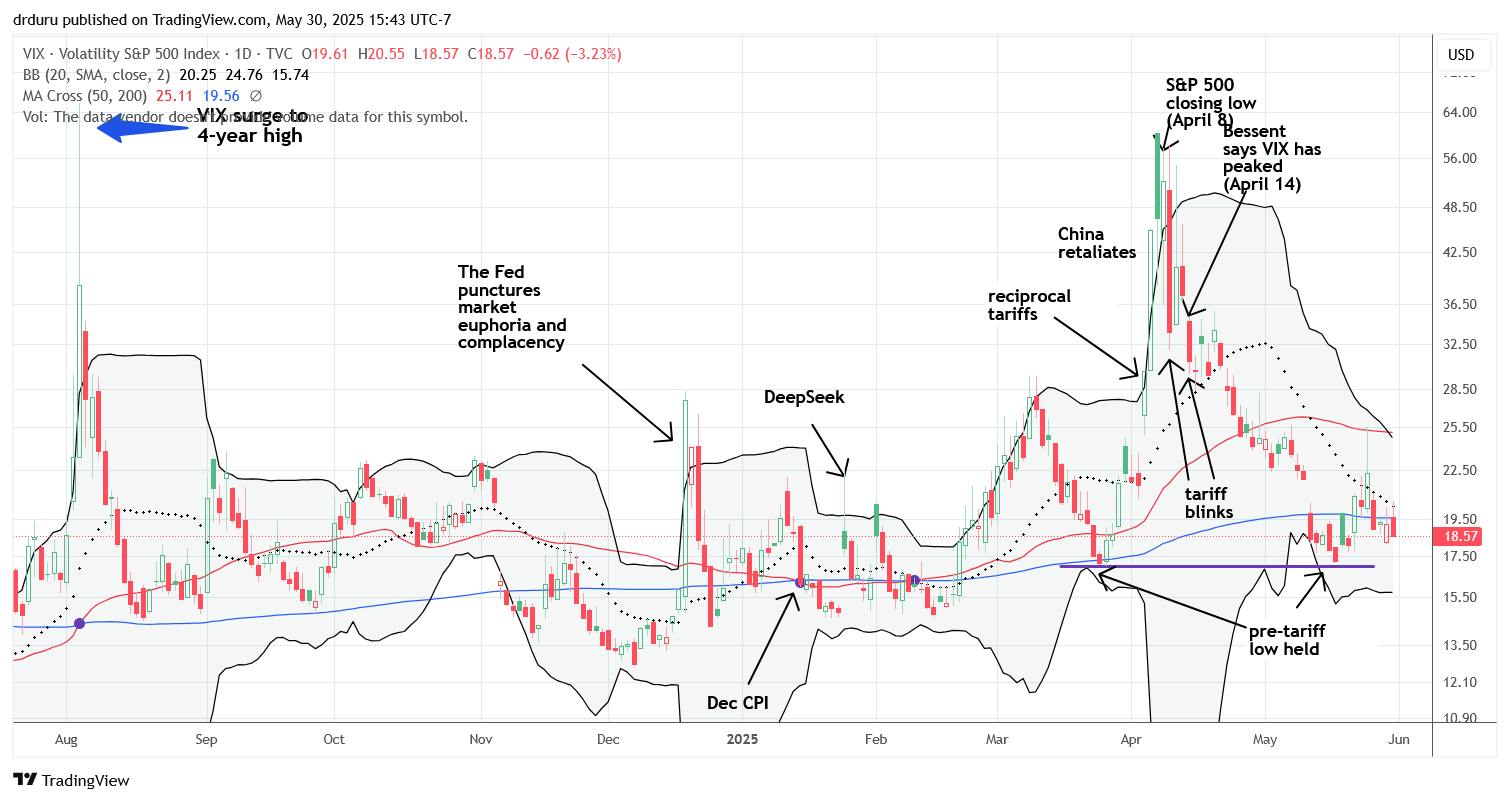
The VIX surged to nearly 26 on the tariff news, matching its previous high. I missed the clear opportunity to fade that move even though I went long SPY call spreads. Going forward, I will carefully watch that resistance line. I am cautious as the VIX drifts downward to the support line that held last month. A breakdown below that support would reinforce the current market calm.
The Equities: Market Calm
NVIDIA Corp (NVDA)
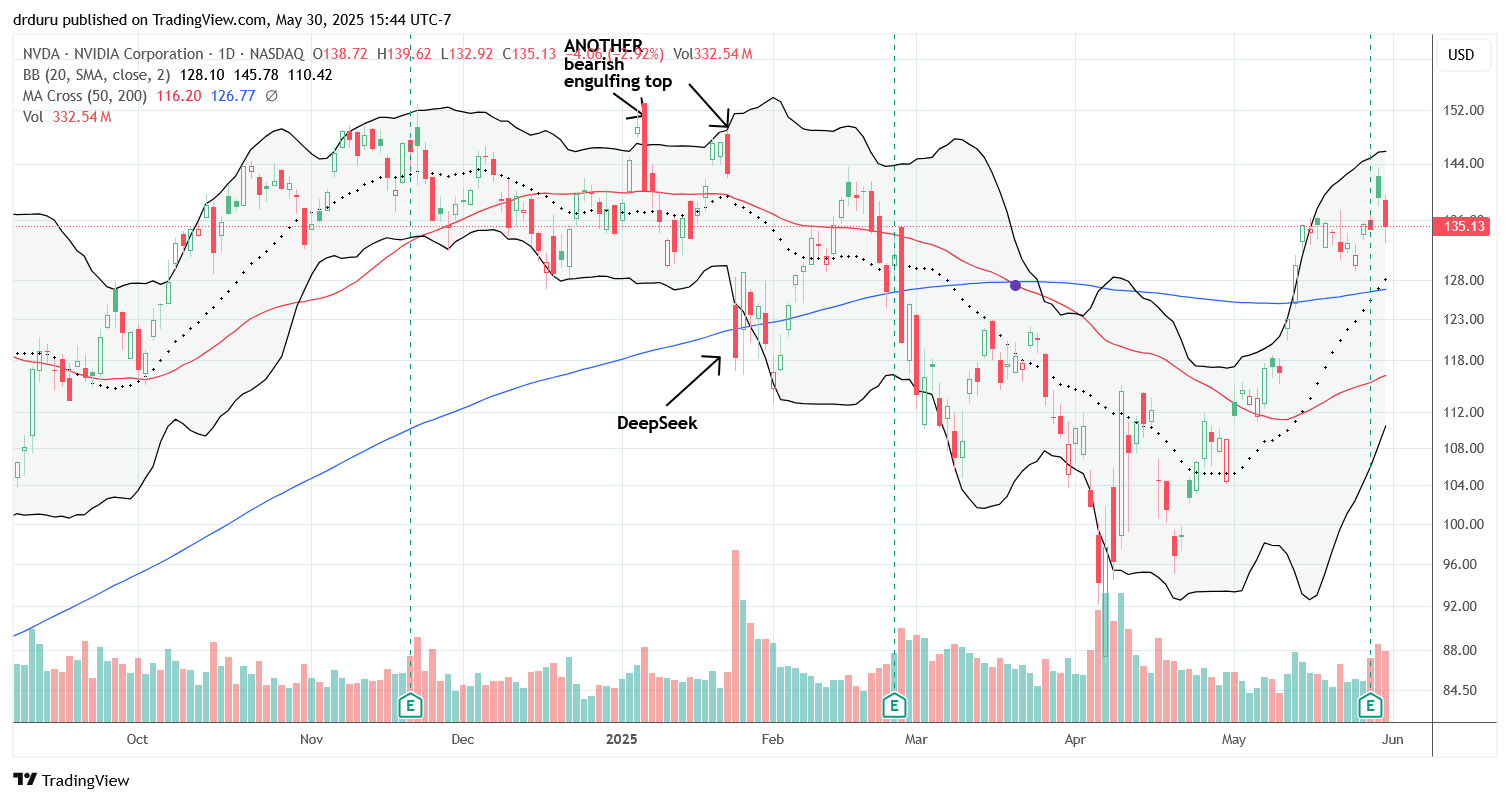
Nvidia posted a 3.3% gain after reporting earnings, opening with a gap up but reversing hard. I used a calendar call spread, betting against next-day call buyers, but Friday’s reversal—caused by renewed export restriction headlines—wrecked the trade. Ironically, NVDA’s fade aligns with my earlier thesis that NVDA would remain under a double bearish engulfing topping pattern for an extended period of time. Technically, NVDA remains bullish above its 50DMA and 200DMA, but I do not expect another breakout soon.
Credo Technology Group Holding Ltd (CRDO)
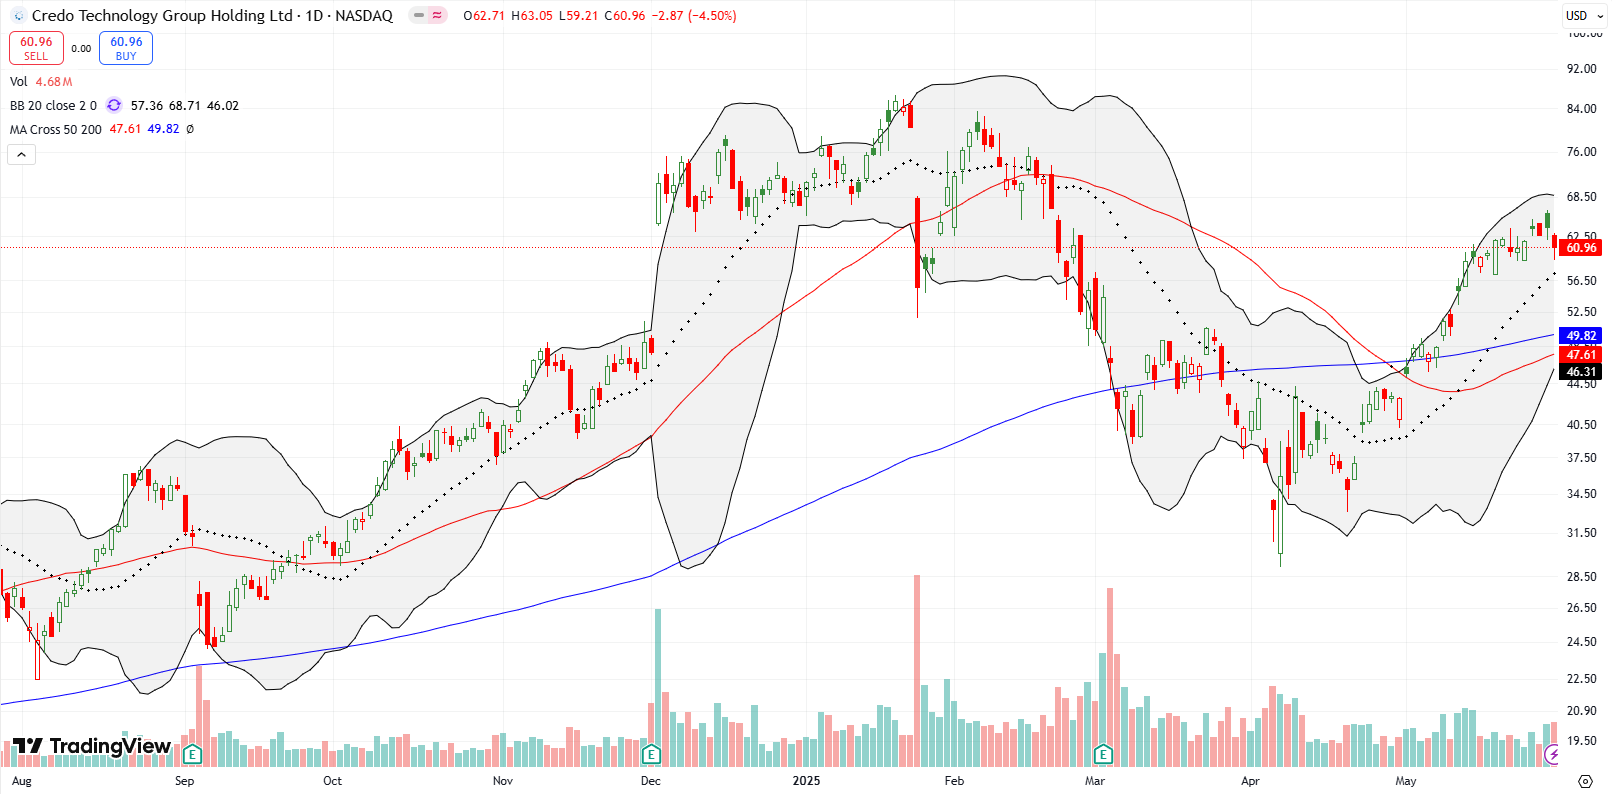
CRDO broke out above its 200DMA, becoming one of my best recent bullish calls. Now I am nervous heading into next week’s earnings and do not plan to hold through the report. My goal reflects a desire to manage risks after such a strong showing; I worry more about a major reversal of these profits than look excitedly to the prospect of a fresh push toward the previous highs.
Vertiv Holdings Co (VRT)
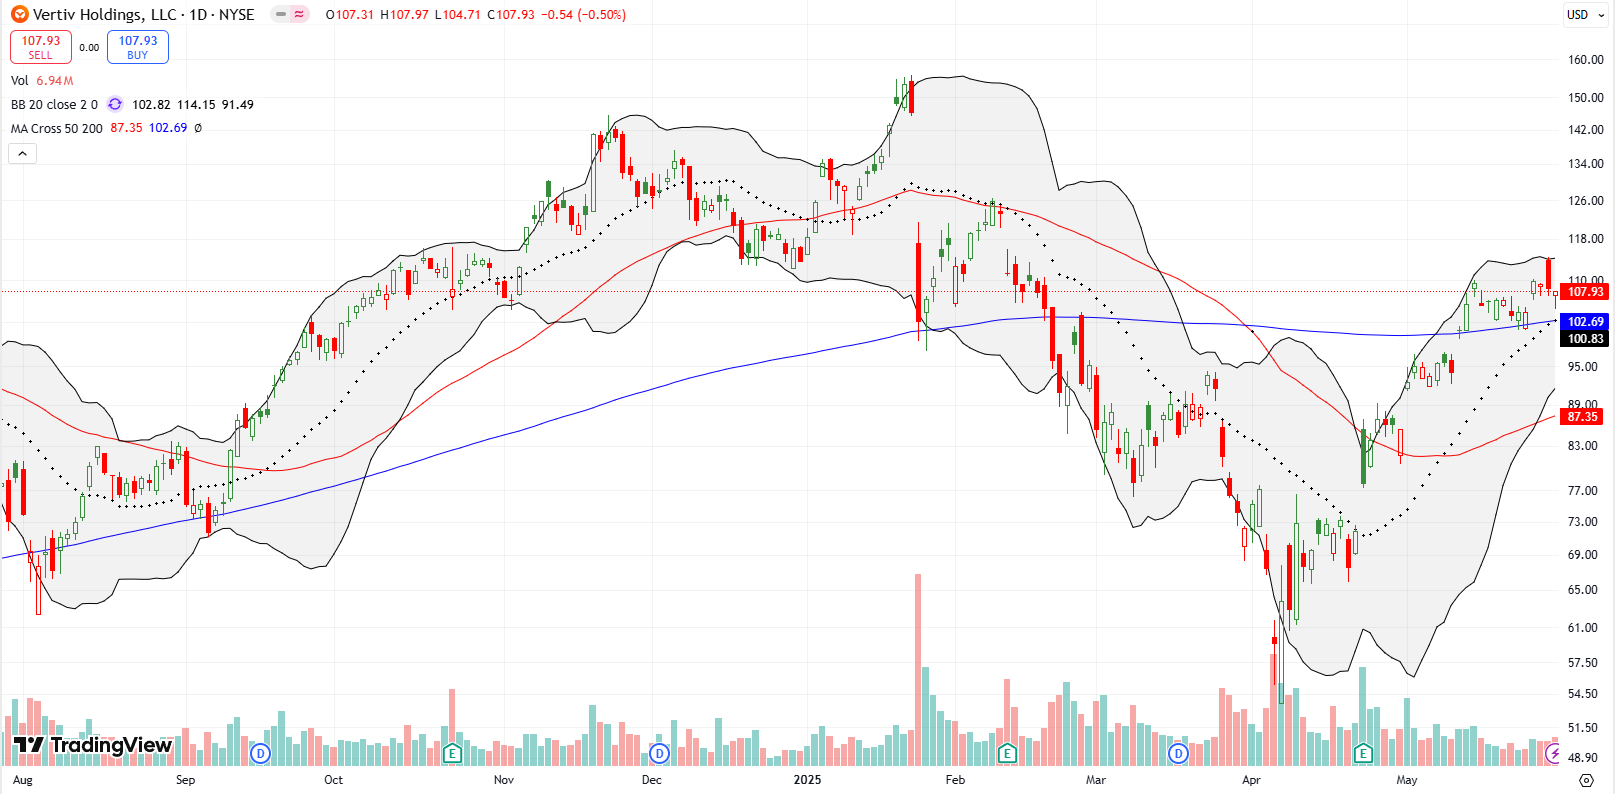
VRT is one of my top AI-related pick. The stock remains bullish, holding above its 200DMA support at $102.46. After a failed breakout, the stock reached for converged support at its 200DMA and 20DMA. I am hoping to buy on a successful test of that support.
IONQ Inc (IONQ)
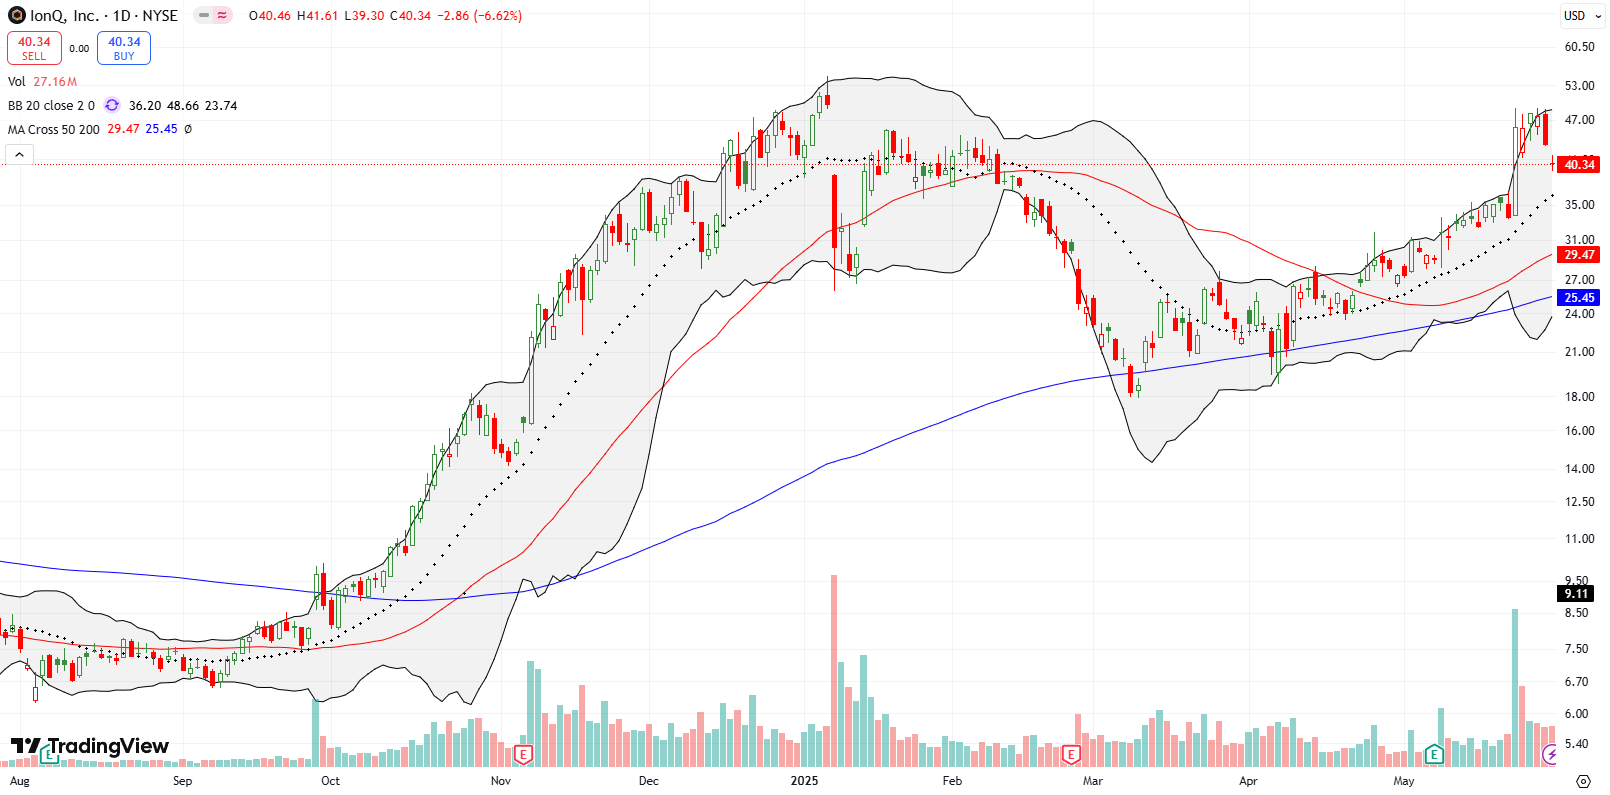
IONQ surged 36.5% recently but is now pulling back just under all-time highs. Despite the mild bearish implications of this fade, the 20DMA holds itself out as support. I plan to re-enter an IONQ trade on retests of 20DMA, 50DMA, or even 200DMA as needed.
Fair Isaac Corp (FICO)
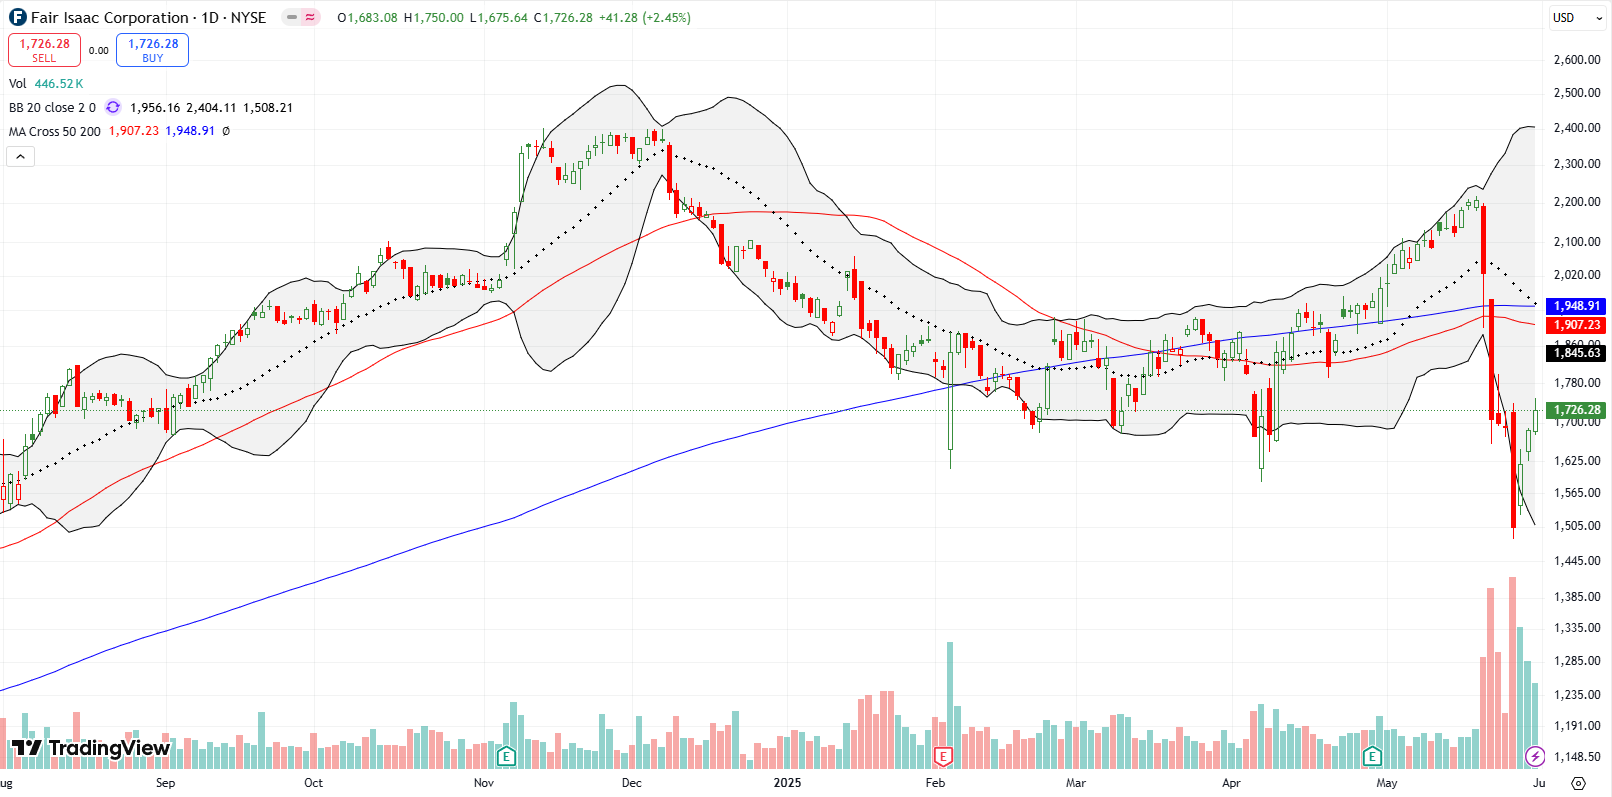
FICO is already back on the docket as it pulled a perfect V-move last week. I failed to take profits early on FICO after it declined 8%, then a 16% finished wiping out my profits. I had to stop out in the middle of the 11.3% drop that opened the week. As I discussed a week ago, I was on alert to bail on FICO given what could be a risk of a major topping pattern and extended decline. The stock seemed overdone to the downside based on complaints from the FHFA director about the high cost of credit scores, but I had to respect the technicals.
That deference applies on the way down and on the way up. After I bought back into my former position over the last 2 days after buyers followed up the first day of a rebound. Still, the stock is below both 50DMA and 200DMA, so risk remains that the sellers will soon be able to push FICO to new lows. If so, I will just have to give up on the stock until it returns to bullish positioning (above its 200DMA).
Uber Technologies Inc (UBER)
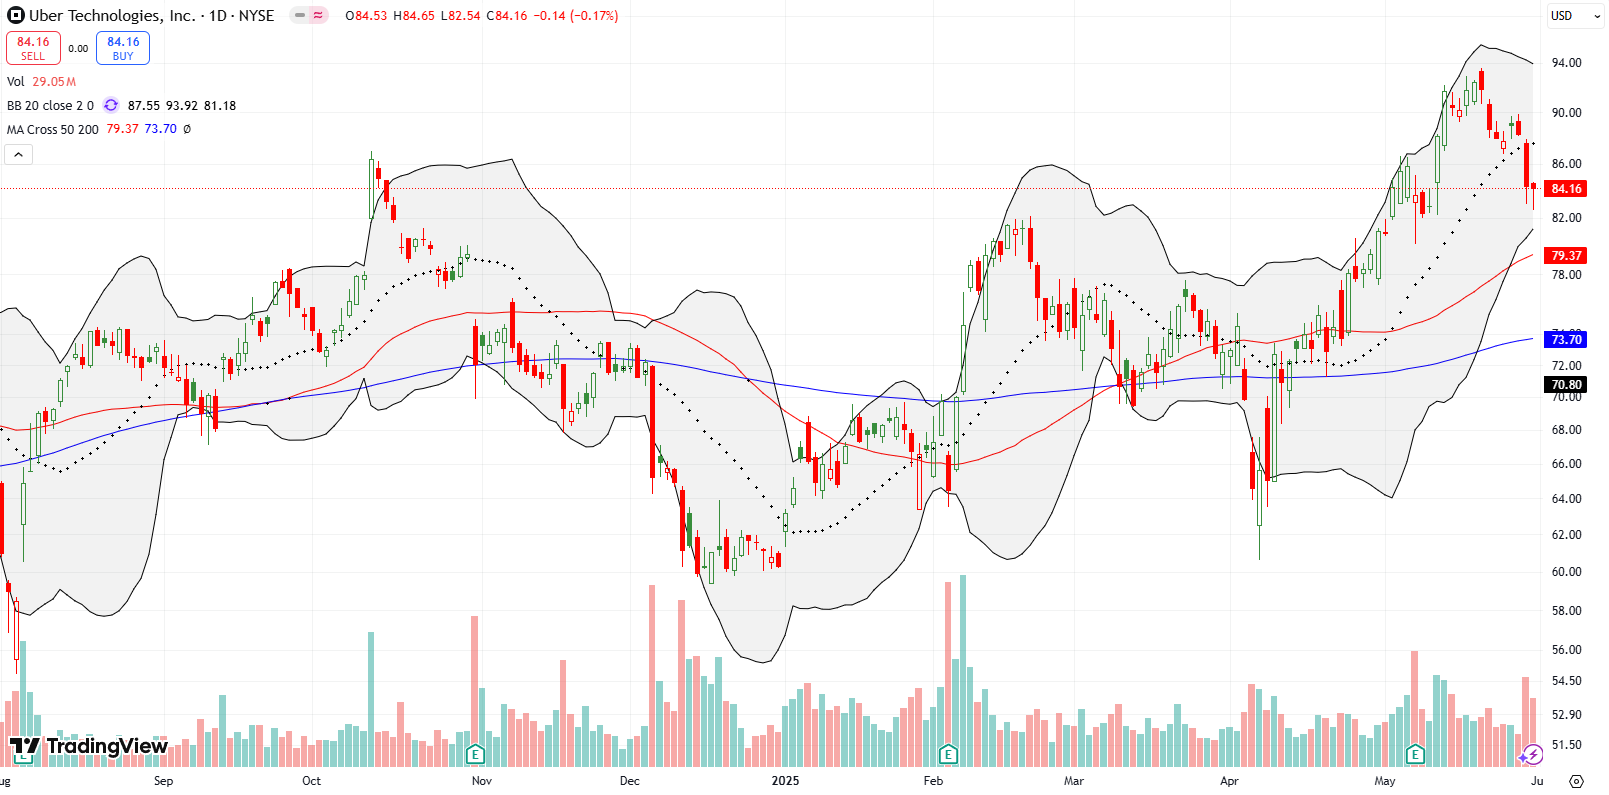
UBER dropped again on robo-taxi headlines. Somehow the stock managed to pullback on rehashed robotaxi headlines (LYFT as well). This dip is exactly what I wanted to see when last month I claimed UBER is a buy on the dips.
Best Buy Co Inc (BBY)
BBY posted a bearish breakdown after earnings, confirmed by follow-through selling. I have not yet reviewed earnings, but the technicals speak loudly: BBY is a short until/unless it breaks out above its 50DMA again.

Brinker International Inc (EAT)
Casual-dining restaurant company EAT reversed a 14.8% post-earnings loss from April. The stock recovered in a strong bullish pattern with a 50DMA breakout and subsequent successful test of converged 20DMA and 50DMA support. Now with EAT breaking out above the last high, the stock is in full bullish form. I plan to buy gradually, especially on a pullback to ~163–164 around the previous high.
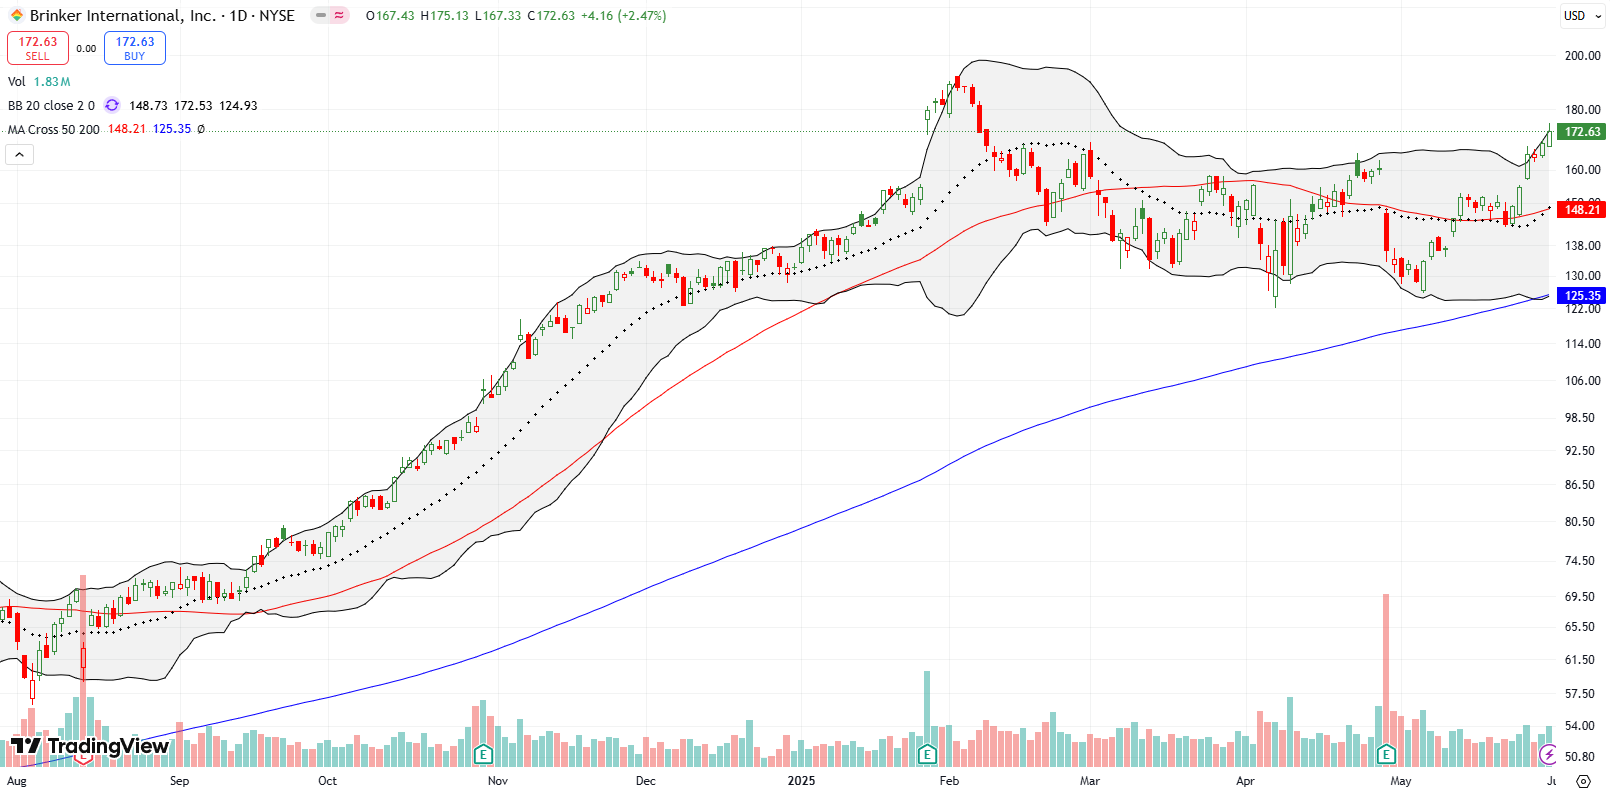
Brinker International Inc (EAT) remained above the 50DMA for its longest stretch since late February, confirming support as it heads towards its all-time high.
Be careful out there!
Footnotes
Subscribe for free to get email notifications of future posts!
“Above the 50” (AT50) uses the percentage of stocks trading above their respective 50-day moving averages (DMAs) to measure breadth in the stock market. Breadth defines the distribution of participation in a rally or sell-off. As a result, AT50 identifies extremes in market sentiment that are likely to reverse. Above the 50 is my alternative name for “MMFI” which is a symbol TradingView.com and other chart vendors use for this breadth indicator. Learn more about AT50 on my Market Breadth Resource Page. AT200, or MMTH, measures the percentage of stocks trading above their respective 200DMAs.
Active AT50 (MMFI) periods: Day #28 over 20%, Day #26 over 30%, Day #21 over 40%, Day #16 over 50%, Day #4 over 60%, Day #7 under 70%
Source for charts unless otherwise noted: TradingView.com
Full disclosure: long IWM shares, long FICO, long NVDA calls, long CRDO, long VRT shares and short call
FOLLOW Dr. Duru’s commentary on financial markets via StockTwits, BlueSky, and even Instagram!
*Charting notes: Stock prices are not adjusted for dividends. Candlestick charts use hollow bodies: open candles indicate a close higher than the open, filled candles indicate an open higher than the close.
* Blog notes: this blog was written based on the heavily edited transcript of the following video that includes a live review of the stock charts featured in this post and more. I used ChatGPT to process the transcript.
