
Stock Market Commentary
The trading week started with a powerful jolt to the market. The major catalyst was a rumor that President Trump was considering a 90-day delay on tariffs, triggering a nearly 30-minute, $2.5 trillion rally. While ultimately unfounded, the rumor represented the kind of response markets expect: when financial markets panic, policy-makers panic. The subsequent government intervention creates the basis for a sustainable low…and in the most dramatic cases an ultimate bottom. I see the early signs of a sustainable low given the S&P 500 and the NASDAQ held much of their post-rumor gains into the close. Moreover, I found green shoots in a number of bullish engulfing patterns at the end of downtrends. I will explain this celebrated bottoming pattern below.
The Stock Market Indices
S&P 500 (SPY)
The S&P 500 (SPY) narrowly avoided a deeper collapse, buoyed by buying interest even after the rumor was debunked. The index tested the conventional definition of a bear market with a 20% drawdown from its all-time high but managed to finish the day with just a 0.2% loss. Recall that I consider the declaration of a conventional bear market the beginning of the end of a period of selling. The S&P 500 is the last of the major indices to trigger this call. Still, as planned, I bought a fresh “disaster” hedge put spread on the S&P 500: a September 460/430 put that hit my buy limit as the rally reached its high of the day.
")
NASDAQ (COMPQ)
The NASDAQ plunged as low as 15,000, falling well below my previously defined downside risk target. This level represents a complete wipeout of gains made since the start of 2024. Despite the dramatic drop, the index managed to claw back to a near flat close. The tech-laden index still closed well-below its lower Bollinger Band (BB) (the black line) and thus remains extremely stretched to the downside.
")
The iShares Russell 2000 ETF (IWM)
Small caps remained weak, with IWM losing almost 1%. This underperformance weighed heavily on market breadth. The pre-pandemic high for this ETF of small caps now appear within reach, pointing to persistent downside risk.
")
The Short-Term Trading Call With A Green Shoots
- AT50 (MMFI) = 7.1% of stocks are trading above their respective 50-day moving averages (Day #3 oversold)
- AT200 (MMTH) = 17.4% of stocks are trading above their respective 200-day moving averages
- Short-term Trading Call: bullish
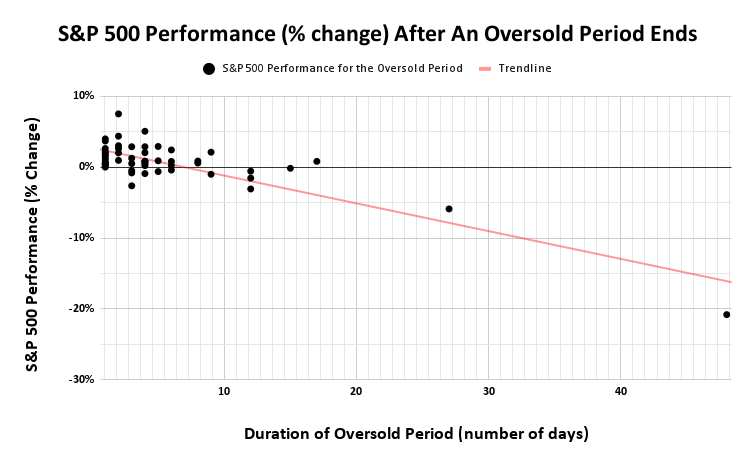
AT50 (MMFI), the percentage of stocks trading above their 50-day moving averages, dropped nearly 2 percentage points to 7.1%. At its lows of the day, my favorite technical indicator dropped to 5.3%! AT50 was last this low, almost exactly 5 years ago in the immediate wake of the start of the COVID-19 pandemic. Although buyers attempted to stem the tide of selling in the major indices, the market breadth indicators still closed notably down, likely thanks to the weakness in small caps. This third consecutive oversold day means the market’s coil is wound tighter even as the prospects diminish for gains coming out of the oversold period. Yet, the S&P 500 is now down 6.2% for the oversold period. So even a 1% gain coming out of the oversold period would represent a significant return for short-term trades.
The AT200 (MMTH), the percentage of stocks trading above their 200DMAs, fell to 17.4%, levels last seen in September, 2022…toward the end of the last bear market.
The VIX essentially tested its August high, a time when I insisted that traders “be ready, so you don’t have to get ready“. However, a full volatility implosion – which I would consider a confirming signal of a bottom – did not quite materialize. The VIX ended the day with a 3.7% gain, so now I want to see a loss during a “turnaround Tuesday”.
The Equities: With Green Shoots
Vertiv Holdings, LLC (VRT)
One of my favorite AI plays, VRT formed a very promising bullish engulfing pattern, supported by heavy volume. Per swingtradebot, a bullish engulfing pattern is “a chart pattern that forms when a small black (red) candlestick is followed by a large white candlestick that completely eclipses or engulfs the previous candlestick’s real body.” I specifically like to translate this definition as a stock that opens below the previous day’s intraday low and closes above its intraday high, with a little room for discretion.
VRT pulled off this bullish bottoming pattern with a healthy 7.4% gain on the day – an impressive day of out-performance. The setup signals a potential end to the downtrend, though confirmation requires a close above today’s high, with invalidation below today’s low.
DoorDash (DASH)
DASH also printed a green shoots, bullish engulfing pattern, impressively coinciding with a bounce off its 200-day moving average (DMA) (the blue line) in picture-perfect fashion. DASH rallied so sharply off the lows, inspired no doubt by the tariff rumor, that the stock even closed the gap from Friday’s 6.2% loss. This large range sets up likely price consolidation before DASH can push higher again.
Flex Ltd. (FLEX)
After I noticed the bullish engulfing pattern in VRT, I pulled up swingtradebot to look for similar patterns and potential buy candidates. I was first surprised that bullish engulfing setups were not included in the stock market recap for the day. In fact, all of the key technical indicators were bearish! I next went to the bullish engulfing stock scan and was relieved to find seven pages of candidates. FLEX was one of the better looking stocks on the list. Given the stock still closed below its lower BB, I like the upside potential on a rebound back to overhead resistance. The range of the candle, nearly $3, is a major drawback because I will have to trade in a small size to comfortably accommodate the potential for a stop-loss below the intraday low.
Meta Platforms, Inc (META)
META, as a large-cap tech stock, offers a lower-risk setup with a clean bullish engulfing. It stands as one of the more stable names flashing potential reversal. META also closed below its lower BB and offers significant upside before the stock hits overhead resistance at its converging 200DMA and 20DMA (the dotted line).
Fortinet, Inc (FTNT)
Cybersecurity company FTNT had a notable day of out-performance with its bullish engulfing pattern. The stock gained 3.9% on the day and successfully defended 200DMA support.
Dollar Tree (DLTR)
DLTR managed to rise 7.8%, though it remains below its 200DMA. While not a green shoots bullish engulfing setup, the stock moved onto my watchlist given the impressive out-performance.
Be careful out there!
Footnotes
Subscribe for free to get email notifications of future posts!
“Above the 50” (AT50) uses the percentage of stocks trading above their respective 50-day moving averages (DMAs) to measure breadth in the stock market. Breadth defines the distribution of participation in a rally or sell-off. As a result, AT50 identifies extremes in market sentiment that are likely to reverse. Above the 50 is my alternative name for “MMFI” which is a symbol TradingView.com and other chart vendors use for this breadth indicator. Learn more about AT50 on my Market Breadth Resource Page. AT200, or MMTH, measures the percentage of stocks trading above their respective 200DMAs.
Active AT50 (MMFI) periods: Day #3 under 20% (oversold), Day #9 under 30%, Day #28 under 40%, Day #40 under 50%, Day #67 under 60%, Day #168 under 70%
Source for charts unless otherwise noted: TradingView.com
Full disclosure: long SPY shares, long QQQ calendar call spread, long IWM call, long VXX puts, long VRT, long DASH call,
FOLLOW Dr. Duru’s commentary on financial markets via StockTwits, BlueSky, and even Instagram!
*Charting notes: Stock prices are not adjusted for dividends. Candlestick charts use hollow bodies: open candles indicate a close higher than the open, filled candles indicate an open higher than the close.
* Blog notes: this blog was written based on the heavily edited transcript of the following video that includes a live review of the stock charts featured in this post. I used ChatGPT to process the transcript.