Stock Market Commentary
The dust is settling ever so slightly on the stock market’s post-Fed plunge. The stock market shifted from euphoria to oversold on a day that woke up everyone to a potentially new market reality. I say “potentially” because all year the market has been hit with bearish catalysts and quickly bounced back as if nothing happened. Along the way, the market seemed to look forward to rate cuts as an excuse to remain focused on the green grass on the other side. Those rate cut dreams have now been dashed in dramatic form. Since rates conventionally shape the valuations investors are willing to tolerate, the next catalysts will have to be exceptionally strong. Economic growth is already about as strong as it can get, so maybe massive tax cuts will be the magic promise to keep the market focused forward?
Next year’s catalysts need to be exceptionally strong because there is every reason to believe that optimism and valuations are at historic highs and extremes. For example, the chart below shows the highest percentage ever of investors expecting the stock market to go up in the next 12 months. This chart comes from Charlie Bilello’s The Week in Charts (12/19/24); it is full of golden nuggets of market extremes that I will use for reference in 2025!

The Stock Market Indices
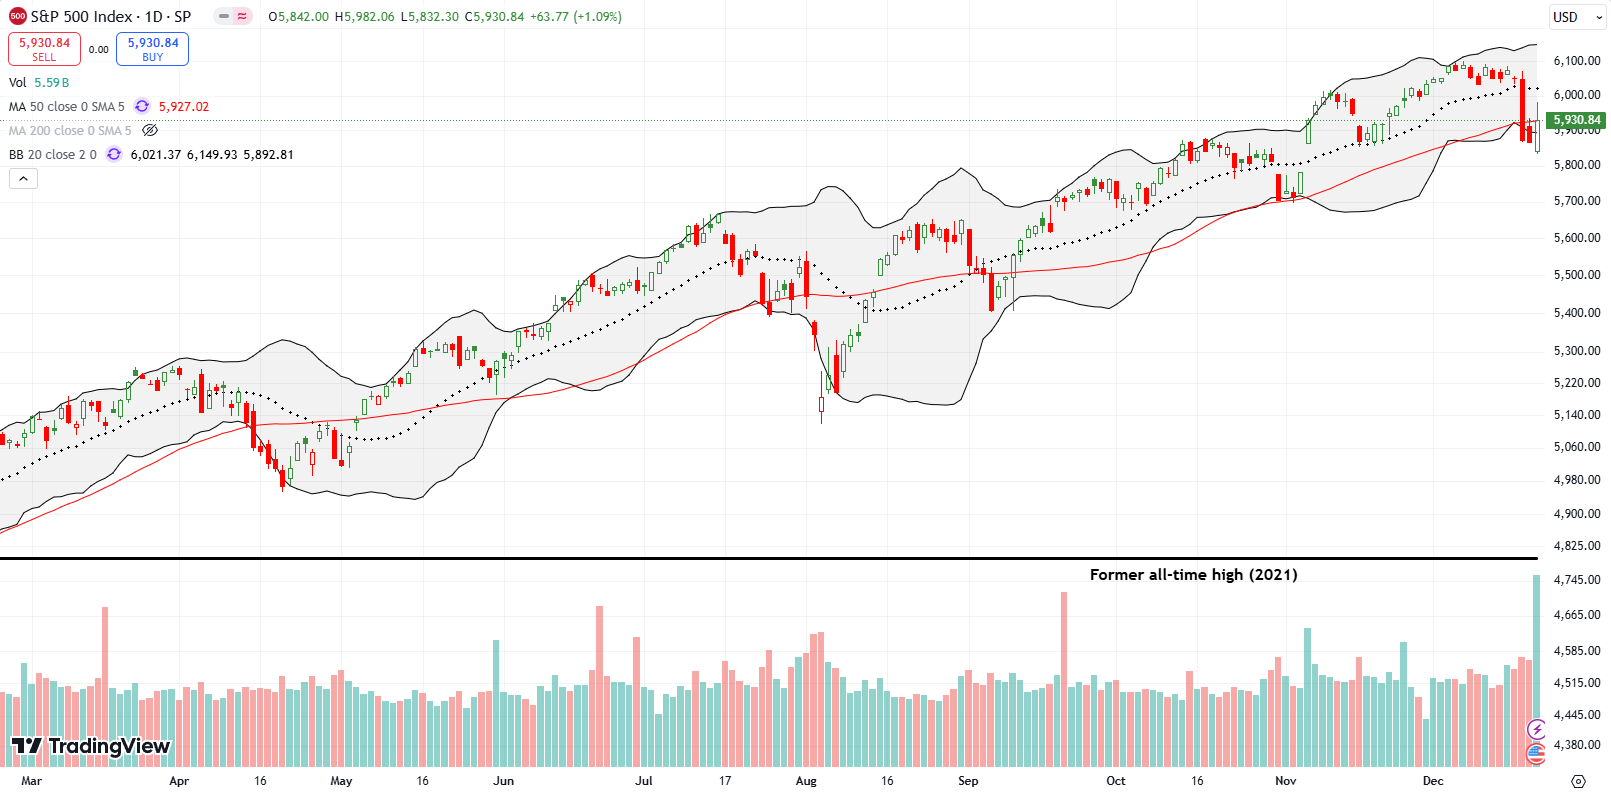
The S&P 500 (SPY) marginally confirmed a 50-day moving average (DMA) (the red line below) breakdown with a 0.1% loss on Thursday. Friday’s 1.1% rebound came up short on invalidating the bearish breakdown. The index closed the day right at 50DMA resistance after an ominous looking fade from a 50DMA breakout.
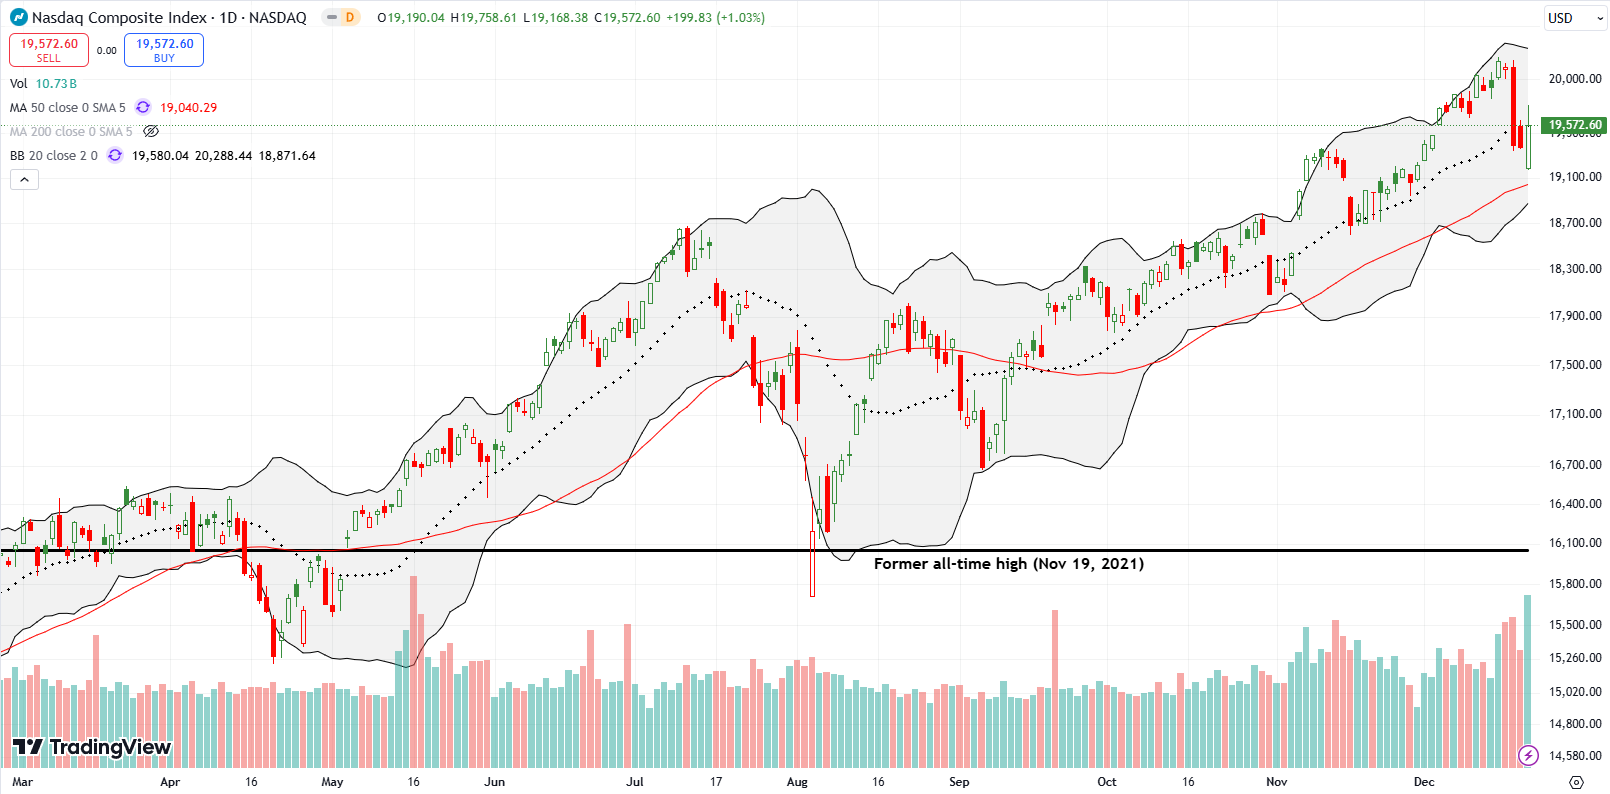
The NASDAQ (COMPQX) also faded from its intraday high on Friday. Resistance for the tech laden index is the 20DMA (dashed line). The NASDAQ almost tested its 50DMA support. Even with a test of support, the NASDAQ’s uptrend looks well-intact.
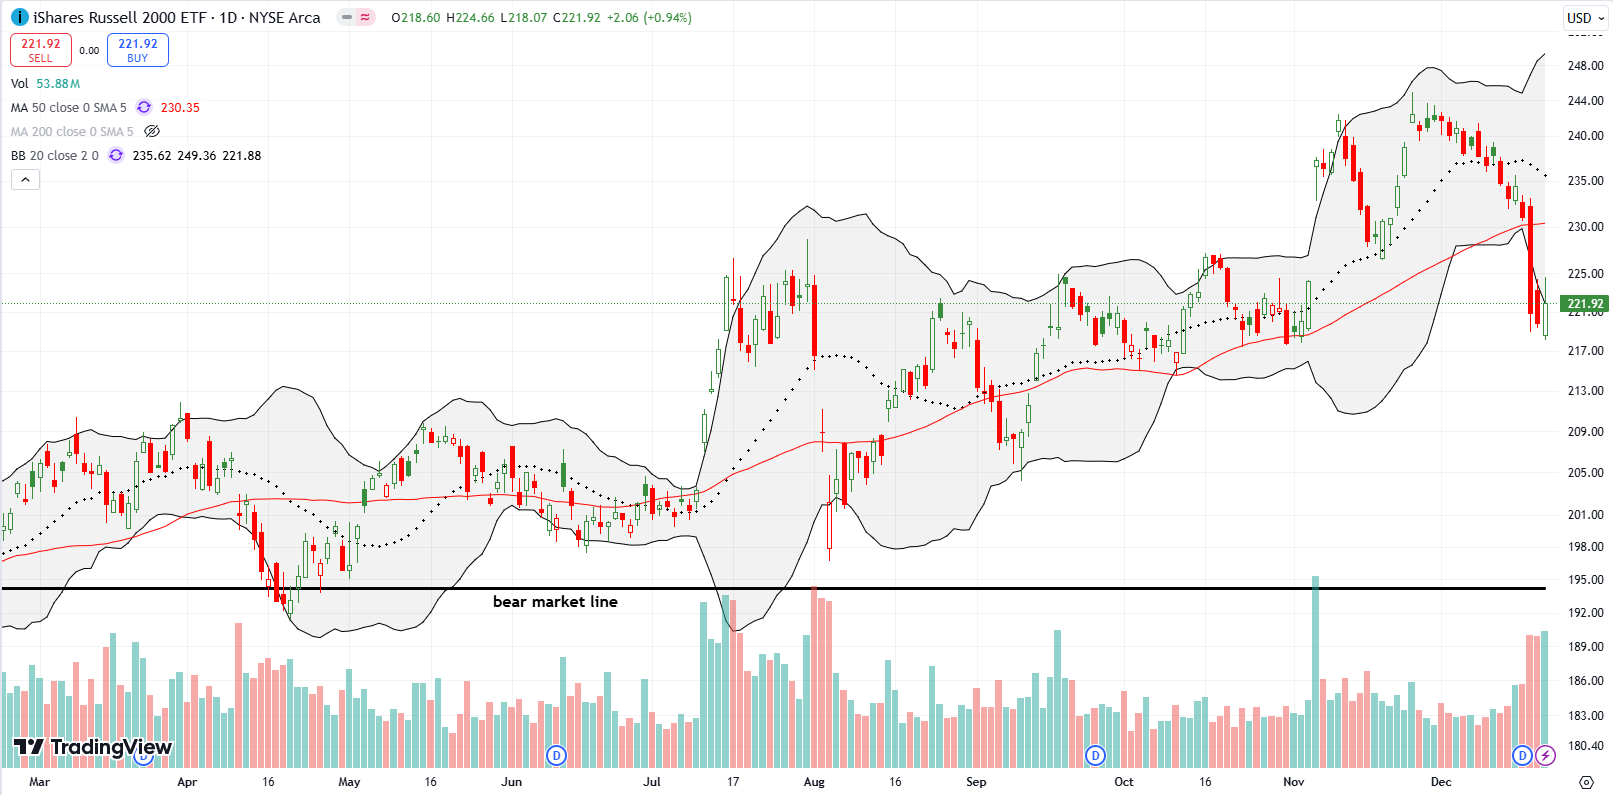
The plunge in the iShares Russell 2000 ETF (IWM) looks quite stark. Thursday’s 0.4% loss confirmed the breakdown. Perhaps more importantly, IWM’s Friday rebound closed right on top of the lower Bollinger Band (BB). That BB edge looks like a large anchor weighing down the ETF of small caps. Moreover, IWM closed below the former all-time highs and finished reversing the gains from the November post-election breakout.
The Short-Term Trading Call With A Plunge
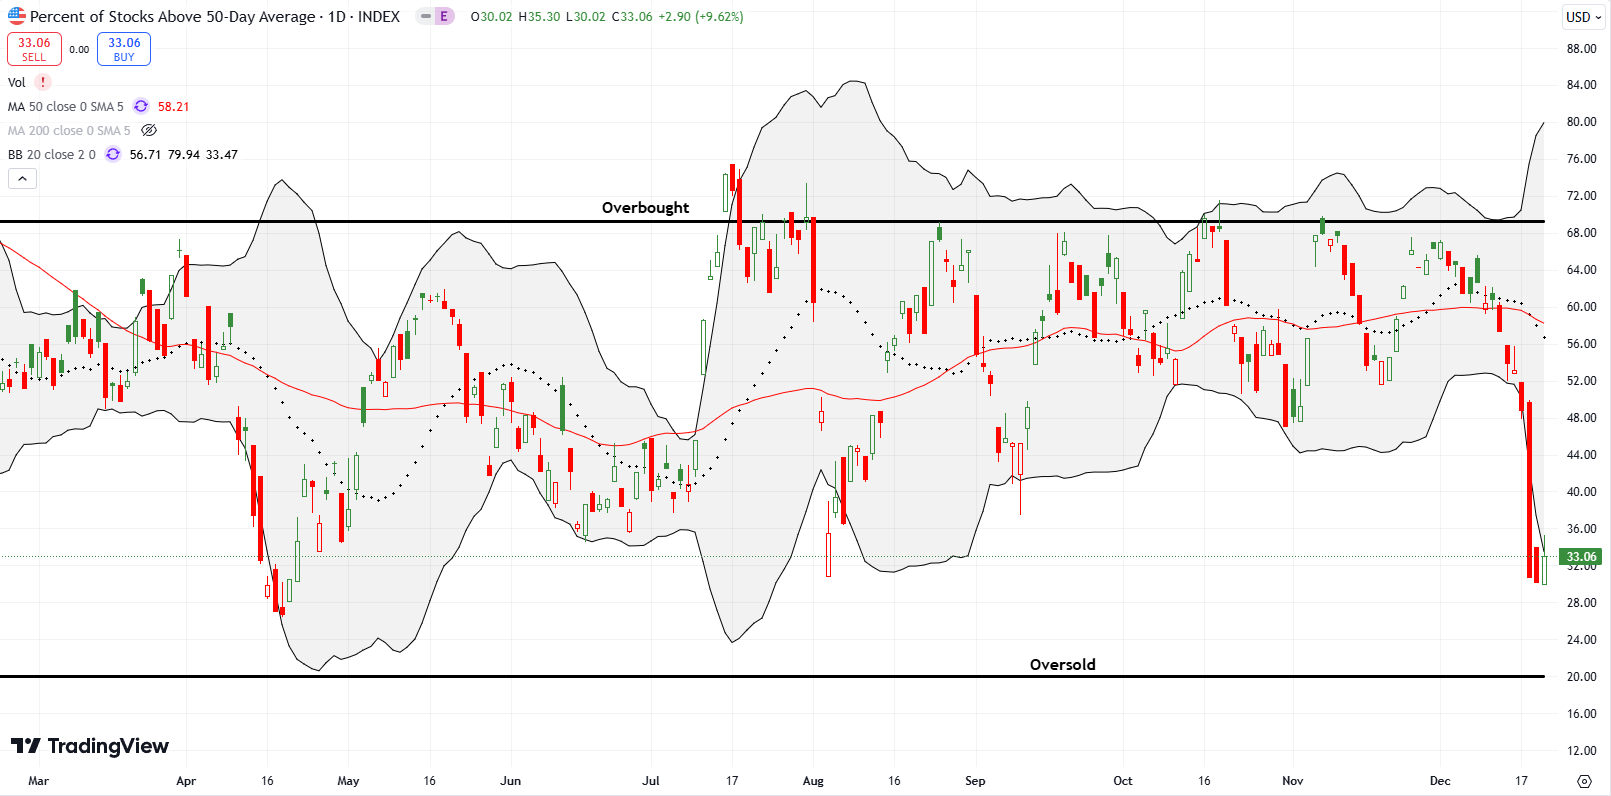
- AT50 (MMFI) = 33.1% of stocks are trading above their respective 50-day moving averages
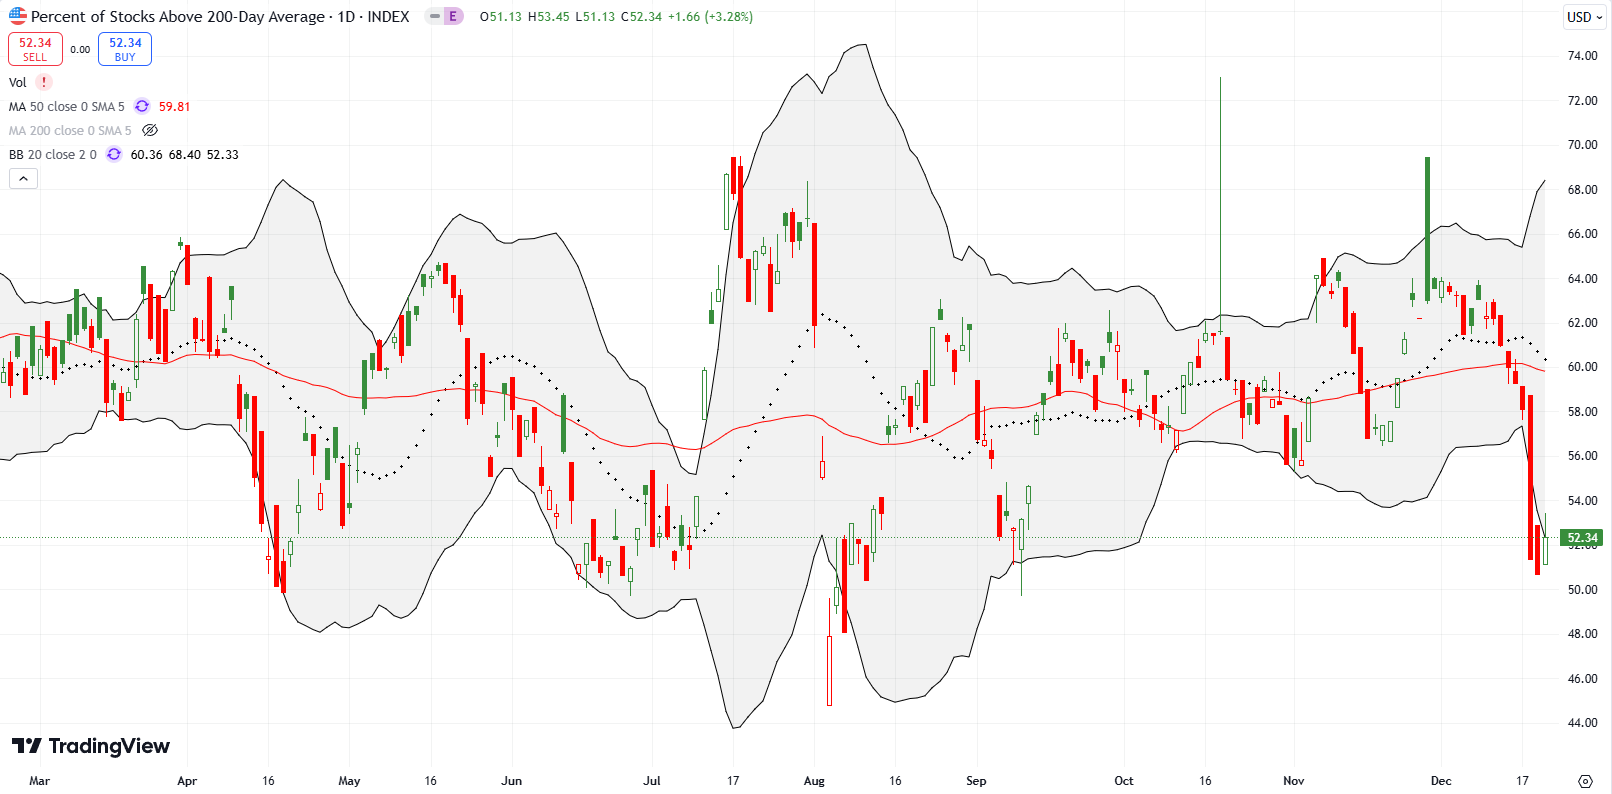
- AT200 (MMTH) = 52.3% of stocks are trading above their respective 200-day moving averages
- Short-term Trading Call: cautiously bullish
AT50 (MMFI), the percentage of stocks trading above their respective 50DMAs, took an 18 percentage point plunge on Wednesday to 30.8%. The slip in market breadth continued the next day. Friday’s rebound brought my favorite technical indicator back to 33.1%. I do not cover this scenario in the AT50 trading rules, but this hold of the 30% “quasi-oversold” level has the look of a bottom in market breadth. Large up candles after big down moves into the low 30% area have frequently marked bottoms in market breadth during a bull market. Thus, I feel incrementally more comfortable with my cautiously bullish short-term trading call.
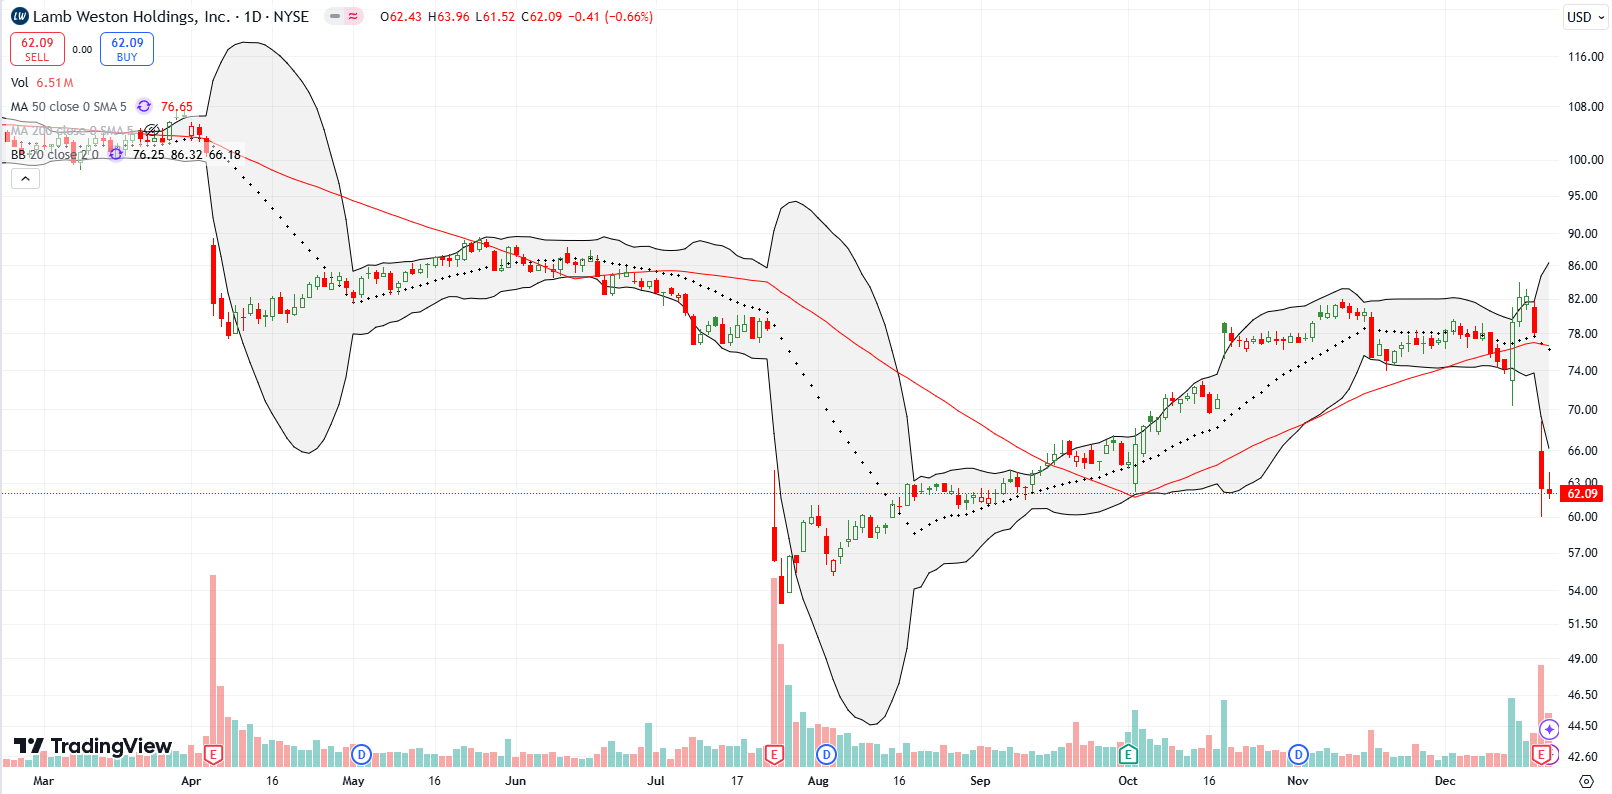
My comfort extended on Thursday to a series of trades selling short put options. With the volatility index (VIX) gapping down from the previous day’s surge, I figured volatility had begun its inevitable reversal. I targeted stocks on Thursday which were down significantly post-earnings as well as stocks down in sympathy. I went after Lamb Wesson (LW) down 20.1%, Lennar Corporation (LEN) down 5.1%, Meritage Homes (MTH) down 2.8% in sympathy with LEN, and Cintas (CTAS) down 10.6%. LW was the only stock which was not already selling off going into earnings. For each stock, I sold at a strike right below the asking price of the stock at the time I made the trade.
Amazingly, I earned a clean sweep with all these puts collapsing to zero on Friday as the dust settled and the stock market rebounded. This experience reminded me of the profitability of select and strategic put selling. Note well that in each case I was prepared to own the stock and, likely, sell calls against the position in the following week.
I still want to buy shares in potato processor Lamb Wesson Holdings, Inc (LW). Ever since I first covered the stock over a year ago, I have been intrigued with the stock as a non-tech “value” play. Each buy has resulted in a short-term trade. The last buy looked like something I could hold for a while after LW attracted the interest of Jana Partners. I even counseled caution for the bears. However, from there, LW stalled, trickled higher, took a 6.1% dive, and as a result gave me pause. I decided to lock in profits in an abundance of caution. Thursday’s post-earnings plunge would have erased all my profits on the position. Now I want to buy back in one more time. I like the stock all the way down to the post-earnings low from July.
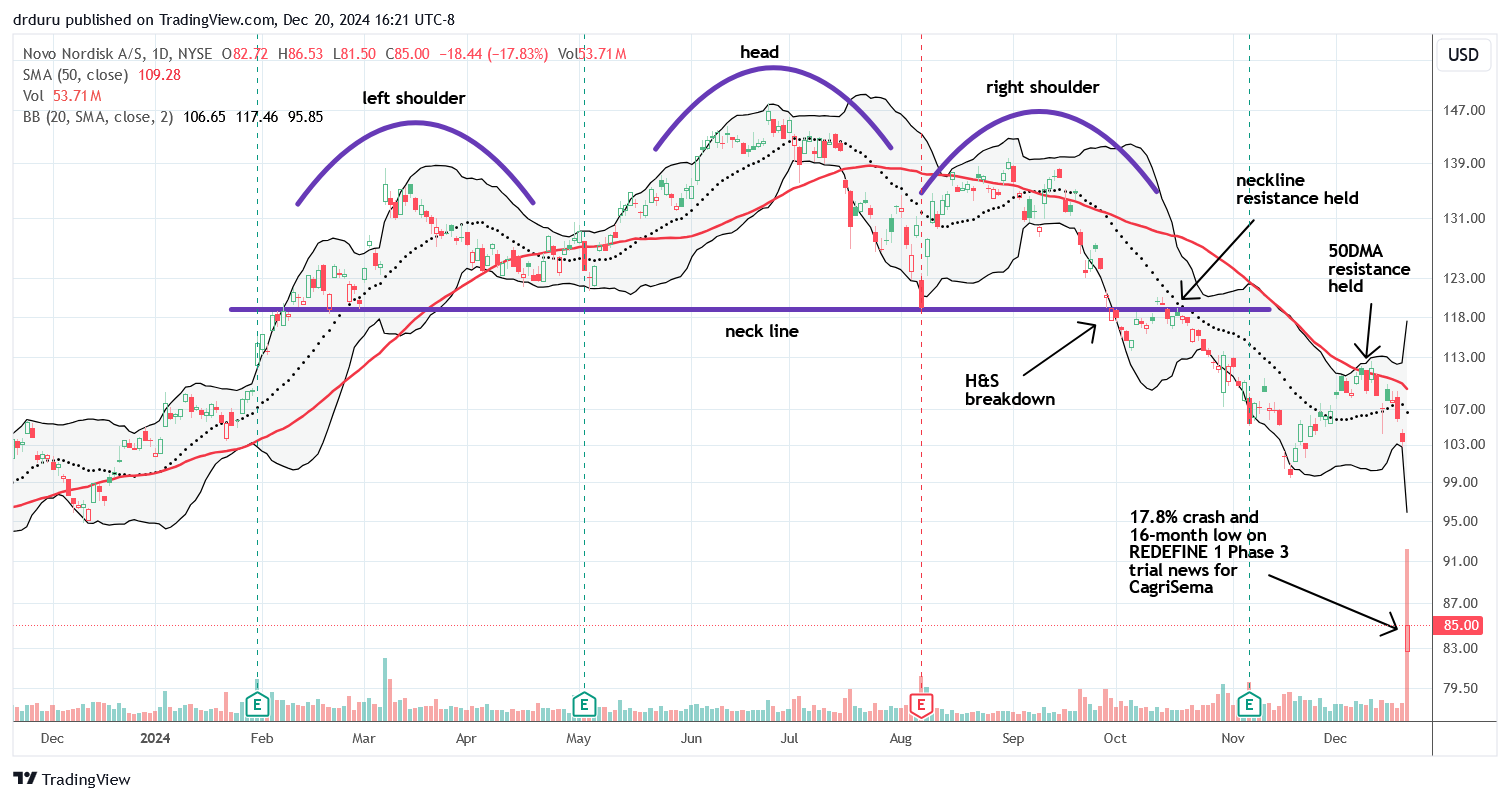
I love the poetry in the technical analysis of stock charts. Pharmaceutical company Novo Nordisk (NVO) delivered the rare sculpture of a head and shoulders (H&S) top. I annotated the chart below to tell the story. I posted this chart on Stocktwits and one person responded that correlation is not causation. The response earned a clarification from me that the chart does not provide predictions. More accurately, the chart reflects the worries and anxieties of investors and traders. Whether THEY got lucky in predicting the eventual calamity, I cannot say. This clarification is important for people who either do not understand technical analysis or cannot believe it works: technicians react, they do not predict. Fundamental analysts predict all the time.
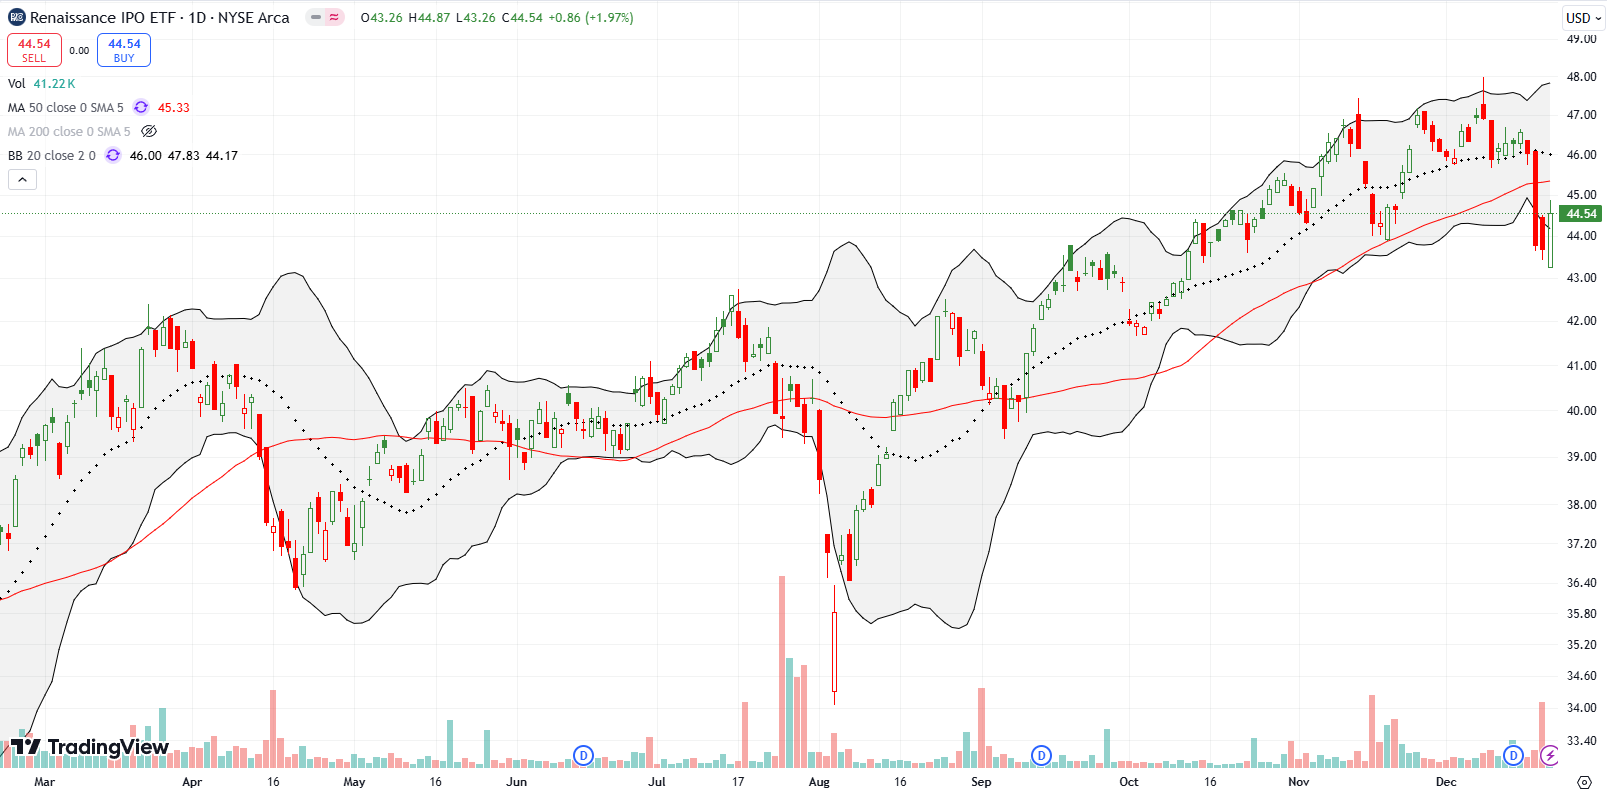
Renaissance IPO ETF (IPO) has been one of my favorite speculative plays to buy and hold. Last week’s plunge put that position in jeopardy. IPO is looking toppy after slicing right through 50DMA support with a 4.9% loss. Friday’s rebound stopped far short of testing resistance. I will be watching closely what happens at 50DMA resistance. A fail there OR a close below last week’s low will force me into risk management mode and into selling my IPO position. I of course will be looking to buy it back at lower prices per my IPO vs ARKK analysis.
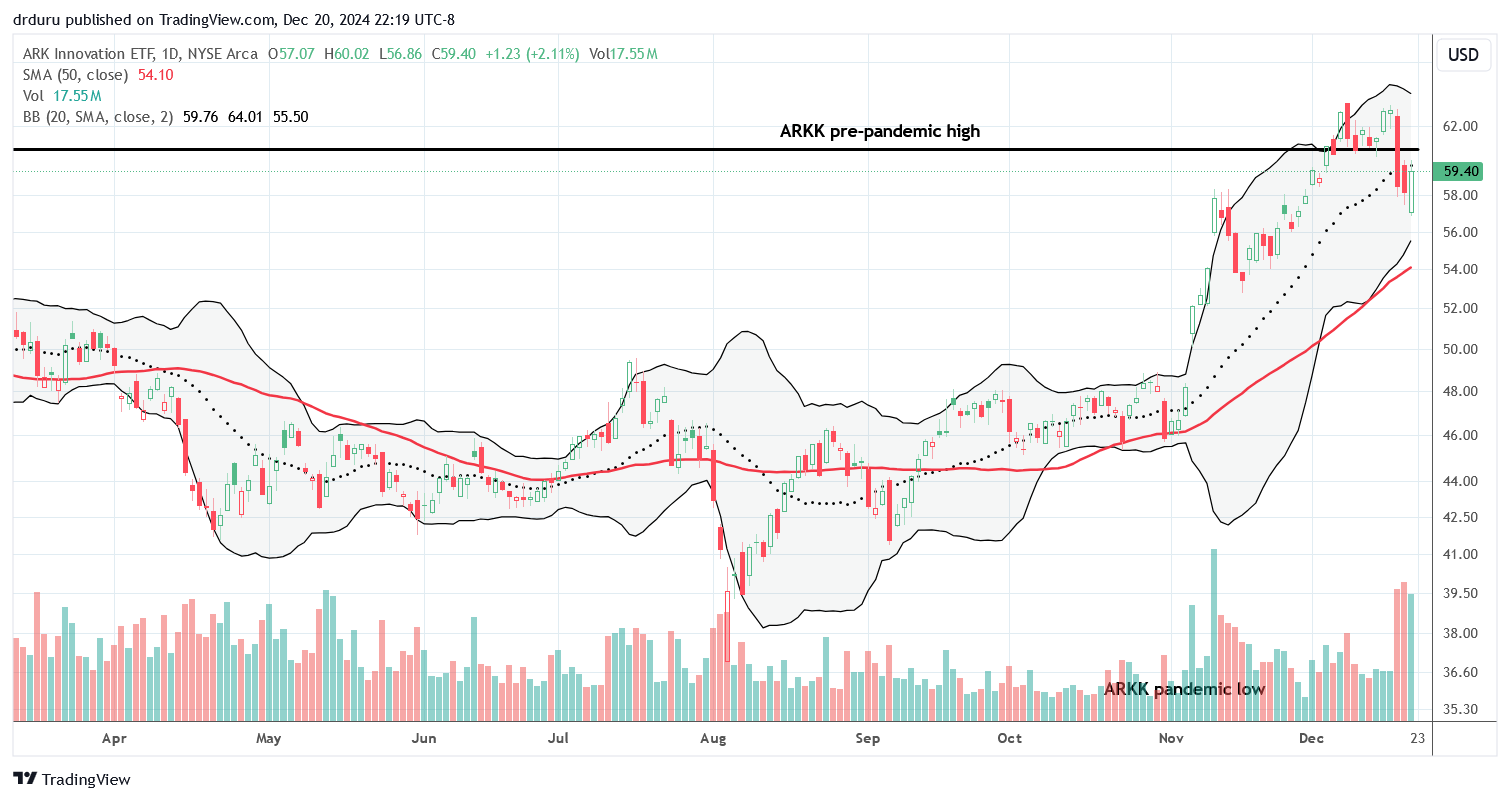
IPO’s “rival” ARK Innovation ETF (ARKK) also sliced through important support. I made a big deal out of the monumental meaning of ARKK’s breakout above its pre-pandemic high. Yet, I cautioned that ARKK could struggle to continue the breakout and the plunge last week proved out that theory. I am not yet deterred from the bullish call since ARKK has yet to test 50DMA support. I used Friday’s rebound to adjust my short-term covered call position by rolling the near worthless call to a fresh short call expiring Friday at the $62 strike (elevated in value thanks to volatility).
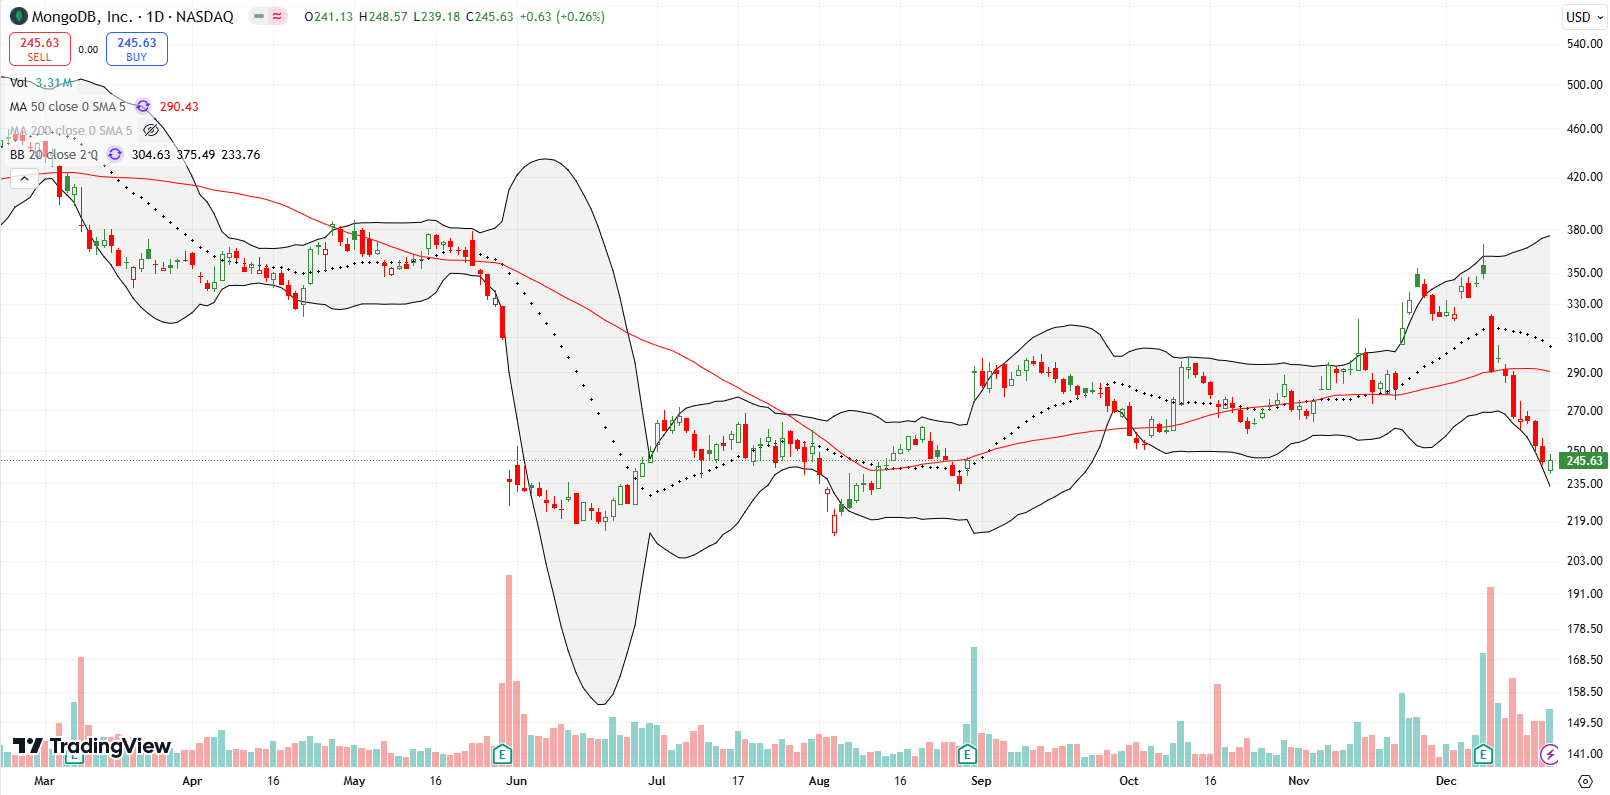
I made the case for MongoDB (MDB) two months ago. After about a month of churn around the 50DMA, MDB finally followed through. Next, the stock burst straight up with three consecutive days closing above the upper BB. I held on given MDB successfully filled the post-earnings gap down from May and continued higher. However, as soon as the over-extended momentum ended, I sold. MDB managed one more burst going into earnings. Sellers followed a 16.9% post-earnings plunge with a 50DMA breakdown and a refill of the August post-earnings gap up. MDB is right back to bearish territory (but I do not dare short it!).
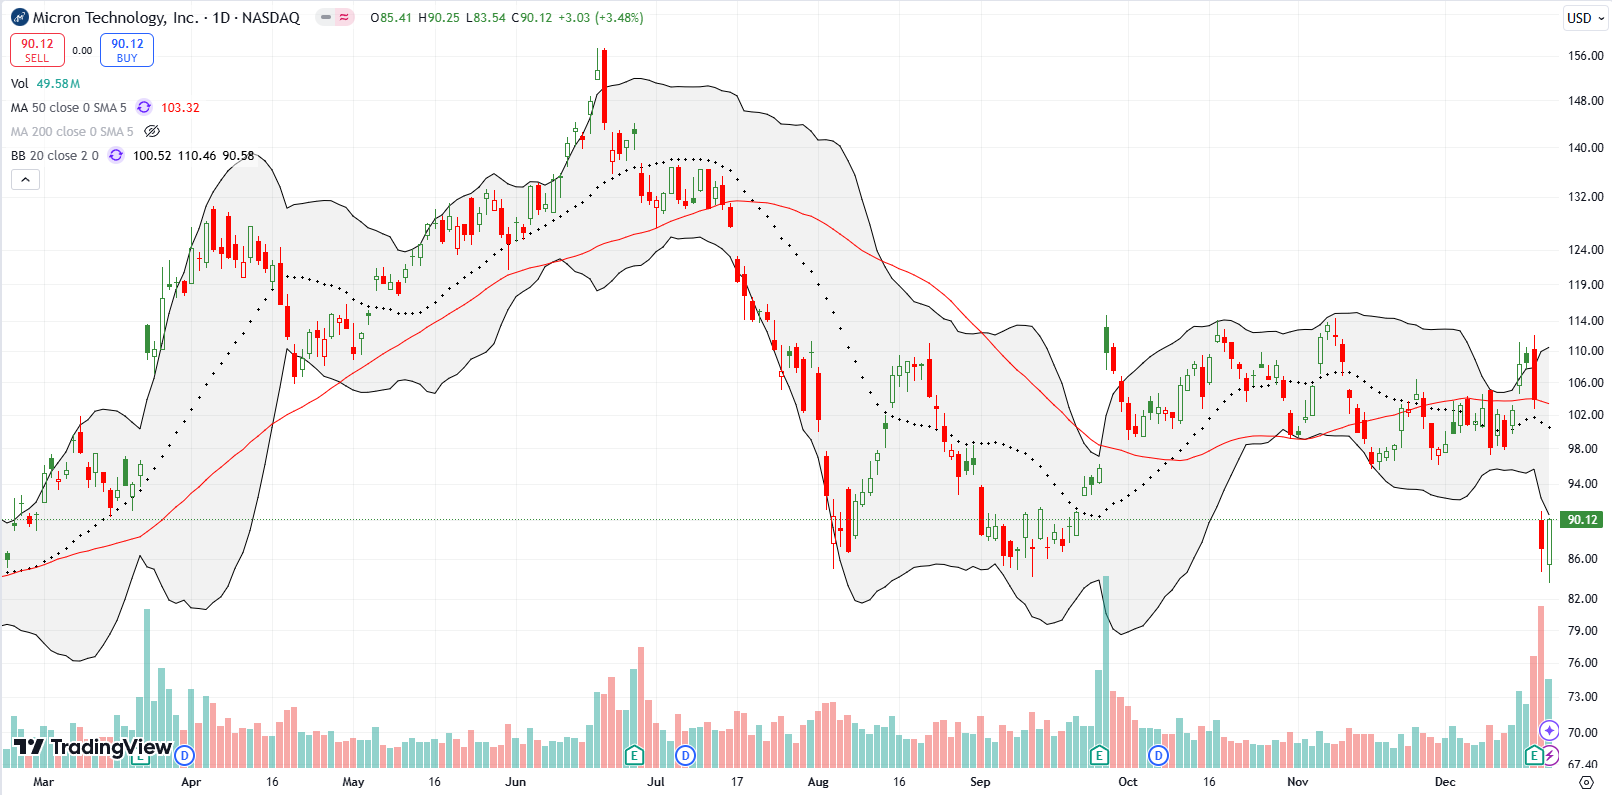
Semiconductor company Micron Technology, Inc (MU) lost 16.2% on a post-earnings plunge. MU retested a double bottom across August and September. Friday’s rebound motivated me to buy a February $95/$110 call as a bet that, by February, the market will start pricing in the CEO’s optimism about the second half of fiscal 2025: “While consumer-oriented markets are weaker in the near term, we anticipate a return to growth in the second half of our fiscal year….We continue to gain share in the highest margin and strategically important parts of the market and are exceptionally well positioned to leverage AI-driven growth to create substantial value for all stakeholders.”
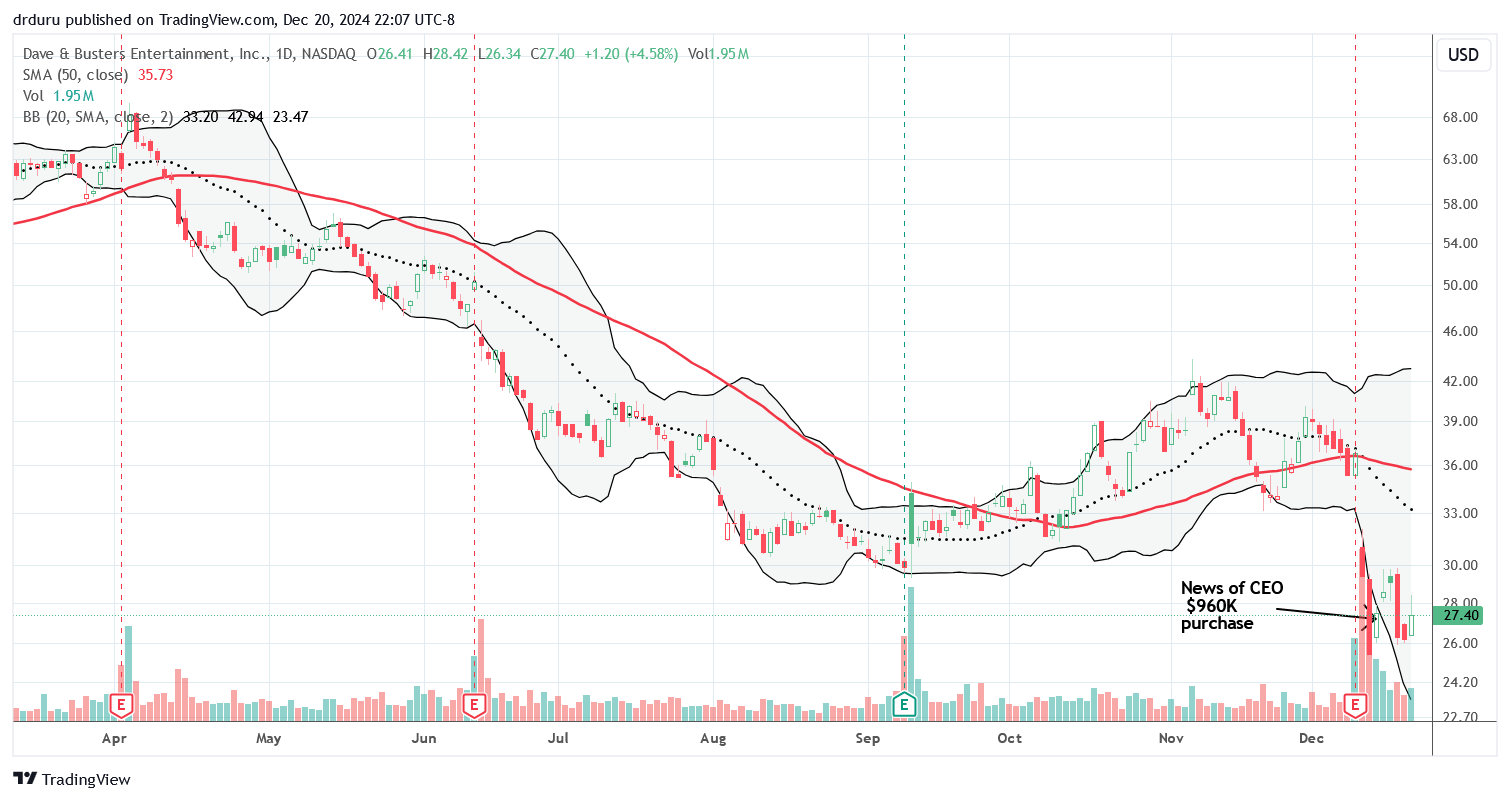
Almost two years ago, Dave & Busters Entertainment, Inc (PLAY) caught my attention after insiders spent considerable time and resources loading up on the stock. I followed suit. Surprisingly, the stock continued trading in a range until a breakout in January, 2024. Along the way, I bought and sold PLAY on the technicals. After the breakout failed, I stepped away.
PLAY made one more run before what turned out to be a blow-off top after April earnings. PLAY subsequently sold off nearly straight down for 5 months. After the stock hit the bottom of the trading range, I started buying again. I bought and sold three cycles, surviving September earnings but staying away from December earnings. PLAY sold off 20.1% post-earnings partially on news of an executive change. The selling seemed overdone, especially with the trading range now broken. My buy signal came three days later on news that the new CEO spent $960K buying shares. Just as I did nearly two years ago, I will hold these shares, buy more shares, and take profits based on the technicals. Still, I am hoping THIS time the insider buying portends a sustained breakout for PLAY.
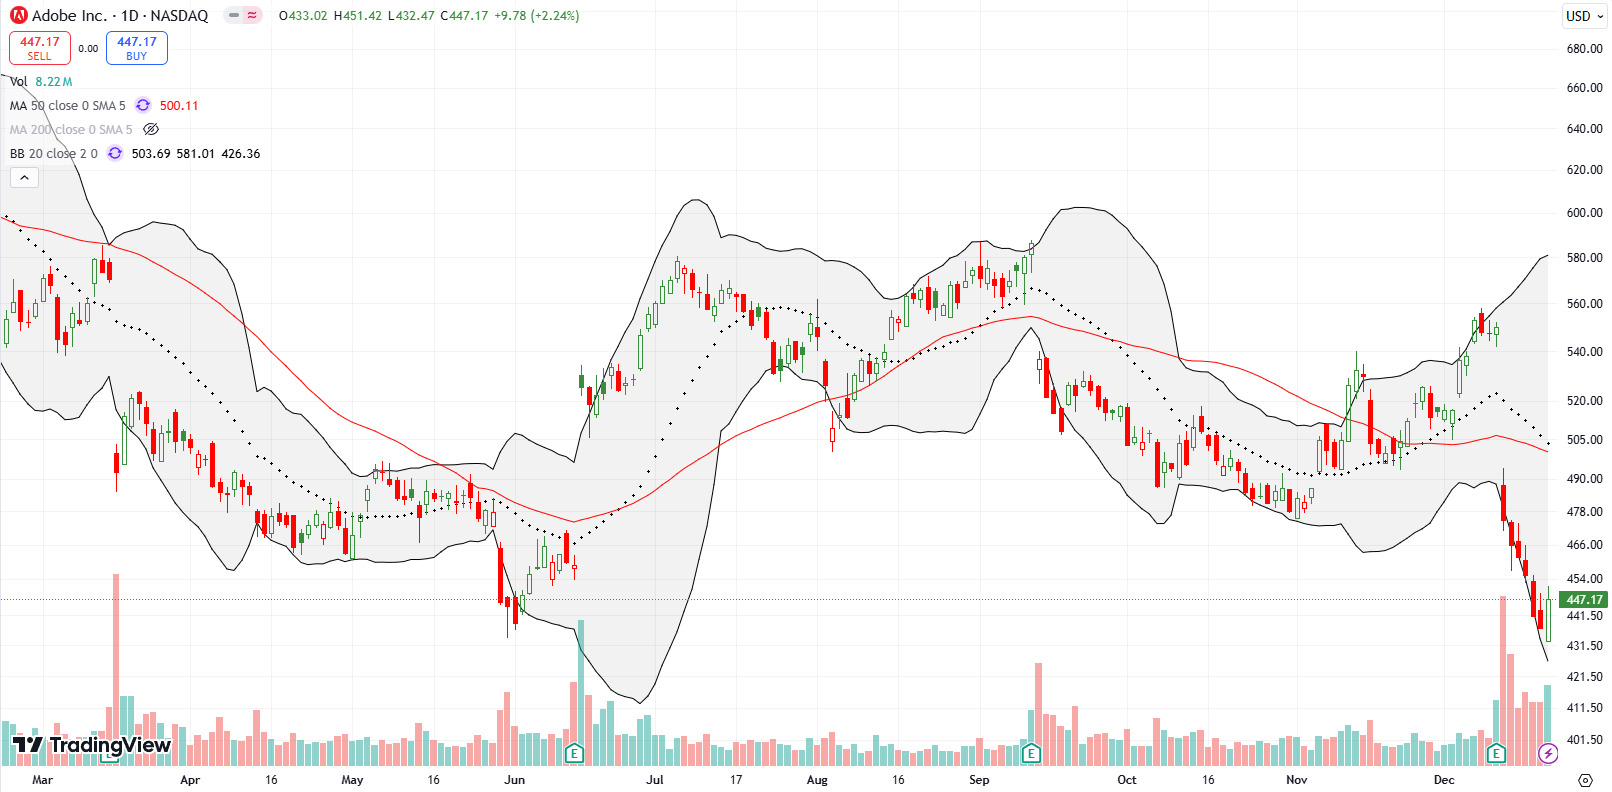
Digital media software company Adobe Inc (ADBE) has been a surprising under-performer. ADBE topped out in February, last week tested its low for the year, and is down 25.1% year-to-date. A 13.7% post-earnings plunge earlier this month sealed the deal on ADBE’s under-performance for the year. If ADBE closes below last week’s low, I will chase it short.
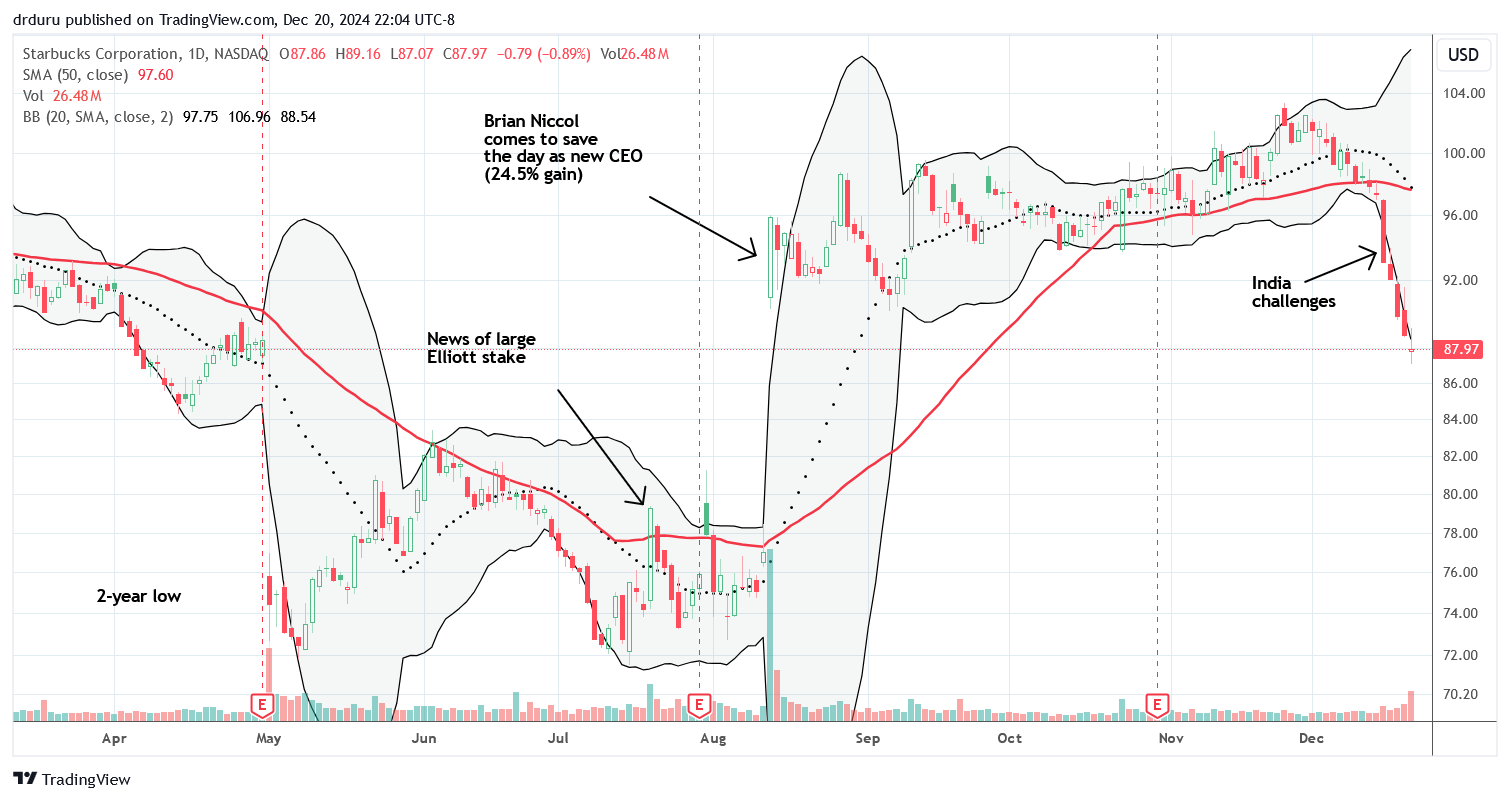
Starbucks (SBUX) has stalled out. News of business challenges in India took SBUX down 4.4% last week and solidified a 50DMA breakdown. SBUX continued to sell off every day of the week. The stock is now eating into the gap created by the news of Brian Niccol coming over as CEO. I am looking for a new entry to buy SBUX. One good signal would be a gap higher on Monday which would create an abandoned baby bottom and/or morning star bottom.
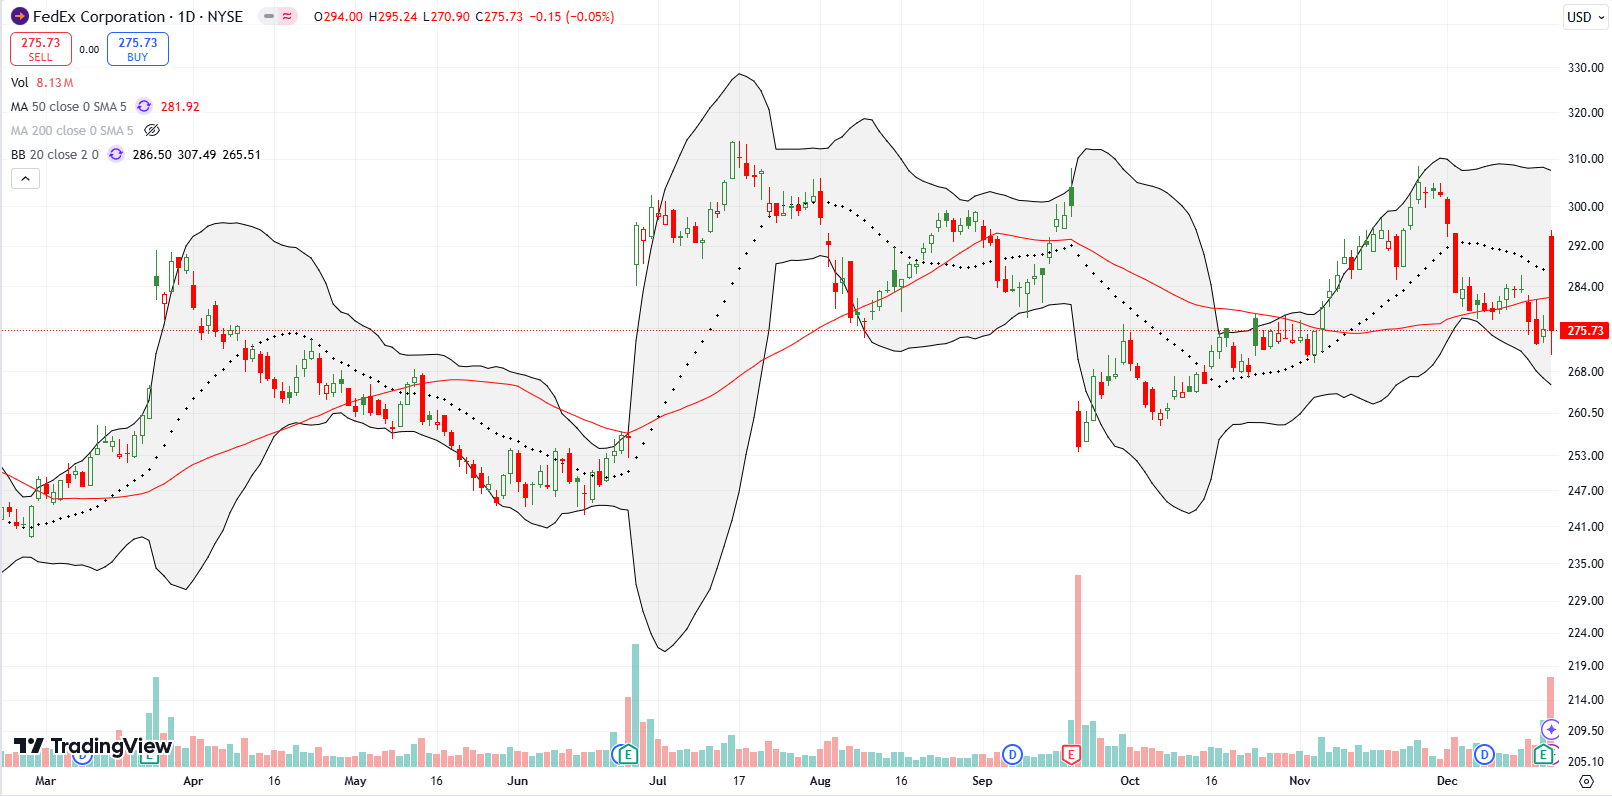
FedEx Corporation (FDX) has been one choppy stock this year. FDX gapped higher for a 7.1% gain, but sellers took over from there. The dust settled on a flat close and a return to sub-50DMA trading. FDX is a short on a lower close.
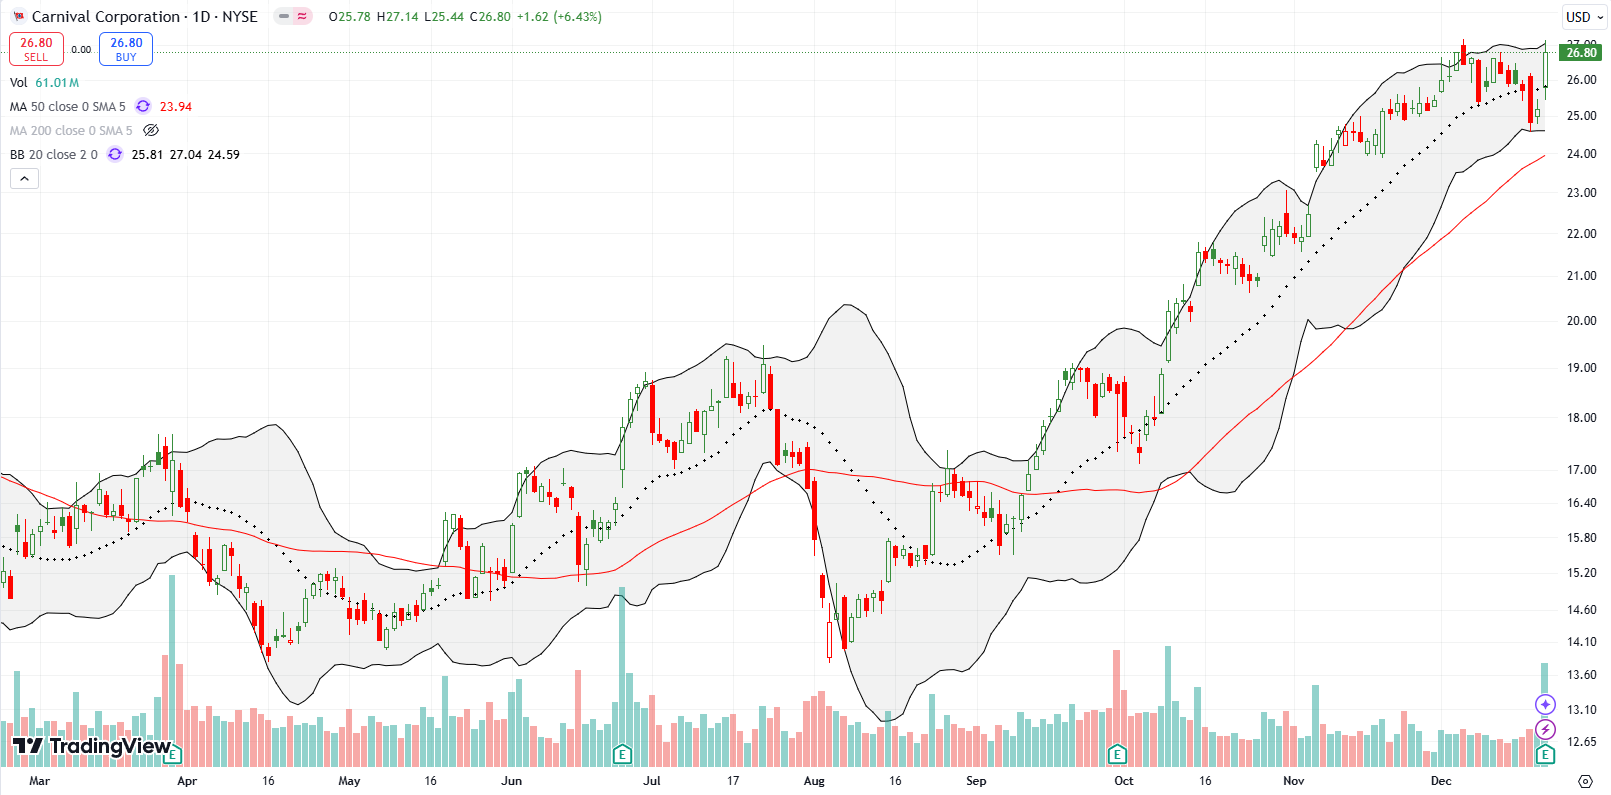
Cruise operator Carnival Corporation (CCL) has had a surprisingly good year thanks to a vigorous rally since the August lows. CCL is up 44.6% for the year and enjoyed a 6.4% post-earnings gain to set a fresh high for the year. A higher close re-establishes a strong uptrend, but I am wary about chasing CCL higher given what could be disappointment in 2025.
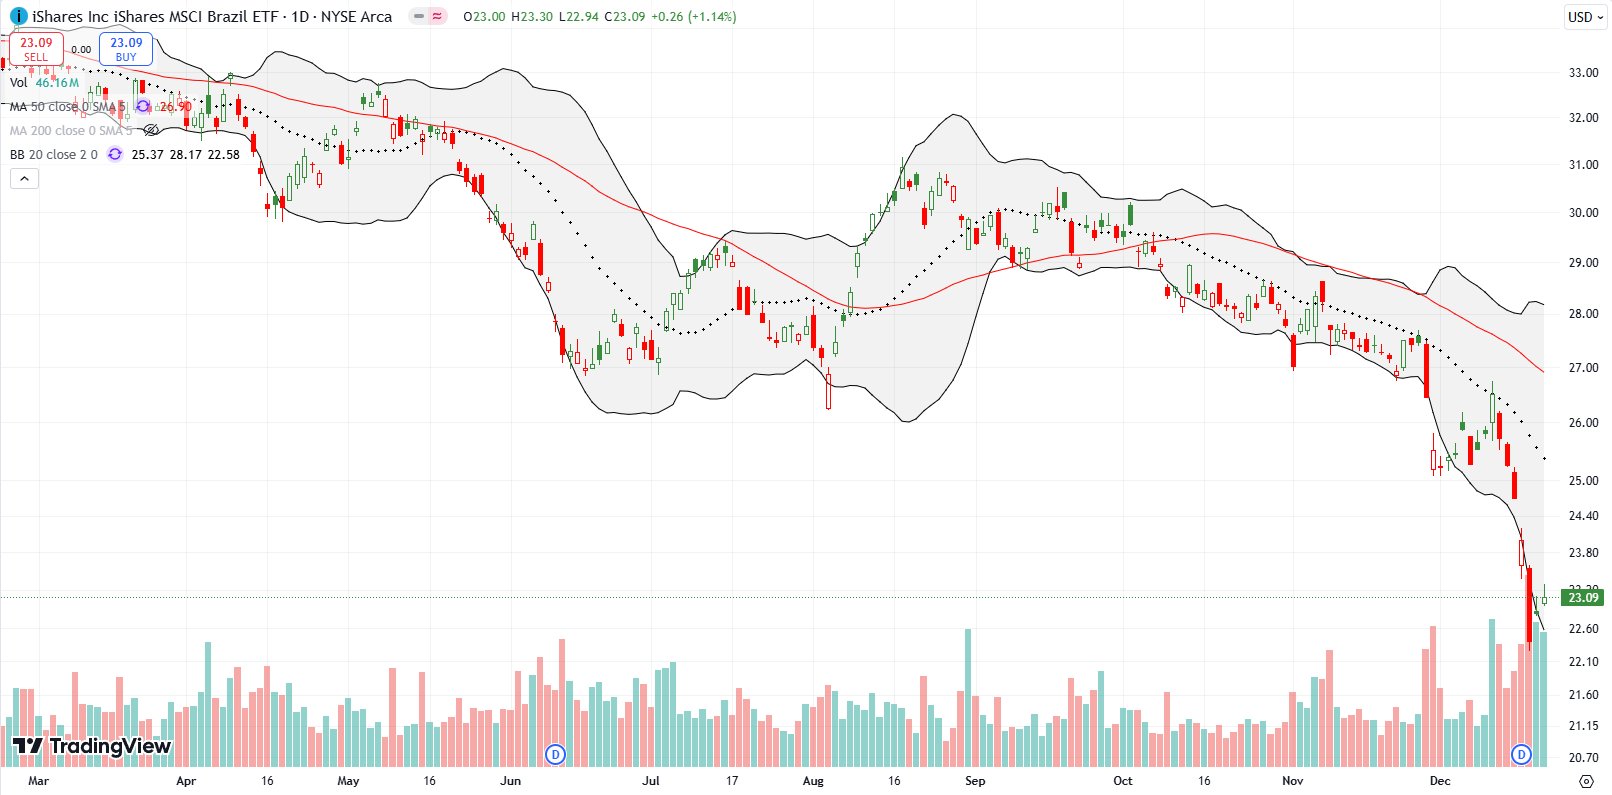
The iShares MSCI Brazil ETF (EWZ) suffered accelerating losses last week. The selling got steep enough to trigger a fresh buy on the 20% rule. With the stock at a 4-year low, EWZ has good odds for some kind of relief rally in coming days or weeks. I will be most cautious about the declining 20DMA holding as resistance.
Be careful out there!
Footnotes
Subscribe for free to get email notifications of future posts!
“Above the 50” (AT50) uses the percentage of stocks trading above their respective 50-day moving averages (DMAs) to measure breadth in the stock market. Breadth defines the distribution of participation in a rally or sell-off. As a result, AT50 identifies extremes in market sentiment that are likely to reverse. Above the 50 is my alternative name for “MMFI” which is a symbol TradingView.com and other chart vendors use for this breadth indicator. Learn more about AT50 on my Market Breadth Resource Page. AT200, or MMTH, measures the percentage of stocks trading above their respective 200DMAs.
Active AT50 (MMFI) periods: Day #270 over 20%, Day #169 over 30% (overperiod), Day #3 under 40% (underperiod), Day #3 under 50%, Day #7 under 60%, Day #108 under 70%
Source for charts unless otherwise noted: TradingView.com
Full disclosure: long SPY put spread, long IWM shares and call options, long EWZ, long PLAY, long MU call spread, long ARKK covered call and shares, long IPO
FOLLOW Dr. Duru’s commentary on financial markets via StockTwits, BlueSky, and even Instagram!
*Charting notes: Stock prices are not adjusted for dividends. Candlestick charts use hollow bodies: open candles indicate a close higher than the open, filled candles indicate an open higher than the close.


