Stock Market Commentary
The stock market’s V-shaped recovery finished reversing most of the losses from the August calamity. Small caps are once again the laggards. During this recovery the market swung from recessions fears to recession relief. The prospects for interest rate cuts no longer seemed to matter on either side of the V-shape.
The good economic news of last week in the very recent past could have sent interest rates jumping and triggered fears of further delays in rate cuts. Instead, this time around, the market celebrated in a big way. July retail sales astounded the economic consensus with a 1.0% surge from June’s levels. The market did not even take time to ponder the revision of June’s sequential change from 0.0% to -0.2%. Thursday’s resulting surge in retail stocks and sympathy rally across the stock market underlined the market’s V-shaped recovery from calamity.
Good news from the labor market added icing to the cake. Weekly initial unemployment claims beat the economic consensus by 5K although the prior week was revised upwards by 1K. While the claims number is typically not a market-moving event, last week the good news contributed to the latest narrative that good economic news is good for the stock market.
The chart for initial claims has been noisy with just about zero information for two years. While recent trends are generally pointing upward, initial claims this year have stopped far short of last year’s highs.
![U.S. Employment and Training Administration, Initial Claims [ICSA], retrieved from FRED, Federal Reserve Bank of St. Louis, August 18, 2024](https://drduru.com/onetwentytwo/wp-content/uploads/2024/08/20240818_Initial-Claims.png)
The Stock Market Indices
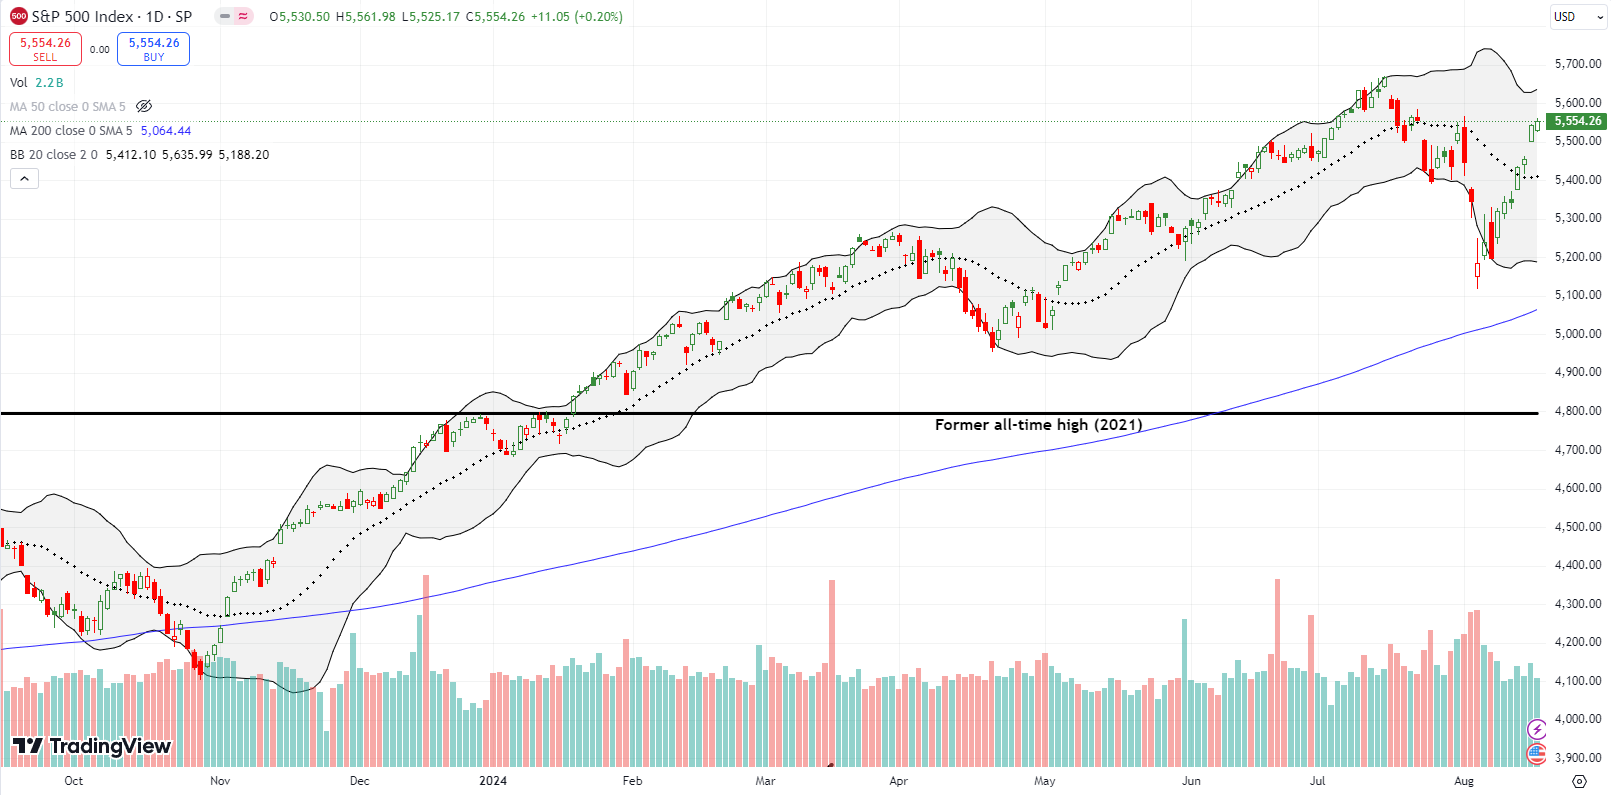
The S&P 500 gained each day of the week as a V-shaped recovery from the calamity wiped away August’s losses. Incredibly, the index is now UP fractionally at +0.6% for the month. At the current V-shaped recovery pace, the S&P 500 will be right back at all-time highs by the end of the week.
On a closing basis, the S&P 500 suffered a maximum drawdown of 6.1% so far in August. This sizable loss is an outlier for August and any of the other most dangerous months of the year. Thus, the rebound now looks like a classic oversold rally.
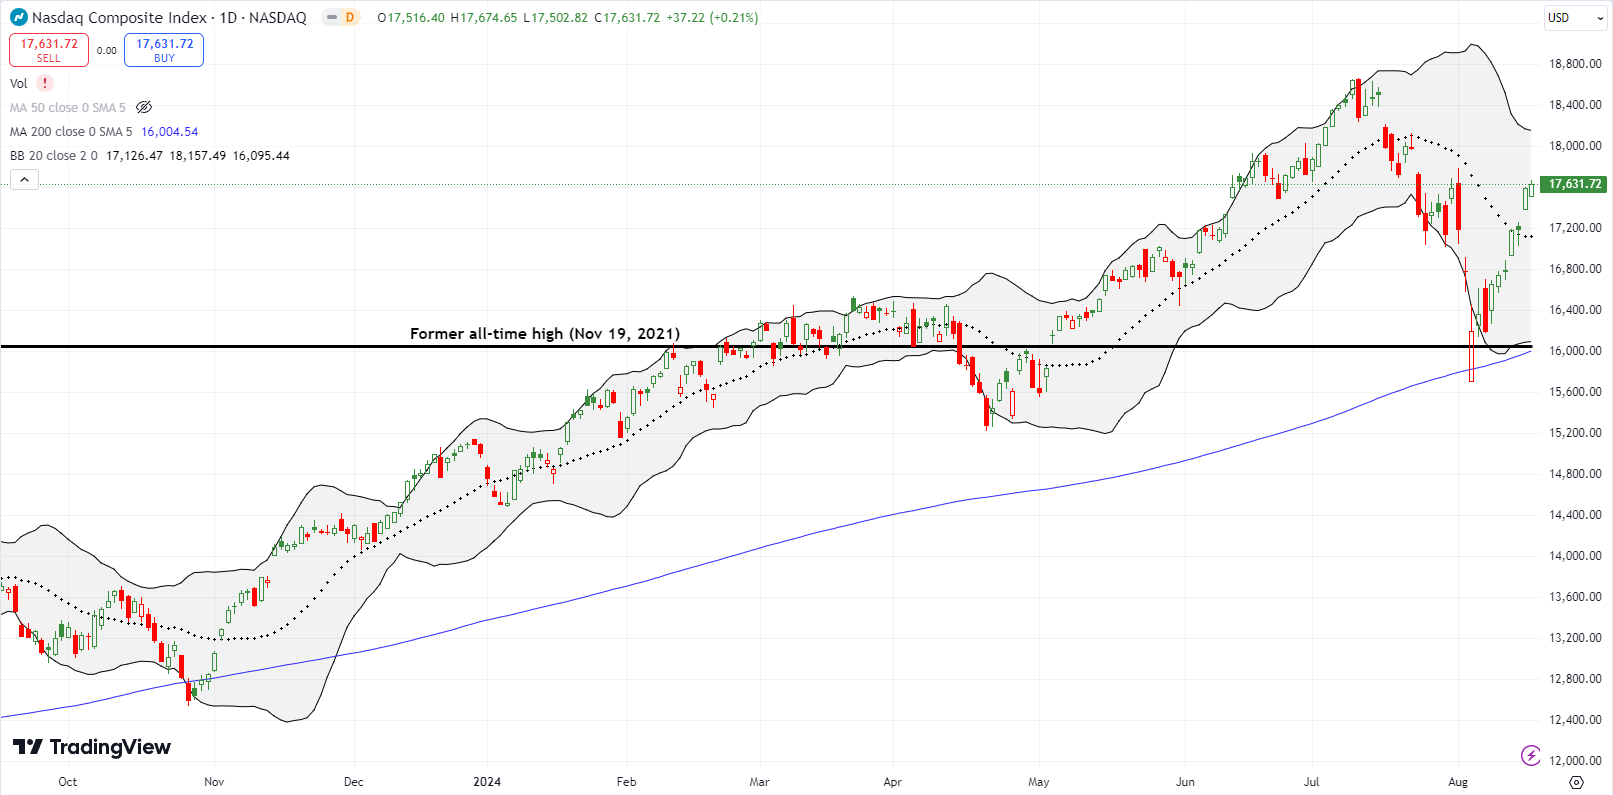
The NASDAQ (COMPQ) does not yet have its all-time high in its sights. Still, its V-shaped recovery is perhaps more impressive given the successful test of support at the 200-day moving average (DMA) (the blue line below). The tech-laden index closed the week right on top of its 50DMA (not shown – I will make the switch to the 50DMA view in the next post). Thus, the NASDAQ is right at double resistance with price back to where it was at the end of July.
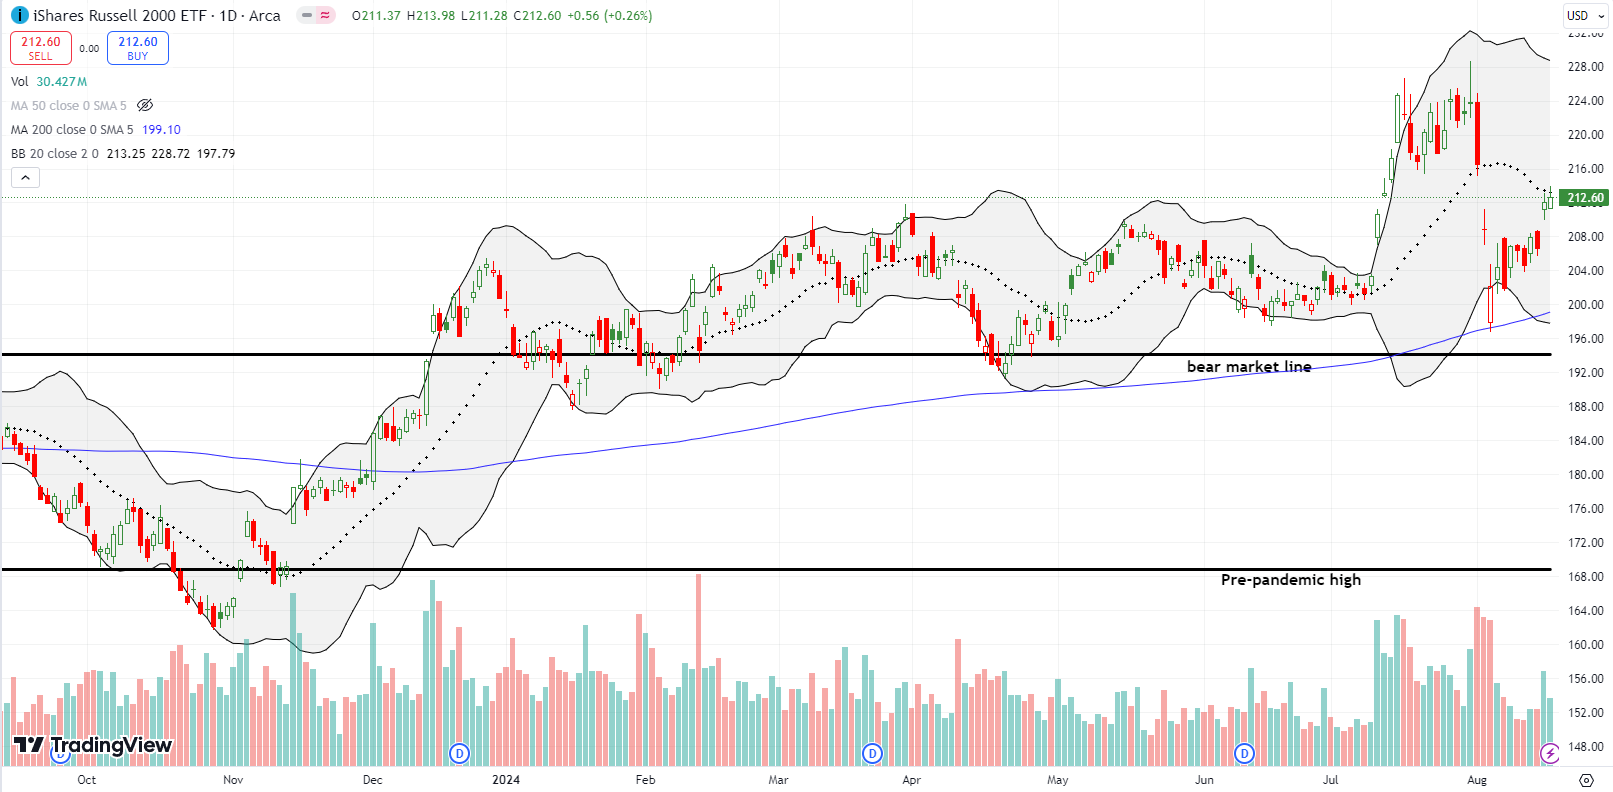
The iShares Russell 2000 ETF (IWM) traded back to 20DMA resistance. While the ETF of small caps is far from reversing its loss for the month of August, IWM delivered a successful test of support at its 200DMA. Thus, there is still a chance that IWM picks up where it left July in the middle of a powerful rotation.
The Short-Term Trading Call With A V-Shaped Recovery
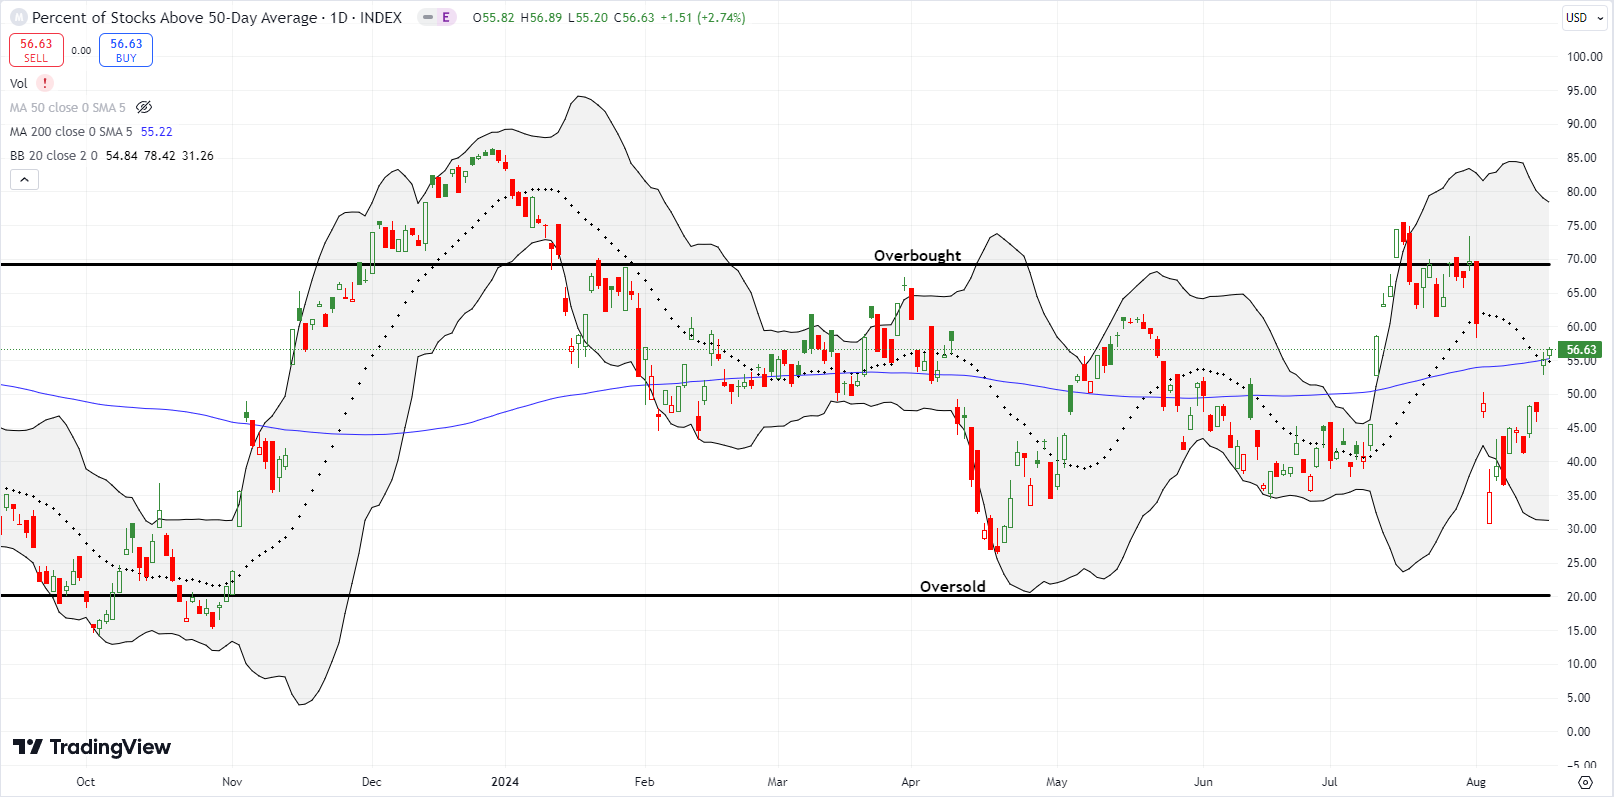
- AT50 (MMFI) = 56.6% of stocks are trading above their respective 50-day moving averages
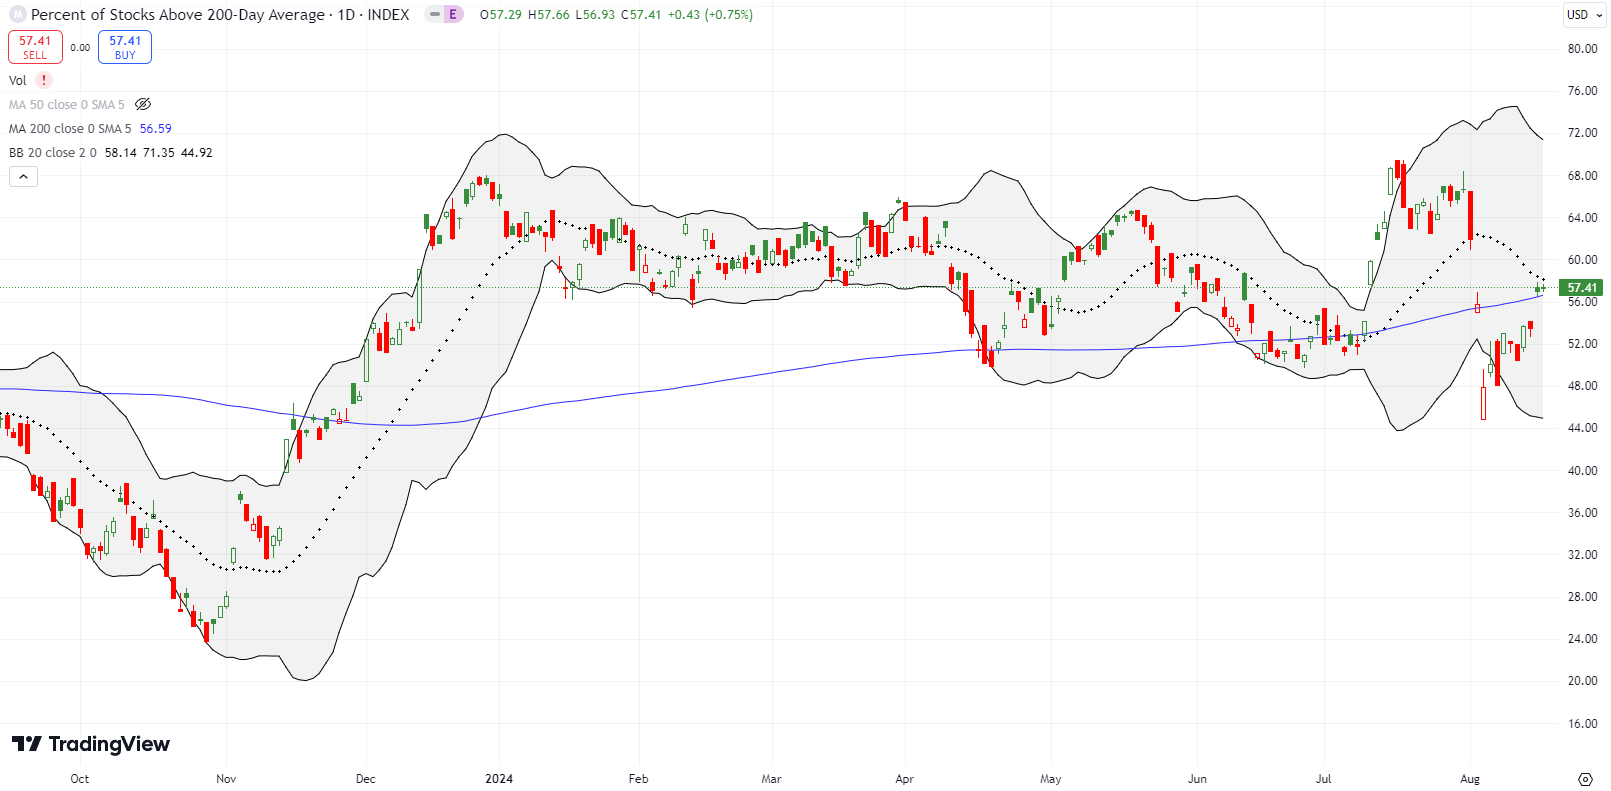
- AT200 (MMTH) = 57.4% of stocks are trading above their respective 200-day moving averages
- Short-term Trading Call: neutral
AT50 (MMFI), the percentage of stocks trading above their respective 50DMAs, stumbled to start the week but soared into the end of the week. My favorite technical indicator is firmly replanted in the middle of the trading range that has dominated most of the year. In retrospect, AT50 reached “oversold enough” two weeks ago given a confluence of extremes. One of those extremes took the volatility index (the VIX) to its third highest level ever. In a loud statement about the inability for the market to sustain high levels of fear, the V-shaped recovery in the stock market has crushed the VIX all the way back to 14.8. And yet, the VIX is still “high” relative to most of its complacent trading this year.
I kept the short-term trading call at neutral: AT50 is now in a no-man’s land of little information. The indices looked stretched with this V-shaped recovery, but the steepness of the rebound is not reason enough to downgrade my outlook. In fact, I prefer to stick with momentum than to guess when the trend will come to an end…especially given important catalysts around the corner. For example, I am looking forward to the Federal Reserve’s confab at Jackson Hole to provide a fresh trading perspective on the stock market. Chair Jerome Powell is scheduled to speak at 10am Eastern on Friday, August 23rd.
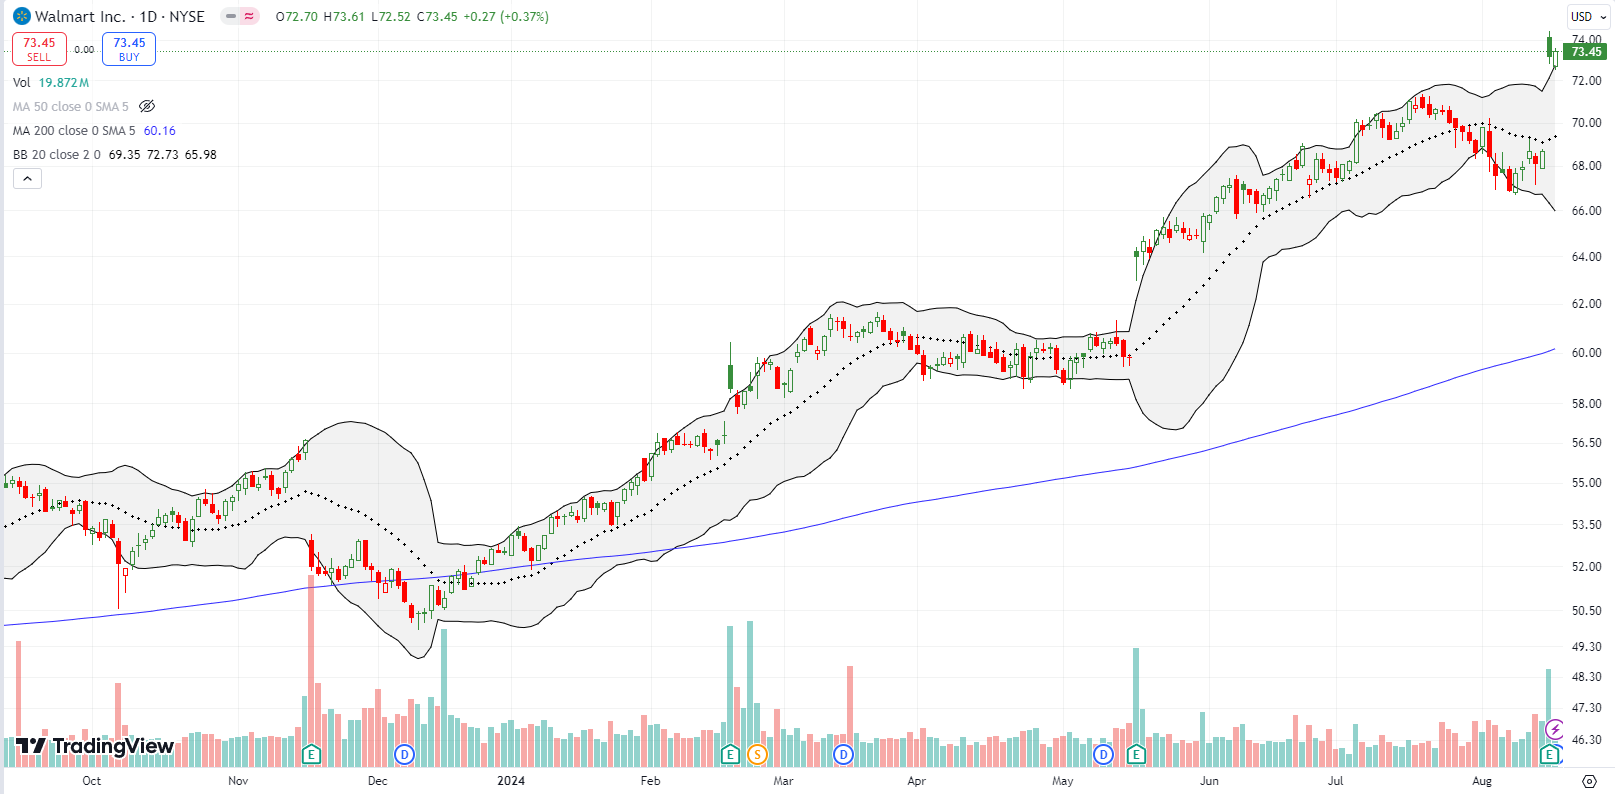
Walmart (WMT) was the signature retail stock of the week. Timid investors sold the stock going into earnings and soon regretted the lack of confidence. WMT soared 6.5% post-earnings and closed the week at an all-time high. This exclamation point underlined the V-shaped recovery in the stock market given the calamity that caused August’s big drawdown was partially predicated on concerns over the U.S. economy. In its earnings conference call, Walmart refuted rumors of the death of the consumer:
“So far, we aren’t experiencing a weaker consumer overall. Around the world, our customers and members continue to want four things. They want value; they want a broad assortment of items and services; they want a convenient and enjoyable experience buying them; and they want to do business with a company they trust. These four things are constant. But the way we provide them is changing and changing fast. The results we’re delivering are due to real progress across these dimensions.”
Perhaps most importantly for these consumers, WMT is leading the fight against inflation:
“As it relates to value, we’re lowering prices. For the quarter, both Walmart U.S. and Sam’s Club U.S. were slightly deflationary overall. Walmart U.S. food prices were slightly inflated as we exit Q2, but down 30 basis points versus Q1. In Walmart U.S., we have more than 7,200 rollbacks across categories. Customers from all income levels are looking for value, and we have it.”
Anyone ready for an economic “soft-landing”?
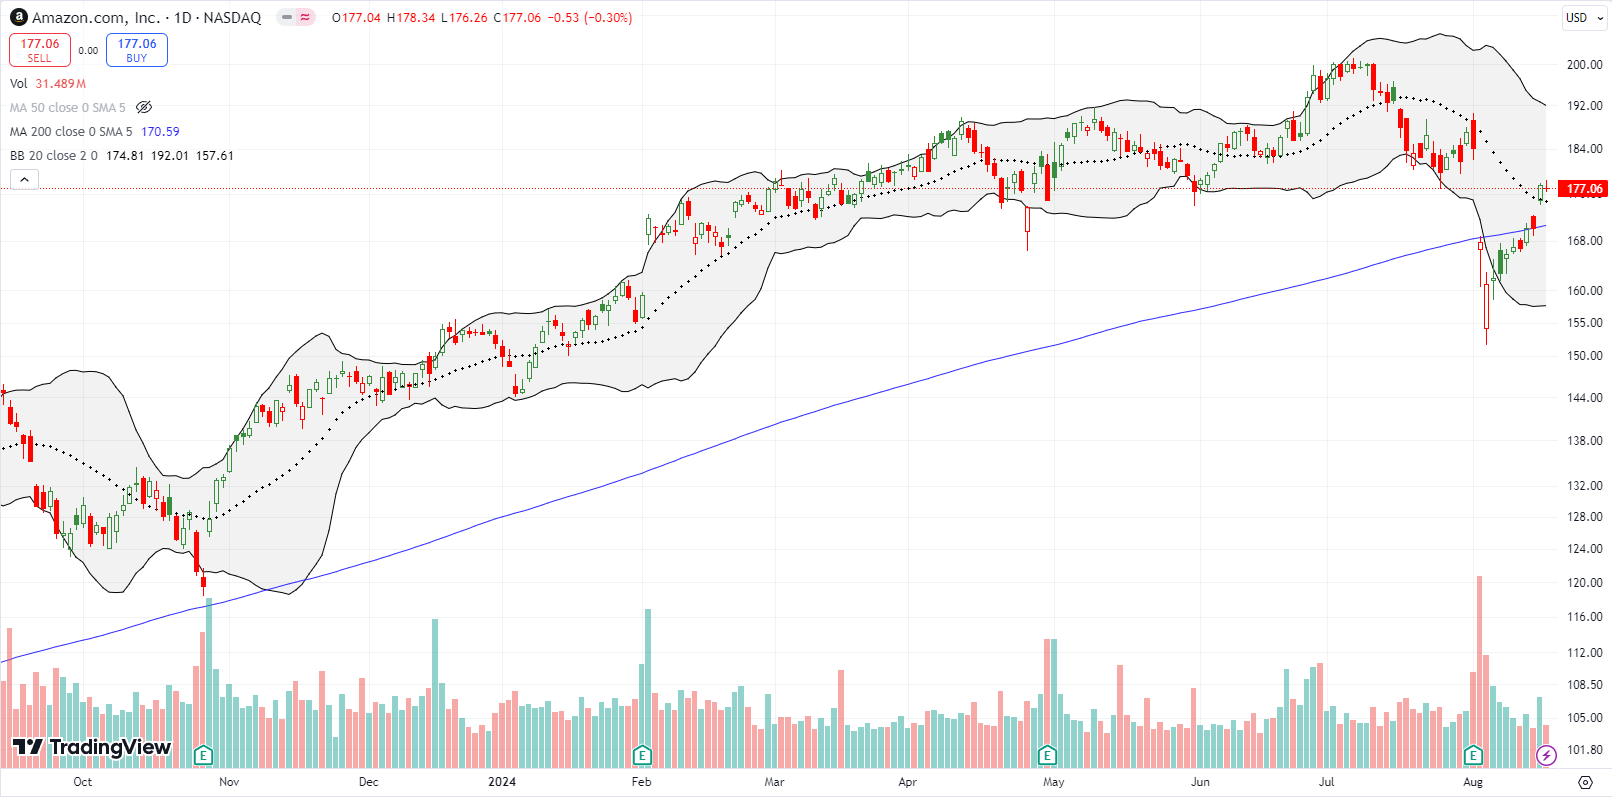
It was a close call, but the 2-week post-earnings trade on Amazon.com (AMZN) worked out. Thursday’s 4.4% gap higher came in sympathy with WMT’s blockbuster earnings combined with the strong showing for retail sales. I amplified the win on this trade by gulping hard earlier in the week and adding another call option at less than half the price of the first one. AMZN has a lot of work remaining to fill its gap from August’s calamity. Still, the stock closed above its 20DMA (the dashed line) and thus confirmed a 200DMA breakout.
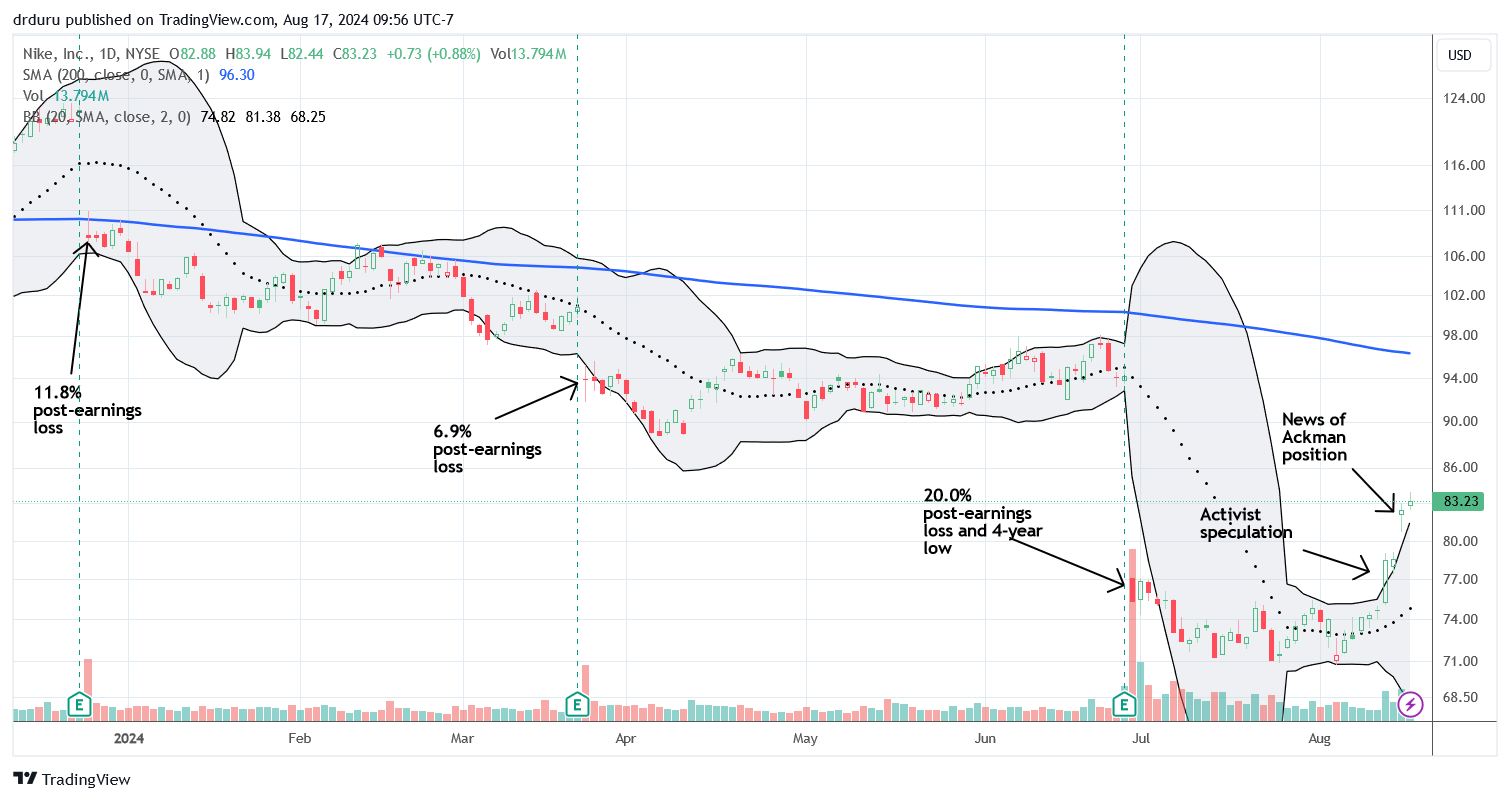
With the big win in betting on the Cramer bottom for Starbucks (SBUX) fresh on my trading books, I jumped when I saw Nike (NKE) rallying on rumors of activist involvement. The stock was already trading above its upper Bollinger Band (BB), but I dove right in. Yet, I was actually not aggressive enough. I chose a covered call position and separate calls hedged with put options; I was bracing for the potential of NKE to sell-off just as SBUX did after news of Elliot’s stake. Instead, buyers learned the lesson from SBUX and maintained their focus. NKE soared even higher two days later after news of Bill Ackman establishing a position in NKE.
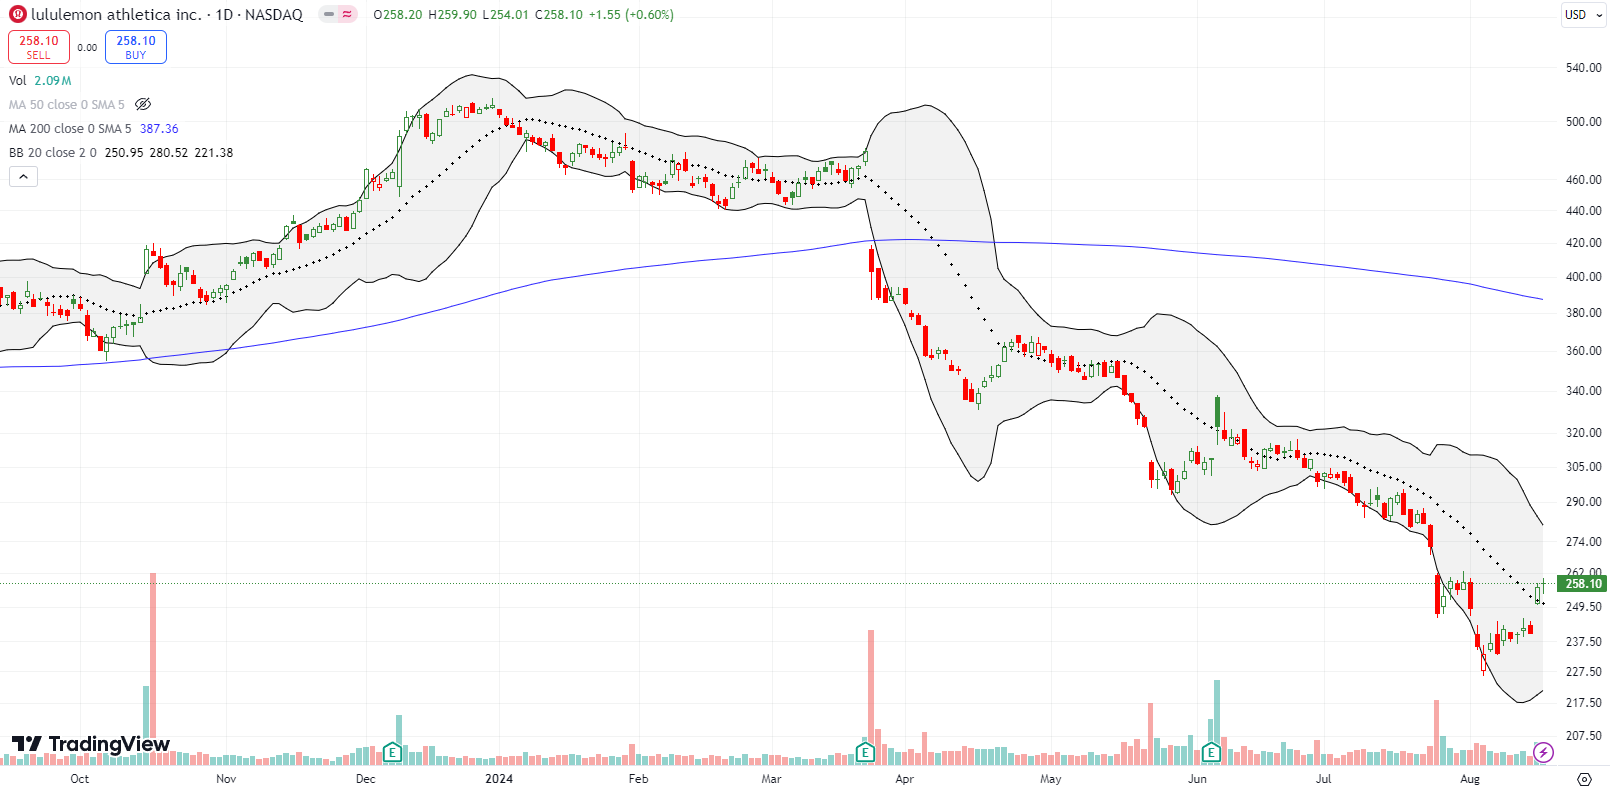
With the increasing interest in beat-up retail stocks, eyes might start turning to lululemon athletica inc (LULU). On retail Thursday, LULU gapped above 20DMA resistance with a 6.6% gain. Friday’s fractional gain barely confirmed the breakout. I bought shares anyway as these signals are sufficient for me to take the risk. My stop loss is below Thursday’s intraday low. Note well a downtrend is still very much in effect. The downtrending 50DMA currently sits around $280 (not shown).
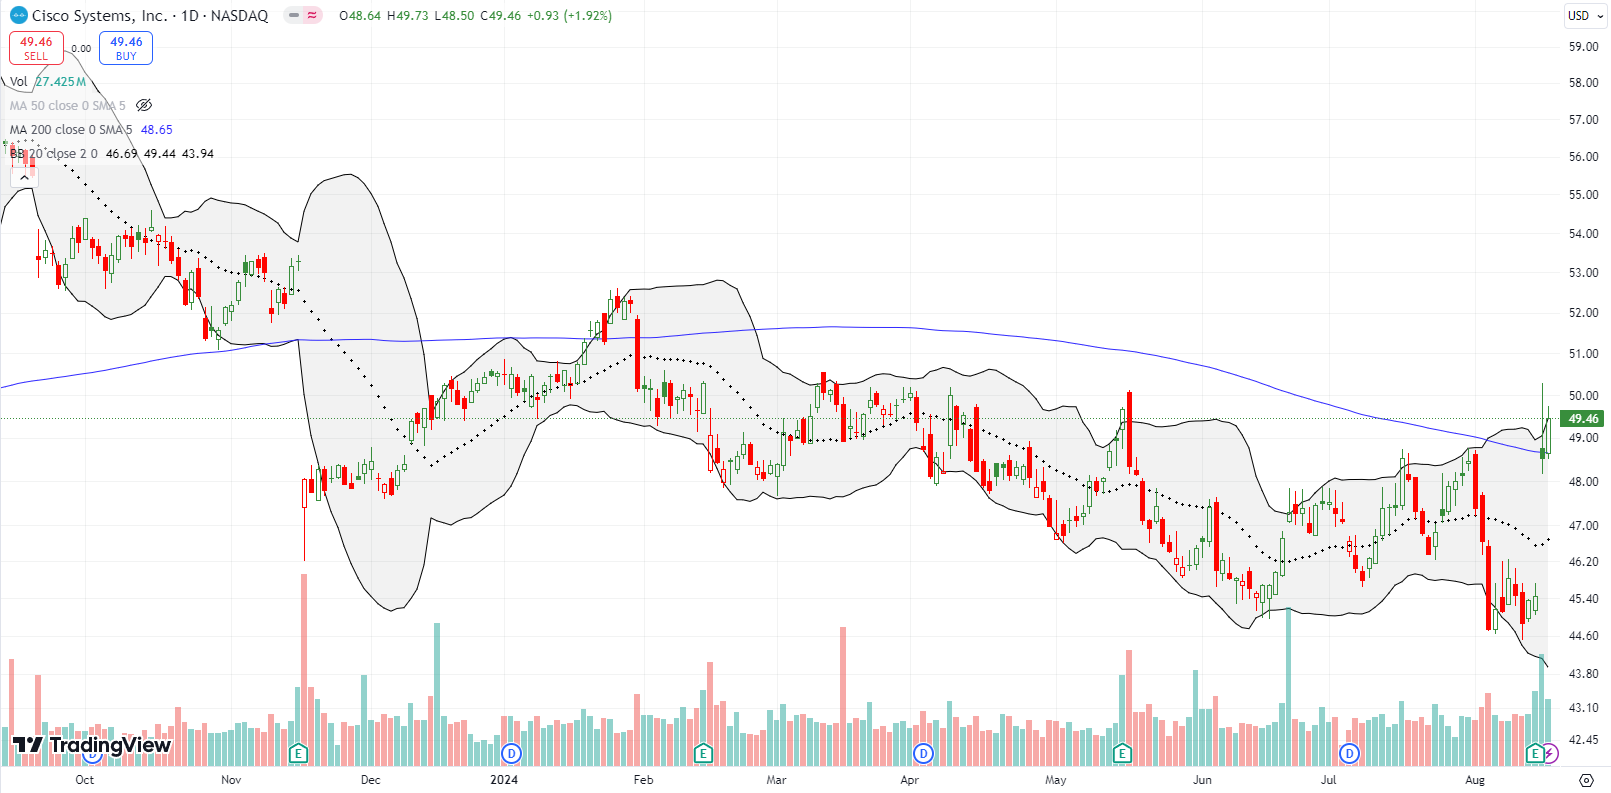
Cisco Systems, Inc (CSCO) is big cap tech but a major laggard. Even with last week’s 6.9% post-earnings gain, CSCO is still down for the year. However, with Friday’s close creating a confirmed 200DMA breakout, CSCO becomes an “easy” trade. The stop loss point is well-defined with a close below the post-earnings intraday low which would also invalidate the 200DMA breakout. CSCO is on my buy list for the coming week.
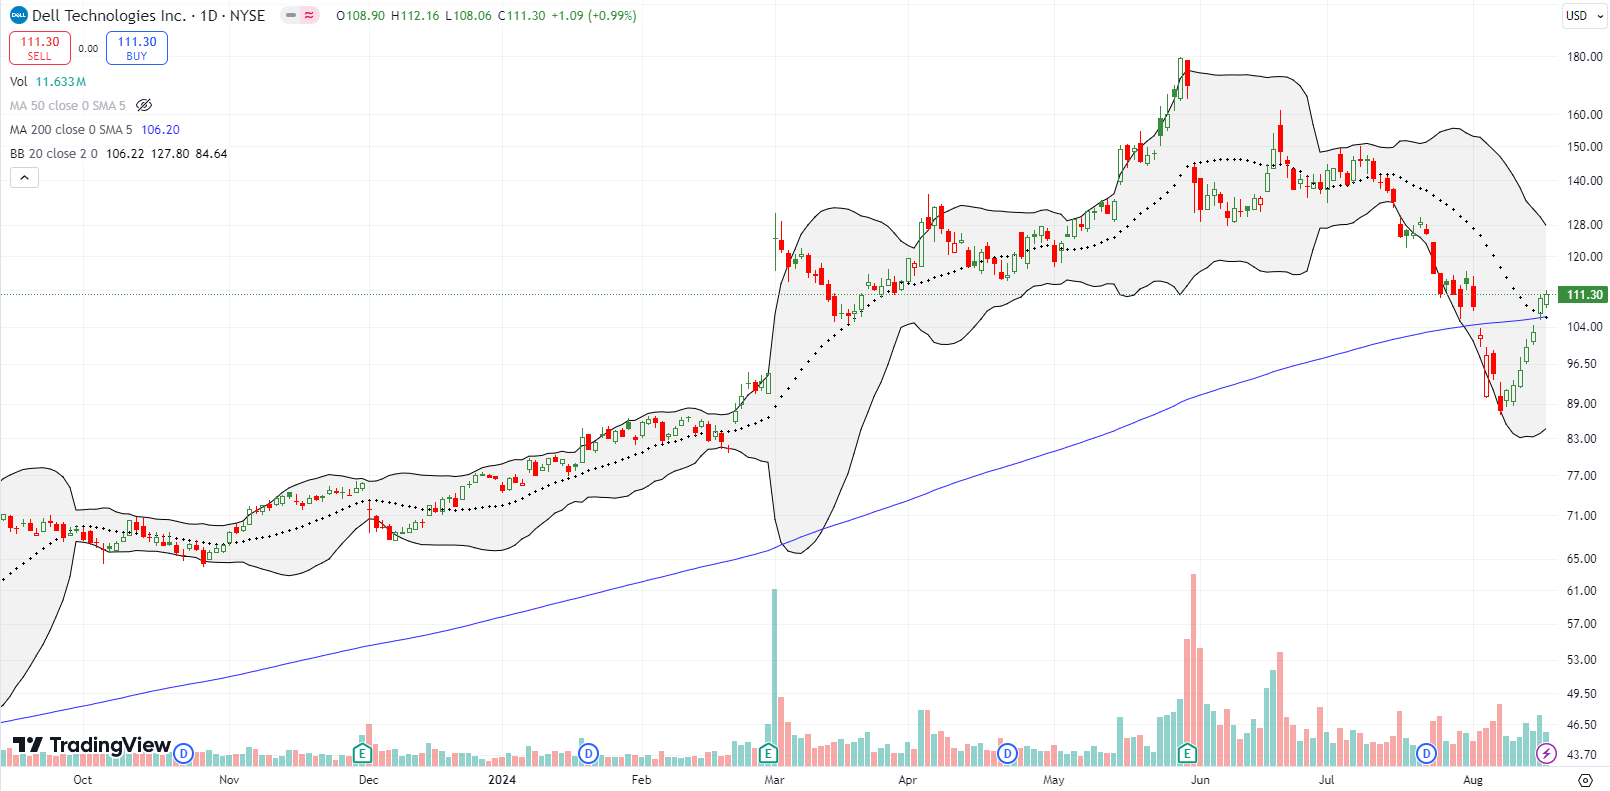
Dell Technologies (DELL) was a major (surprise) story going into May earnings. A 17.9% post-earnings collapse brought a hush into the room. I started buying DELL shares for the first time soon after the collapse; DELL was a recent addition to the generative AI basket. I felt like a genius as DELL rallied sharply soon after. The excitement cooled from there and then turned into a fresh rout. DELL sank into and beyond the August calamity. Given DELL failed to hold the lows of the August calamity, I decided to wait on making a fresh (third) purchase of shares. I finally added to my position on Friday as DELL appeared to confirm a 200DMA breakout.
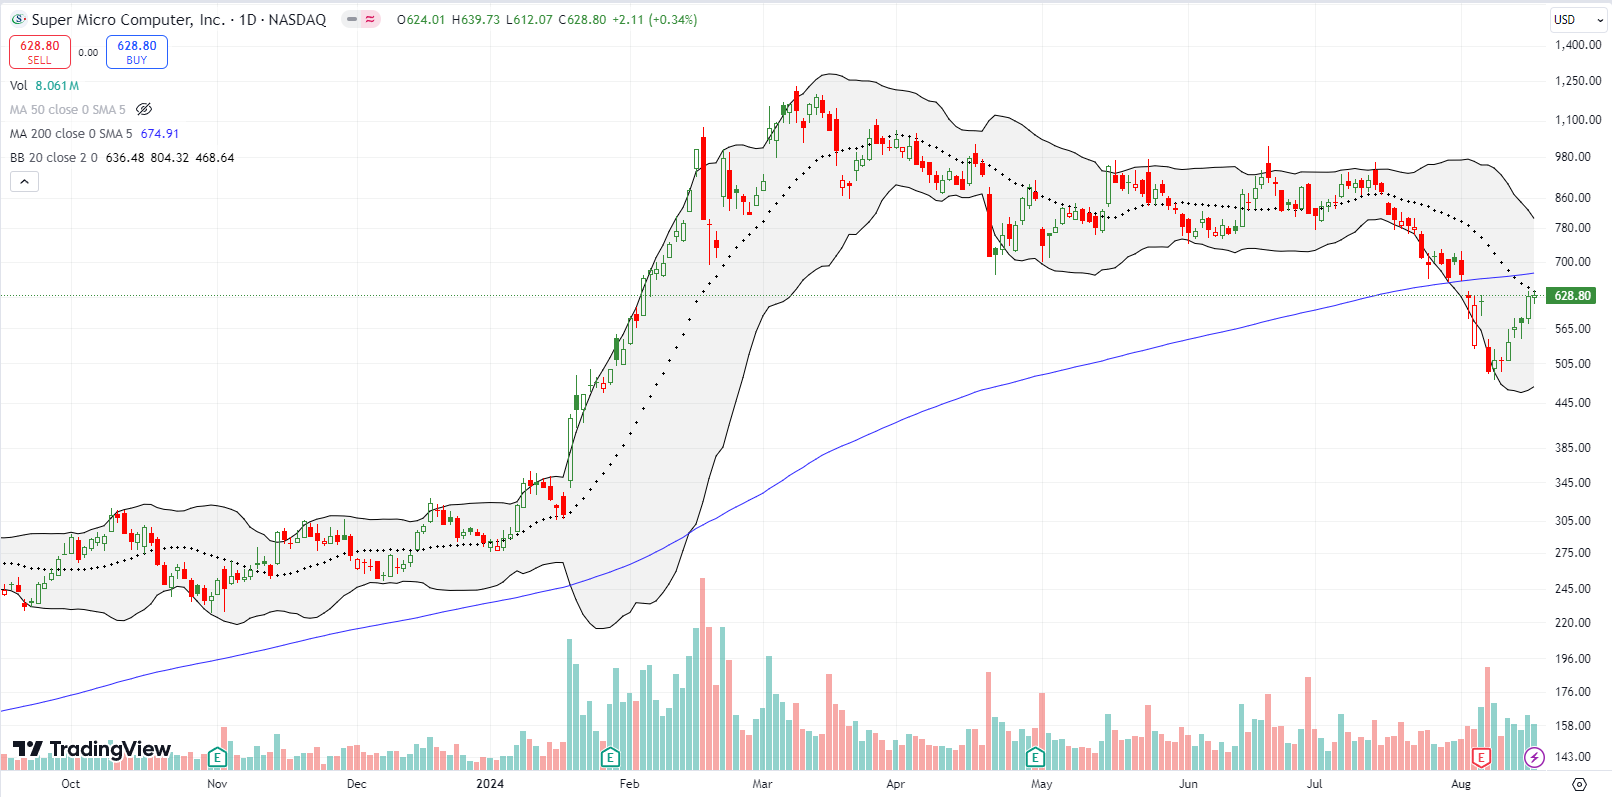
In the middle of August’s calamity, I claimed that Super Micro Computer, Inc (SMCI) faced a major test with its August earnings report. SMCI definitively failed that test with a 20.1% post-earnings loss. The stock looked ready to finish reversing all its heady gains of the year. Instead, SMCI pulled off a quick turnaround and rallied all of last week. SMCI is now battling with 20DMA resistance and faces an even tougher challenge against 200DMA resistance after that. Typically, I would want to fade this kind of rally right around these important points of resistance. However, the size of August’s selling was so severe, it is quite possible that motivated sellers have already abandoned the stock. So, I am more interested to see whether I can buy a confirmed 200DMA breakout in SMCI.
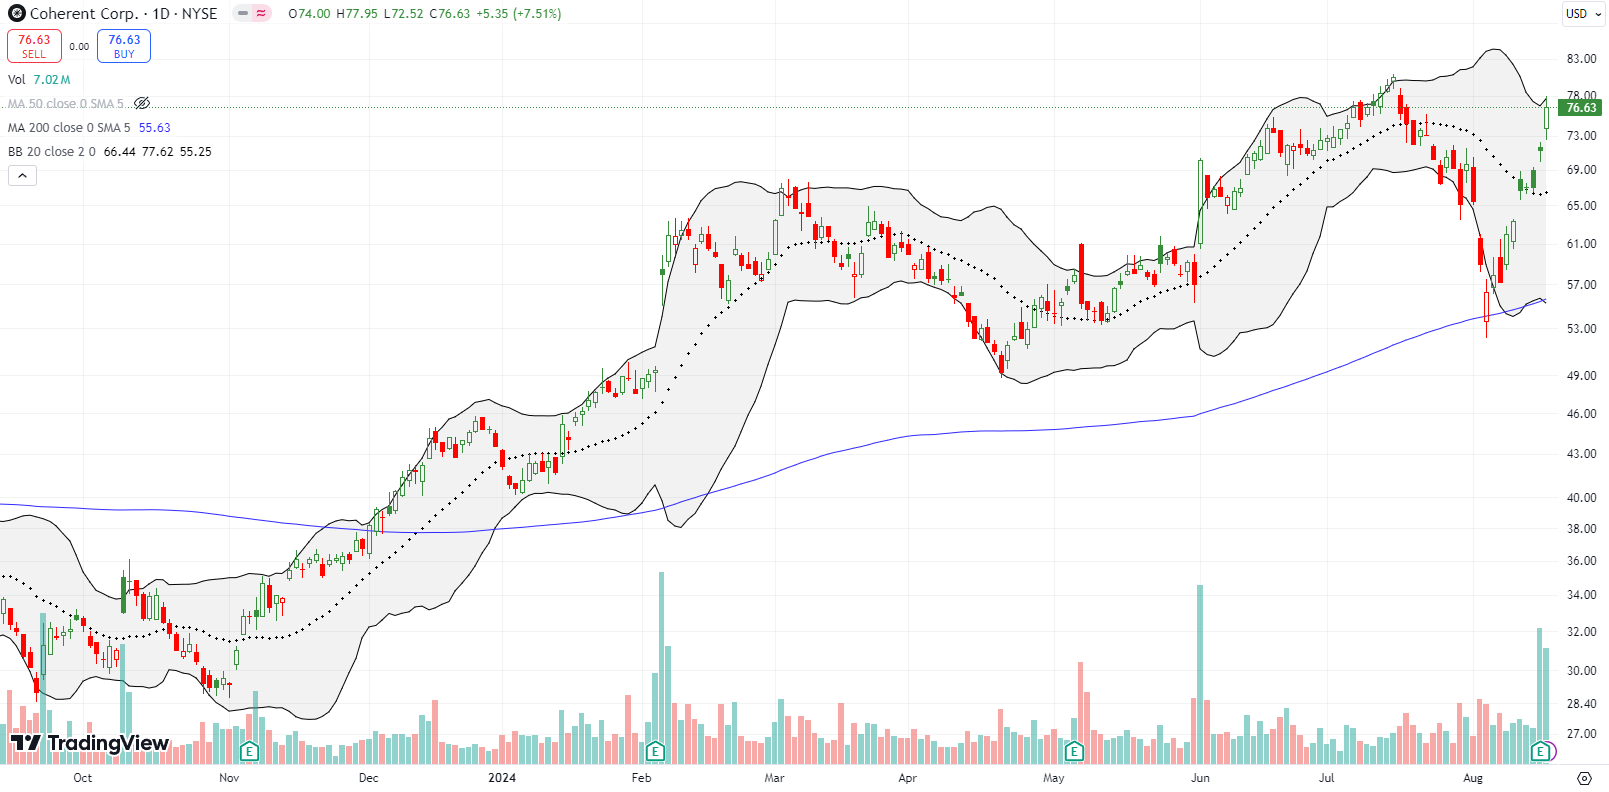
Coherent Corp (COHR) “develops, manufactures, and markets engineered materials, optoelectronic components, and devices worldwide” according to Seeking Alpha. Given that, I looked to see how COHR is participating in the Artificial Intelligence (AI) boom. Sure enough, I found gold early into the earnings conference call (emphasis mine):
“Coherent is an industry leader across many product lines, and we’re driving innovation in secular growth applications that will change how we live and work. One of the most exciting growth opportunities is our optical transceiver technology, which underpins and drives the high-speed connectivity required by new AI data centers.
While I believe this is a tremendous opportunity for the company, there are many other examples of secular growth opportunities ahead of us. Opportunities such as next-generation telecom systems, advanced displays, semi-cap equipment for next-gen fabs, industrial automation and robotics, EVs, and many others.”
Needless to say, this company excites me. The 7.5% post-earnings gain cements COHR’s V-shaped recovery from a successful test of 200DMA support. With the stock near its 2024 high, I am looking to buy dips and hoping the overall uptrend eventually resumes. While COHR’s P/E is a little rich, its price/sales and price/book ratios are quite attractive at 2.2 and 1.8 on a forward basis.
Be careful out there!
Footnotes
Subscribe for free to get email notifications of future posts!
“Above the 50” (AT50) uses the percentage of stocks trading above their respective 50-day moving averages (DMAs) to measure breadth in the stock market. Breadth defines the distribution of participation in a rally or sell-off. As a result, AT50 identifies extremes in market sentiment that are likely to reverse. Above the 50 is my alternative name for “MMFI” which is a symbol TradingView.com and other chart vendors use for this breadth indicator. Learn more about AT50 on my Market Breadth Resource Page. AT200, or MMTH, measures the percentage of stocks trading above their respective 200DMAs.
Active AT50 (MMFI) periods: Day #184 over 20%, Day #83 over 30%, Day #7 over 40%, Day #2 over 50%, Day #26 under 60%, Day #22 under 70%
Source for charts unless otherwise noted: TradingView.com
Full disclosure: long SPY put spread and puts, long IWM shares, call spread, and calls; long DELL, long LULU, long NKE hedged position,
FOLLOW Dr. Duru’s commentary on financial markets via StockTwits, Twitter, and even Instagram!
*Charting notes: Stock prices are not adjusted for dividends. Candlestick charts use hollow bodies: open candles indicate a close higher than the open, filled candles indicate an open higher than the close.

Given the confluence of $MMFI and VIX signals, I was surprised you stayed neutral after the Monday “flash crash”. Personally at the time I believed the deep trough was due more to short-lived yen carry trade unwinds and associated feedback than the recession panic credited by financial media pundits, so I bought a wish-list position in F. That has worked out well so far.
One-word warning about Cisco: layoffs.
It was tempting to flip to by, but it would have been too much of a departure from the AT50 trading rules. I hate using discretionary exceptions. Note that I have not talked about shorting beyond a small hedge using SPY put options. There have been few to no good setups for shorts. So, by default, my neutral has executed as a buy. I expect to see some short setups trickle into the radar over the next week or two though.
Poor CSCO….I’m assuming it will not follow INTC into a total collapse.