

Stock Market Commentary
The latest overbought period lasted two days, a typical duration. However, the start of the period was atypical given the fuel from historic heroics from small cap stocks. The end of the overbought period was remarkable by delivering some of the clearest topping signals of the year. Key indices that soared into the overbought period, sharply faded coming out of the overbought period. They created blow-off top and double top formations. The S&P 500 and the NASDAQ managed to gap down to start the end of the overbought period, with the NASDAQ confirming a bearish engulfing topping formation.
Political drama is looming over this bearish swirl, mainly fresh geopolitical tensions with China on the campaign trail and from U.S. arms sales to Taiwan. The sudden burst in volatility delivered a reminder that the path from here to the November elections, and perhaps beyond, could be full of on-going surprises for the stock market, both up and down. The largely tranquil trading of most of this year is fading away.
The Stock Market Indices
The S&P 500 (SPY) topped out right on the first overbought day. The index gapped down the next day for a 1.4% loss. Sellers confirmed the top with a follow-through 0.8% loss. The S&P 500 closed right on top of support at its 20-day moving average (DMA) (the dotted line). This support has held firm since the May breakout, so it is a critical line in the sand. I bought an SPY put at the gap down and took profits at 20DMA support. Recall from my last Market Breadth post that I am assuming that the year-to-date lesson demonstrates bears will only get a small window of opportunity…until proven otherwise.
")
The NASDAQ (COMPQ) has already broken 20DMA support as sellers over-rotate. This breakdown confirms the bearish engulfing topping pattern from the previous week. After the NASDAQ’s gap down, I bought a QQQ put calendar spread expecting to carry the long side into next week. Instead, the follow-through selling triggered my spread’s profit target on Thursday. I will look to fade a bounce on Friday.
")
The iShares Russell 2000 ETF (IWM) went from parabolic hero to fading zero. On Wednesday buyers pushed the ETF of small caps to a fresh two and a half year high only to let IWM slip to a 1.1% loss on the day. Sellers followed through with a 1.9% loss that included a fade from a test of the closing high from the parabolic run-up. The two straight days of fades from highs create a likely blow-off top. In my last Market Breadth post I stated “IWM has gone parabolic, so I am even less interested in going long here. All I can do is watch and wait to see how this parabolic move cools off.” If the cooling is a blow-off top then IWM may not look interesting for a buy until a test of 20/50 DMA support.
")
The Short-Term Trading Call With A Blow-Off Top
- AT50 (MMFI) = 66.7% of stocks are trading above their respective 50-day moving averages (ending 2 days overbought)
- AT200 (MMTH) = 65.0% of stocks are trading above their respective 200-day moving averages
- Short-term Trading Call: bearish
AT50 (MMFI), the percentage of stocks trading above their respective 50DMAs, dropped to 66.7% after two days overbought (over the 70% threshold). This move triggers a bearish short-term trading call according to the AT50 trading rules. Note that I (aggressively) flipped bearish after the gap down in the major indices because of the topping technical setups. The blow-off top formation on IWM sealed the deal. If my favorite technical indicator quickly rebounds into overbought territory, I will stay bearish until/unless the topping patterns get invalidated across the major indices.
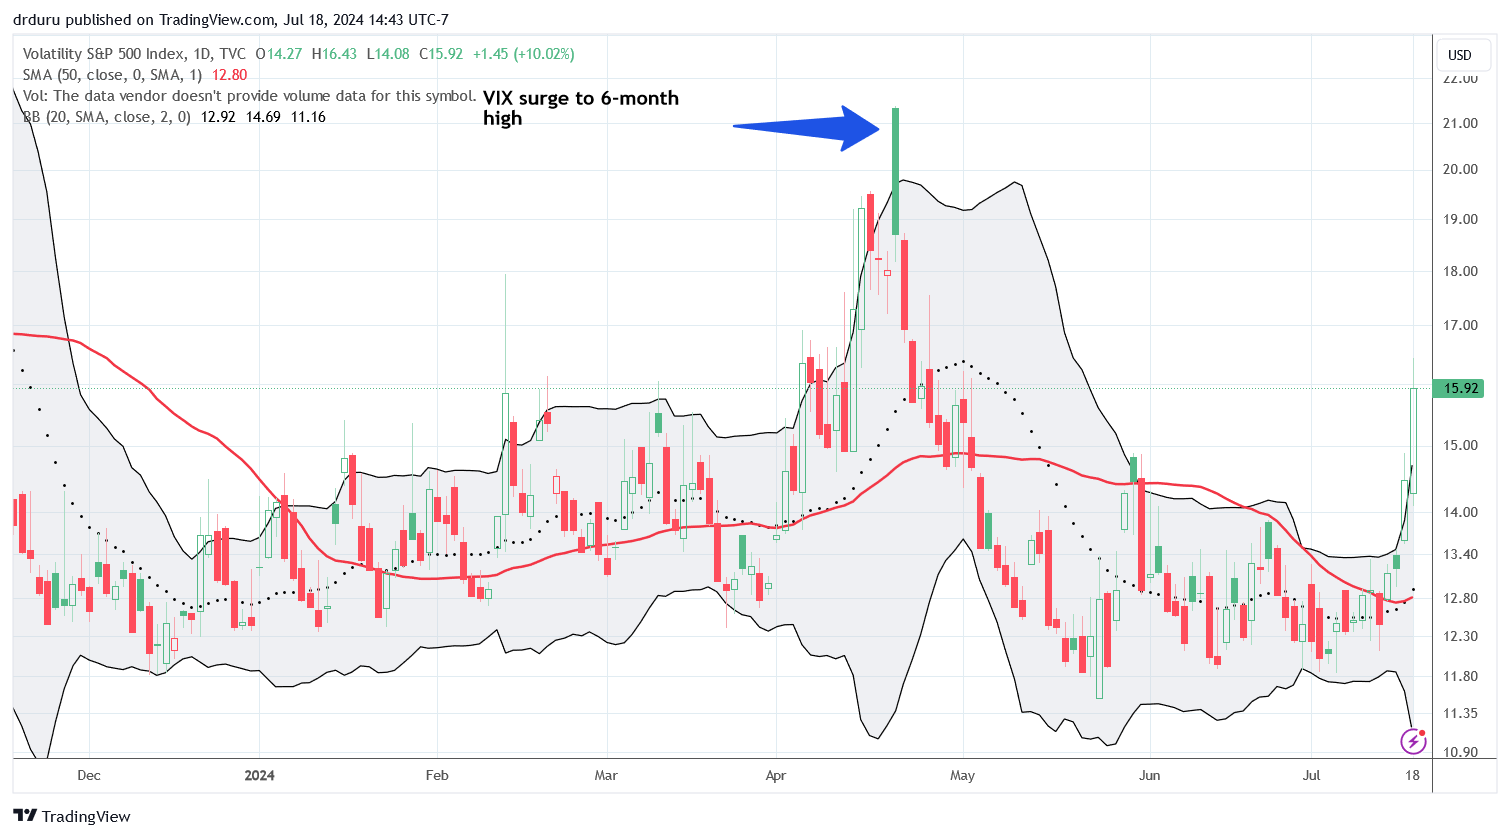
The volatility index (VIX) also motivated me to get bearish a day early. The VIX jumped 9.6% after the gap downs and surged another 10.0% the next day. The upshot of this sharp increase is that the VIX cannot sustain long run-ups. Thus, while the VIX confirmed a bearish turn in sentiment, it also started a timer on the window of opportunity for the bears. I will be surprised if this cycle produces a challenge of the VIX’s intraday high from the April pullback in the stock market.
The SPDR S&P Regional Banking ETF (KRE) managed to gain 1.2% despite the gap down in the S&P 500. With my bearish short-term trading call, I targeted KRE for a fade with put options, and the ETF delivered. The resulting pattern could be the first day of a blow-off top that ends a parabolic and over-heated run-up.
")
The iShares US Home Construction ETF (ITB) delivered one of the worst fades of the day despite scoring a 1.9% gain. ITB soared on the wings of a strong response to earnings from DR Horton (DHI). DHI was up as much as 12.7% before settling back to a 10.0% gain. With the stock stretched so far above its upper Bollinger Band (BB), I speculated on a put option. It occured to me too late that I should have faded ITB given all the builders running up on the day were only riding DHI’s coattails.
The big headline from DHI earnings was a massive $4B share buyback. That buyback is surprising given DHI was trading near all-time highs going into earnings. Regardless, DHI narrowed guidance for the year. This news is not a headline burner except it comes after a big downgrade from Citigroup the previous week. Perhaps sellers on that downgrade rushed to get back into the stock!
Several builders closed negative on the day like KBH and LGIH.
")
The run as market darlings may be coming to an end for semiconductors. The VanEck Semiconductor ETF (SMH) gapped down and lost 7.1% to lead tech stocks down on Wednesday. I reflexively bought a weekly call spread (expiring next week); but given my bearishness this position now serves as an upside hedge.
Buyers stepped in to defend SMH at its 50DMA support the next day. The move looks tepid and the 20DMA is now turning downward. A 50DMA breakdown will confirm the double-top from the June and July highs. (Weakness in semiconductors spells big trouble for my generative AI trade!).
")
The “rolling recession” in consumer-related stocks continues. Five Below, Inc (FIVE) crashed 25.1% post-earnings and hit a 4+ year low. The stock flagged trouble all year with two prior, large post-earnings losses and a year-to-date downtrend.
The budget retailer lost its CEO and cut its forecast. During the conference call, management revealed that “consumers were more discerning with their dollars, increasingly buying to need…The quarter solidified that consumers are feeling the impact of multiple years of inflation across many key categories, such as food, fuel, and rent, and are therefore far more deliberate with their discretionary dollars.” More and more consumer-facing companies are reporting similar issues, but these reports are dribbling out rather than overwhelming the market all at once.
")
Given the big day, I recorded an update to my Chipotle Mexican Grill (CMG) and NVIDIA (NVDA) technical analyses:
")
")
Be careful out there!
Footnotes
Subscribe for free to get email notifications of future posts!
“Above the 50” (AT50) uses the percentage of stocks trading above their respective 50-day moving averages (DMAs) to measure breadth in the stock market. Breadth defines the distribution of participation in a rally or sell-off. As a result, AT50 identifies extremes in market sentiment that are likely to reverse. Above the 50 is my alternative name for “MMFI” which is a symbol TradingView.com and other chart vendors use for this breadth indicator. Learn more about AT50 on my Market Breadth Resource Page. AT200, or MMTH, measures the percentage of stocks trading above their respective 200DMAs.
Active AT50 (MMFI) periods: Day #163 over 20%, Day #62 over 30%, Day #9 over 40%, Day #6 over 50%, Day #5 over 60%, Day #1 under 70% (underperiod ending 2 days overbought, above 70%)
Source for charts unless otherwise noted: TradingView.com
Full disclosure: long SPY put spread, long KRE puts, long DHI put
FOLLOW Dr. Duru’s commentary on financial markets via StockTwits, Twitter, and even Instagram!
*Charting notes: Stock prices are not adjusted for dividends. Candlestick charts use hollow bodies: open candles indicate a close higher than the open, filled candles indicate an open higher than the close.