

Stock Market Commentary
Last week further emphasized the continuation of notable divergence from Q2 to Q3. This time, soft inflation data caused a surge in rate cut anticipation that in turn drove a significant rotation away from big cap growth and tech stocks and toward small caps and a whole host of other rate sensitive sectors. I covered the impressive dynamics in “Now the Market Just Needs Rate Cuts” in Inflation Watch. In particular, the breakout in small caps looks significant and sustainable even as the S&P 500 and the NASDAQ now look toppy. The bears have let numerous toppy moments slip through their fingers, so they have a lot to prove during this latest round of toppiness. In the meantime, I am back on watch for a test of overbought trading conditions.
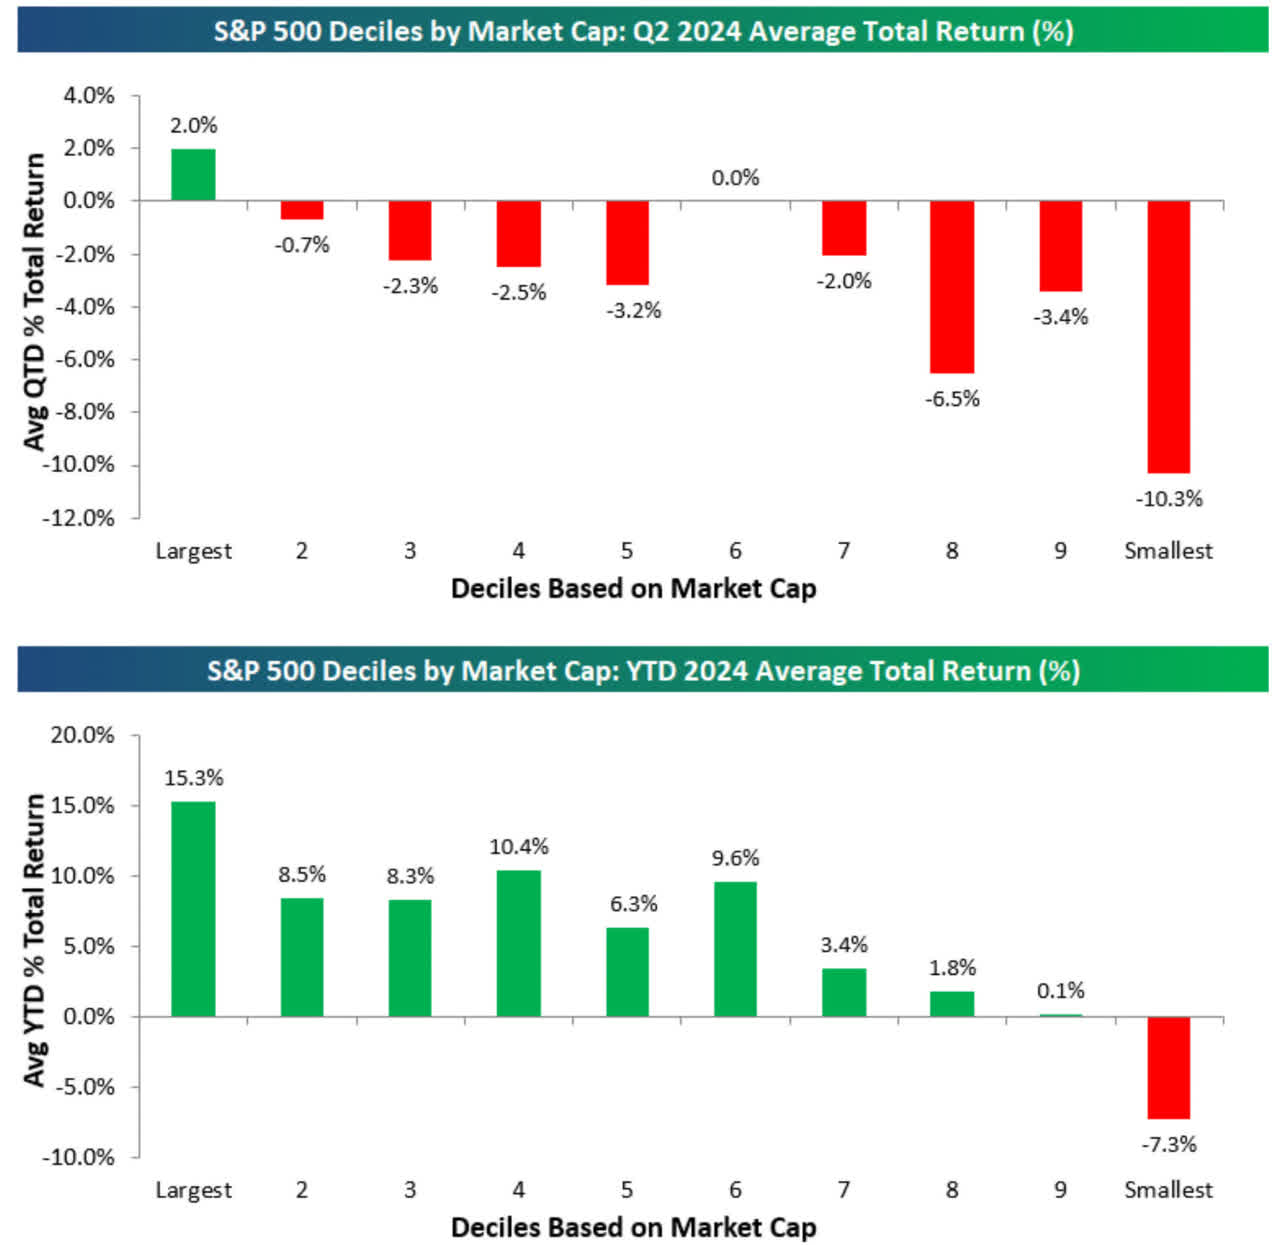
A long-time reader pointed me to two amazing charts from June 18, 2024 in “Fed Awaits Better Inflation Data, Treasury Yields Continue To Decline” that show the lopsided advantage held by big cap stocks. The imbalance looks particularly dramatic in Q2 given only the largest decile eked out a gain for the quarter (at the time). Year-to-date the biggest stocks wielded a significant performance advantage. This imbalance is the tip of the iceberg of notable divergences in market breadth.
The Stock Market Indices
The S&P 500 (SPY) responded to the soft inflation data by retreating 0.9%. The reversal created a bearish engulfing technical pattern that made the index once again look toppy. True to form, buyers stepped right in the next day to invalidate the topping pattern and cut bearish anticipation at the knees. However, buyers fell just short. The S&P 500 faded from an intraday all-time high and closed Friday with a 0.6% gain. Of course, with the index’s uptrend well intact, the bulls remain in control until proven otherwise.
")
The NASDAQ (COMPQ) suffered a worse bearish engulfing pattern and thus look a lot more toppy than the S&P 500. The tech-laden index lost 2.0% on Thursday as a full rotation out of tech went into effect. The exit was so complete that Friday’s rebound effort from buyers failed to reverse the loss at any point in the day. So unlike the S&P 500, the NASDAQ remains fully weighed down by the topping pattern. I daresay the NASDAQ finally looks ready to test its uptrend at the 20-day moving average (DMA) (the dotted line below).
On Friday, I took profits on my QQQ calendar spread. I did not buy a fresh tranche.
")
The iShares Russell 2000 ETF (IWM) was finally a big winner of the week. IWM led the way for the surge in market breadth. The big rotation away from growth and tech stocks helped to send IWM soaring 3.6% on Thursday. The move was so fast that I did not have time to think about raising my target sell price for my IWM call options. Needless to say, I left a good amount of money on the table as IWM gapped higher a second day on Friday with a 1.2% gain.
IWM set a 2-year high but faded sharply from its intraday high. The ETF of small caps is also well above its upper Bollinger Band (BB) and thus due to cool off. Still, with the market eagerly looking forward to imminent rate cuts, IWM should finally receive enough support to hold this breakout.
")
The Short-Term Trading Call With Toppy Indices
- AT50 (MMFI) = 63.3% of stocks are trading above their respective 50-day moving averages
- AT200 (MMTH) = 62.0% of stocks are trading above their respective 200-day moving averages
- Short-term Trading Call: neutral
AT50 (MMFI), the percentage of stocks trading above their respective 50DMAs, enjoyed a surge in market breadth by running from 45.6% to 63.3% in just two days. This breakout by my favorite technical indicator brought an end to a downtrend and positioned AT50 just under the overbought threshold of 70%. With the S&P 500 and the NASDAQ looking toppy, I strongly suspect that AT50 will get rejected at the overbought threshold and confirm a bearish tone for the market. Whether sellers will have the ability and motivation to follow through is a whole different matter. So, as usual, I will take the assessment of the trading call one day at a time. I am keeping the trading call at neutral for now and am eagerly awaiting the next change. In the meantime, I maintain partial hedges with SPY puts.
Tesla, Inc (TSLA) went parabolic after starting July with a major breakout. The overall run-up included 9 straight days closing above or at the upper Bollinger Band (a signature of a parabolic move) and 11 straight days of gains. The run came to a screeching halt on Thursday, likely supported by the big reversal in big cap tech stocks. Headlines reported a delay in Tesla’s much anticipated robotaxi “launch” from August to October. That news was all traders needed for an excuse to take profits. TSLA sold off 8.4% on Thursday. The stock is of course far from dead. Buyers stepped into Friday’s gap down and took the stock to a 3.0% gain on the day. TSLA (magically) closed just under flat for the year.
Last week I had the pleasure of meeting Nia Impact Capital’s Kristin Hull. Among the many things we discussed, along with her effervescent colleagues, was Nia’s activism as a (now smaller) Tesla shareholder. While the investment firm’s proposal fell short of approval, Hull still had the opportunity to make an impassioned and urgent plea to the company to end harassment and discriminatory practices at the company. Hull received 37.6% of the vote of shares not owned by Musk brothers. The video below is a montage of Hull’s day and efforts.
")
Will consumers need to buy cars (Teslas no less) in a world full of cheap robotaxis? Hmmm….
I have followed IT consulting and services company Cognizant Technology Solutions Corp (CTSH) since the dot-com bubble days. A few years ago I had the pleasure of managing and working with consultants from the India-based company. Last week I finally found a fresh reason to buy shares. I should have bought on June’s 50DMA breakout. Thursday’s 3.4% gain confirmed 50DMA support, and I rushed to buy shares on Friday. The stock looks like it is starting a new uptrend. I particularly like CTSH’s surge on high volume while other tech companies retreated.
")
Online shopping site Etsy, Inc (ETSY) has trended down all year. The stock caught my attention again after dropping last week to a 4+ year low. ETSY is on my short list of bearish trades after a rebound to 50DMA resistance. The stock has struggled mightily since reaching an all-time high above $300 in November, 2021.
")
Select consumer discretionary stocks continue to sink and even collapse. Helen of Troy Limited (HELE) crashed last week by 27% post-earnings. The company guided down and included dire consumer commentary like this one from the Seeking Alpha transcript of the earnings conference call (emphasis mine): “As has been widely reported, the macro environment and the health of consumers and retailers has worsened. Consumers are even more financially stretched and are even further prioritizing essentials over discretionary items. Specific to our business, we have seen some areas become more challenged over the last three months.” It is almost like consumer discretionary companies are experiencing a rolling recession…
")
Terran Orbital Corporation (LLAP) manufactures satellites. I stumbled on the company after doing a first review of the new CEO of LegalZoom (LZ), Jeff Stibel. He is quite a character, and I look forward to writing about him in my next Seeking Alpha post on LZ. The company’s share price collapsed on news of the sudden departure of the former CEO.
Anyway, I saw Stibel post on LinkedIn a congratulations to LLAP on its IPO. I assumed LLAP is/was a portfolio company of Bryant Stibel along with LegalZoom. I was incorrect, but I am still intrigued by the company given Stibel’s support. The stock is essentially a penny stock at this point and struggling to fight off a fresh all-time low. If the stock can manage a 50DMA breakout, I will risk some major speculation. An environment with rate cuts, or even the anticipation of imminent cuts, is an environment that can and will support the most surprising run-ups.
")
Digital media company and publisher Ziff Davis, Inc (ZD) failed to benefit from last week’s surge in market breadth. ZD traveled in the opposite direction as an earnings warning confirmed 50DMA resistance with a 10.3% loss. The stock closed the week fighting to rebound from a near 10-year low.
")
I just finished comparing audio streaming service Spotify (SPOT) to Warner Music Group (WMG) in a Seeking Alpha piece titled “Warner Music Group Poised to Shed Its Laggard Status.” I did not consider the possibility that the gap in price momentum and valuation might close from SPOT tumbling back to earth. Last week, SPOT confirmed a 50DMA breakdown and looks like it is slowly rolling over.
")
So much for the bullishness in Wells Fargo & Company (WFC). The bank’s stock made a spirited rebound to break out above its 50DMA ahead of earnings. A 6% post-earnings loss took the stock down to a 3-month low. WFC closed the week with a full roundtrip from its last earnings report. Since XLF, the financials ETF, rallied to challenge its high of the year, WFC’s problems look company-specific and not sector related…for now.
")
")
")
Be careful out there!
Footnotes
Subscribe for free to get email notifications of future posts!
“Above the 50” (AT50) uses the percentage of stocks trading above their respective 50-day moving averages (DMAs) to measure breadth in the stock market. Breadth defines the distribution of participation in a rally or sell-off. As a result, AT50 identifies extremes in market sentiment that are likely to reverse. Above the 50 is my alternative name for “MMFI” which is a symbol TradingView.com and other chart vendors use for this breadth indicator. Learn more about AT50 on my Market Breadth Resource Page. AT200, or MMTH, measures the percentage of stocks trading above their respective 200DMAs.
Active AT50 (MMFI) periods: Day #159 over 20%, Day #58 over 30%, Day #5 over 40%, Day #2 over 50%, Day #1 over 60% (overperiod ending 36 days under 60%), Day #126 under 70%
Source for charts unless otherwise noted: TradingView.com
Full disclosure: long SPY put and put spread, long CTSH, long TSLQ, long LZ
FOLLOW Dr. Duru’s commentary on financial markets via StockTwits, Twitter, and even Instagram!
*Charting notes: Stock prices are not adjusted for dividends. Candlestick charts use hollow bodies: open candles indicate a close higher than the open, filled candles indicate an open higher than the close.
Is spotify a buy to trade the earnings this time?
I wouldn’t buy it ahead of earnings. As I mentioned here, SPOT looks like it is topping out. The stock is extremely expensive on a valuation basis, so there is large downside risk if earnings disappoints even a little.
Wow! Amazing move in SPOT. The good news is that today’s gap higher invalidated the topping pattern. SPOT is back in bullish form for now. I personally am still not a buyer though. The stock is too expensive for me on a valuation basis.