Stock Market Commentary
The rally out of the stock market’s last oversold period finally suffered its first strike today as a strong open fizzled into some important fades. The S&P 500 and the NASDAQ tapped highs of the year only to fail into marginally negative closes. Most importantly, market breadth perfectly tapped the threshold for overbought conditions at the open but faded from there. Combined, these fades strike hard enough at the rally to deliver early signs of a potential end to an incredibly bullish run.
The Stock Market Indices
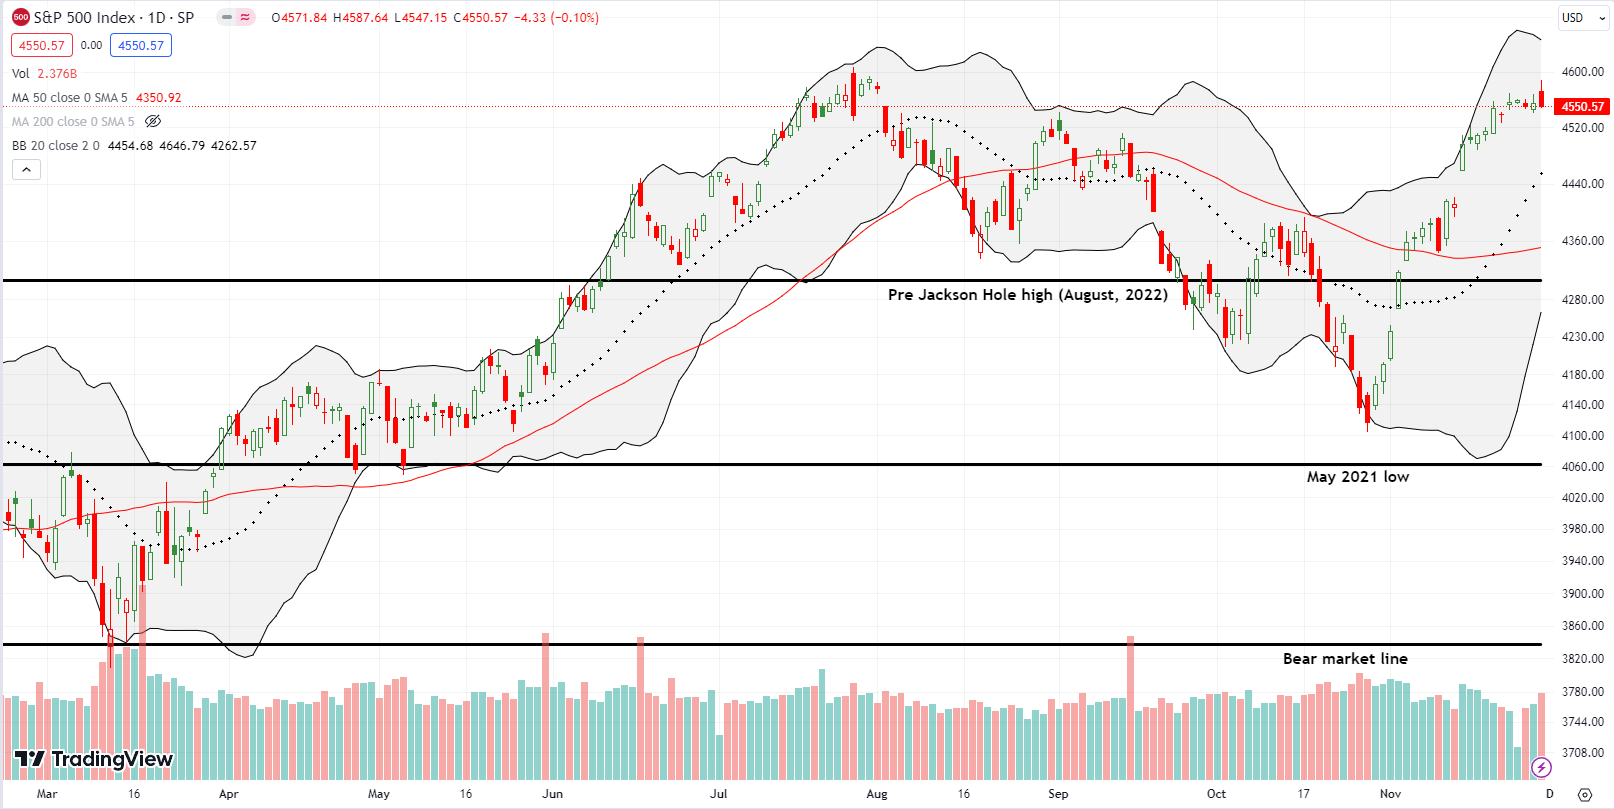
The S&P 500 (SPY) started the day with a gap higher that barely cleared the highs of the current consolidation range. Buyers nudged the index further to the closing high of 2023 before sellers took over and threw their first strike against the current rally. The S&P 500 ended the day flat and left behind a fake breakout. The index is still above the August high, but a potential test of uptrending support at the 20-day moving average (DMA) (the dotted line) suddenly looms on the horizon.
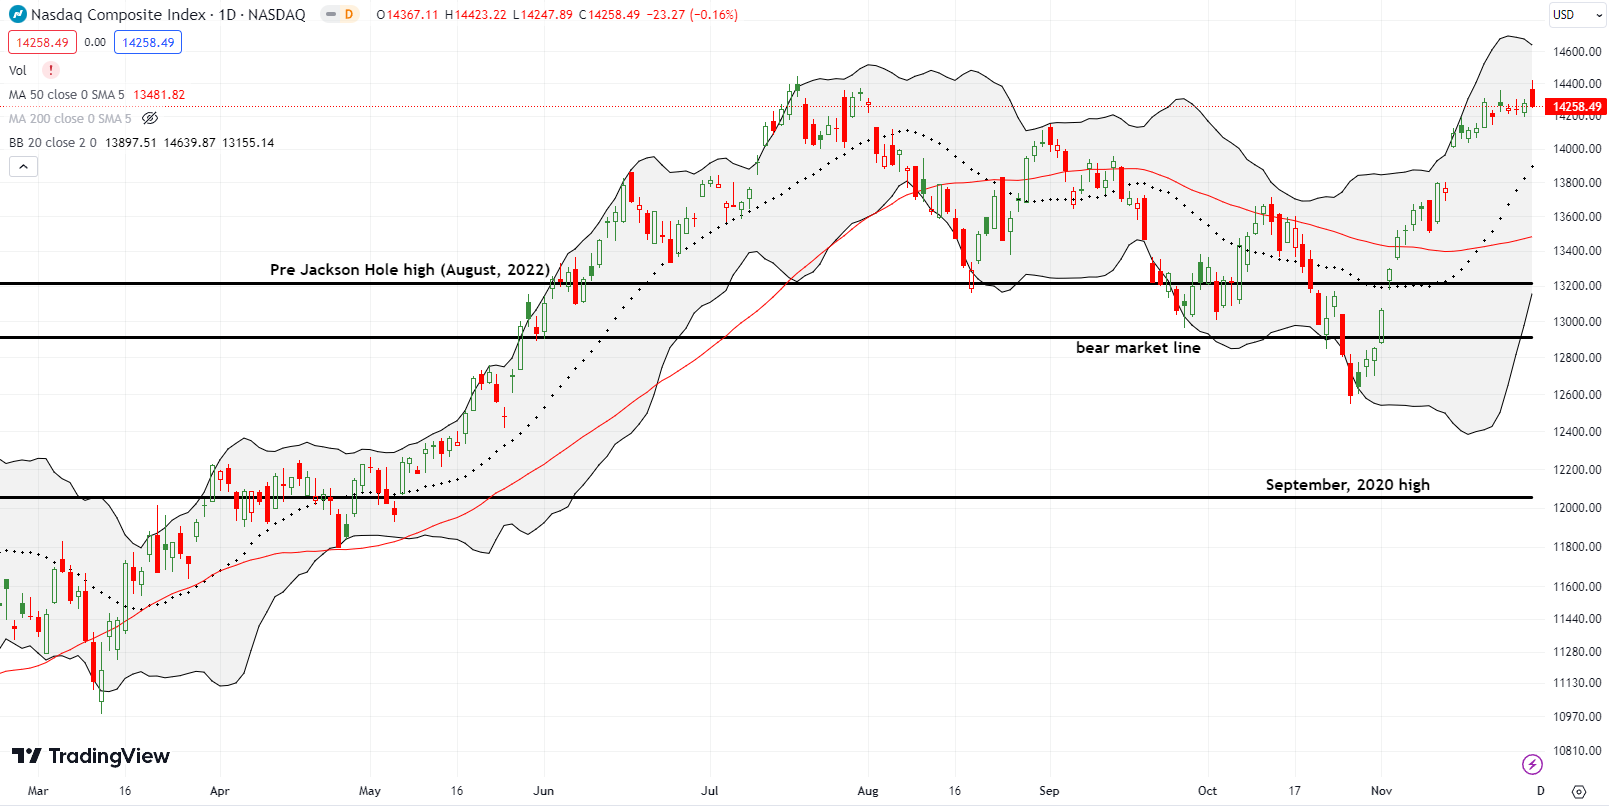
The NASDAQ (COMPQ) still has a pattern similar to the S&P 500. The tech laden index’s fade was slightly more ominous because this first strike against the rally came right under the intraday high of the year.
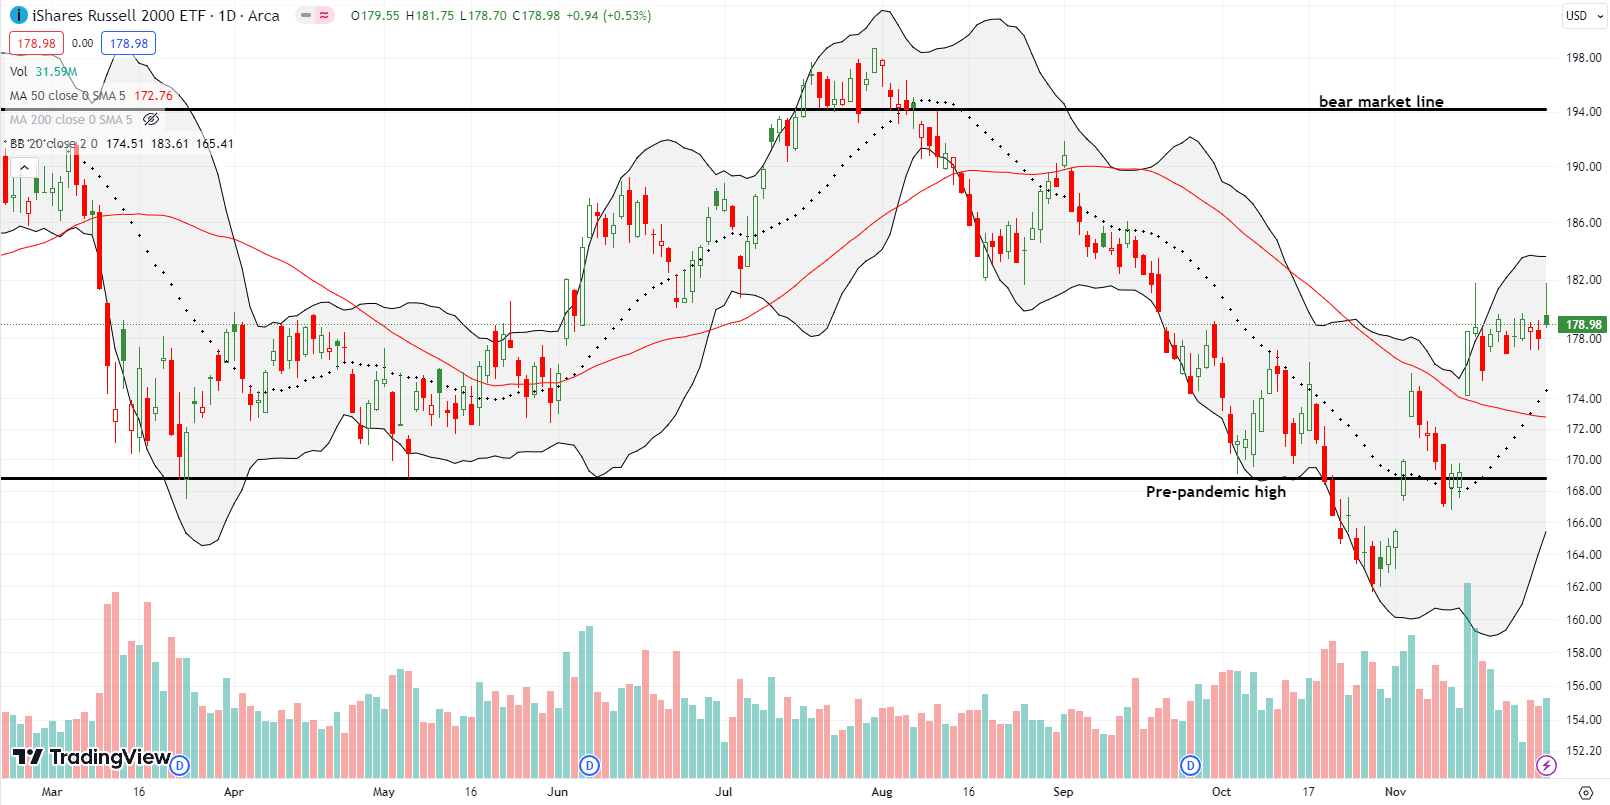
The iShares Russell 2000 ETF (IWM) suffered its own ominous fade. The ETF of small caps rallied exactly to the intraday high from two weeks ago and repeated the fade from that time. IWM returned to a close in the middle of its consolidation period. Still, I bought a calendar call spread with a $182 strike given the high likelihood of the short side expiring worthless this Friday while giving me the opportunity to benefit from upside next week. If the rally succumbs to this first strike, then I will look to a test of 20DMA support as the next proving ground for IWM.
The Short-Term Trading Call With A First Strike
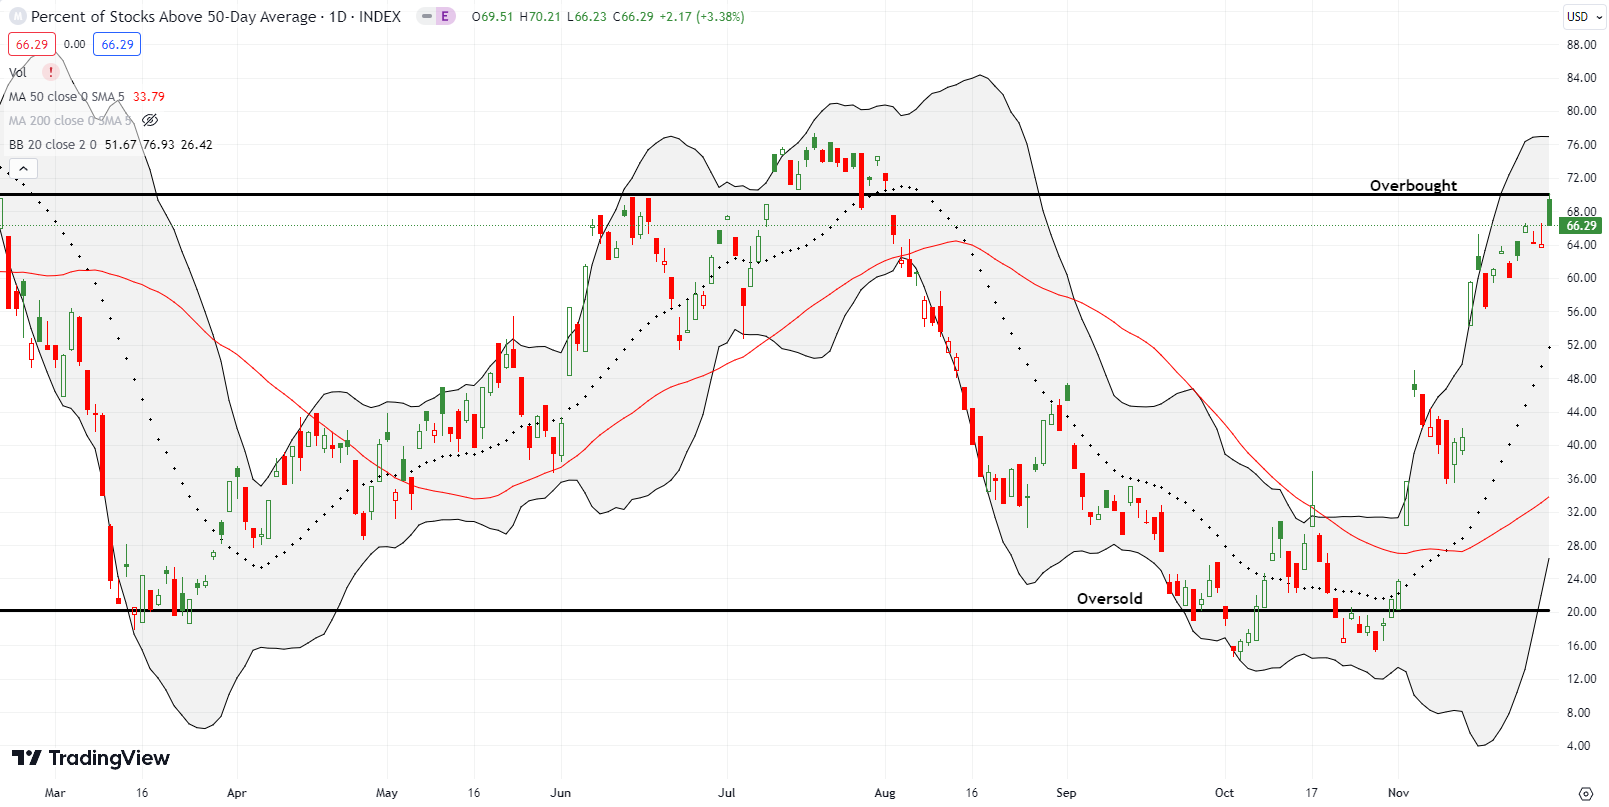
- AT50 (MMFI) = 66.3% of stocks are trading above their respective 50-day moving averages
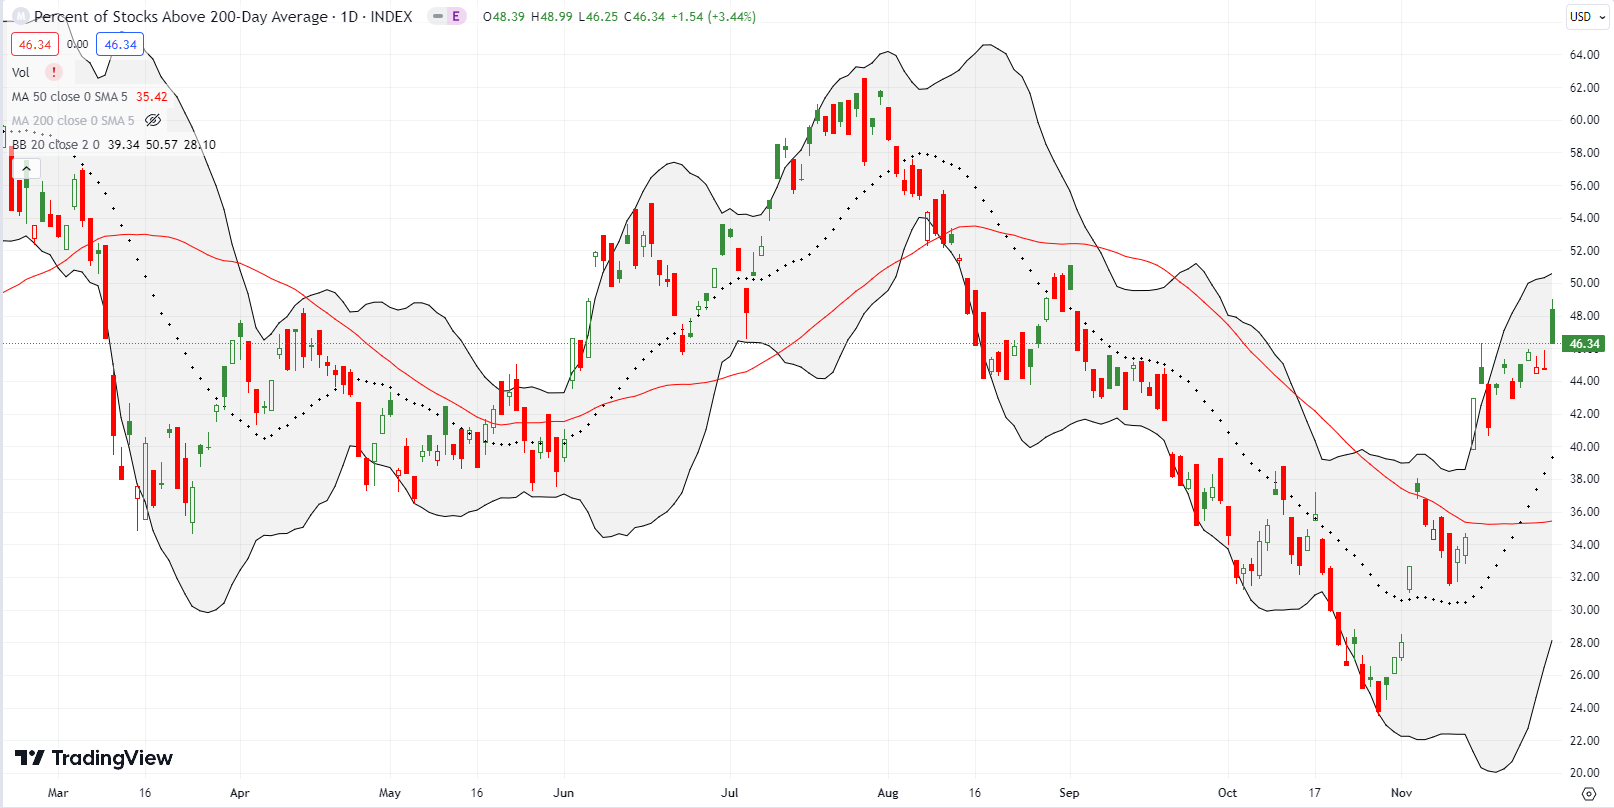
- AT200 (MMTH) = 46.3% of stocks are trading above their respective 200-day moving averages
- Short-term Trading Call: neutral
AT50 (MMFI), the percentage of stocks trading above their respective 50DMAs, traded as high as 70.2%, a perfect tap of the overbought threshold. However, my favorite technical indicator faded to a close at 66.3%. This first strike against the rally from oversold conditions sets up early bearish conditions per my AT50 trading rules. Accordingly, I downshifted my short-term trading call from cautiously bullish to neutral. A lower close for AT50 will flip me to cautiously bearish.
Note well that a bearish call at current levels will likely have a short window of opportunity. The major indices should find firm support at their 20DMAs. Even a breakdown from there should find even firmer support at uptrending 50DMAs (the red line). Accordingly, I may minimally act on a bearish call until/unless the major indices break down below their respective 50DMAs. Moreover, the CNN Fear and Greed Index has actually been declining and never reached extreme greed levels starting at 75 (63 now and peaked at 67 a week ago).
I am reluctantly stepping down from my bullish sentiment given the number of bullish looking charts still in my watchlists. While I am not inclined to jump on shorts or put options, I have tightened my leash on current bullish positions. Also, I will apply a higher bar of entry for any new bullish positions.
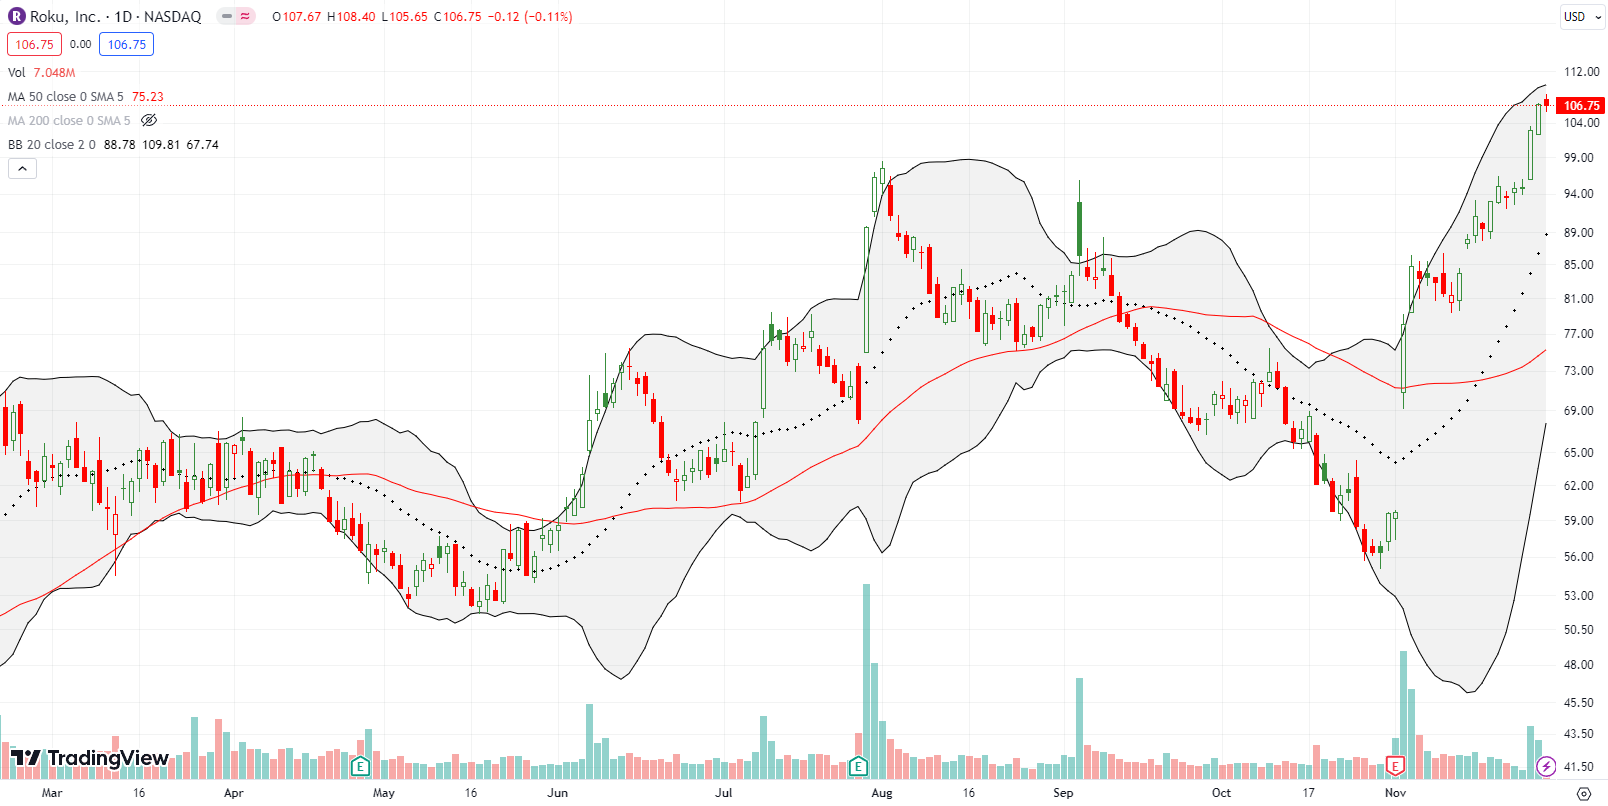
I pointed out the bullish case for Roku Inc (ROKU) in the last edition of the Market Breadth. If only I had noticed the bullish setup BEFORE the weekend! ROKU shot higher on Monday by 8.5%. The swift move forced me to chase the stock, so I went conservative with a calendar call spread at the $105 strike. ROKU shot right past my strike on Tuesday with a 3.8% gain. So now I am actually hoping ROKU drifts a little lower for the rest of the week! ROKU currently trades at an 18-month high although it is still almost 80% off its double top at all-time highs.
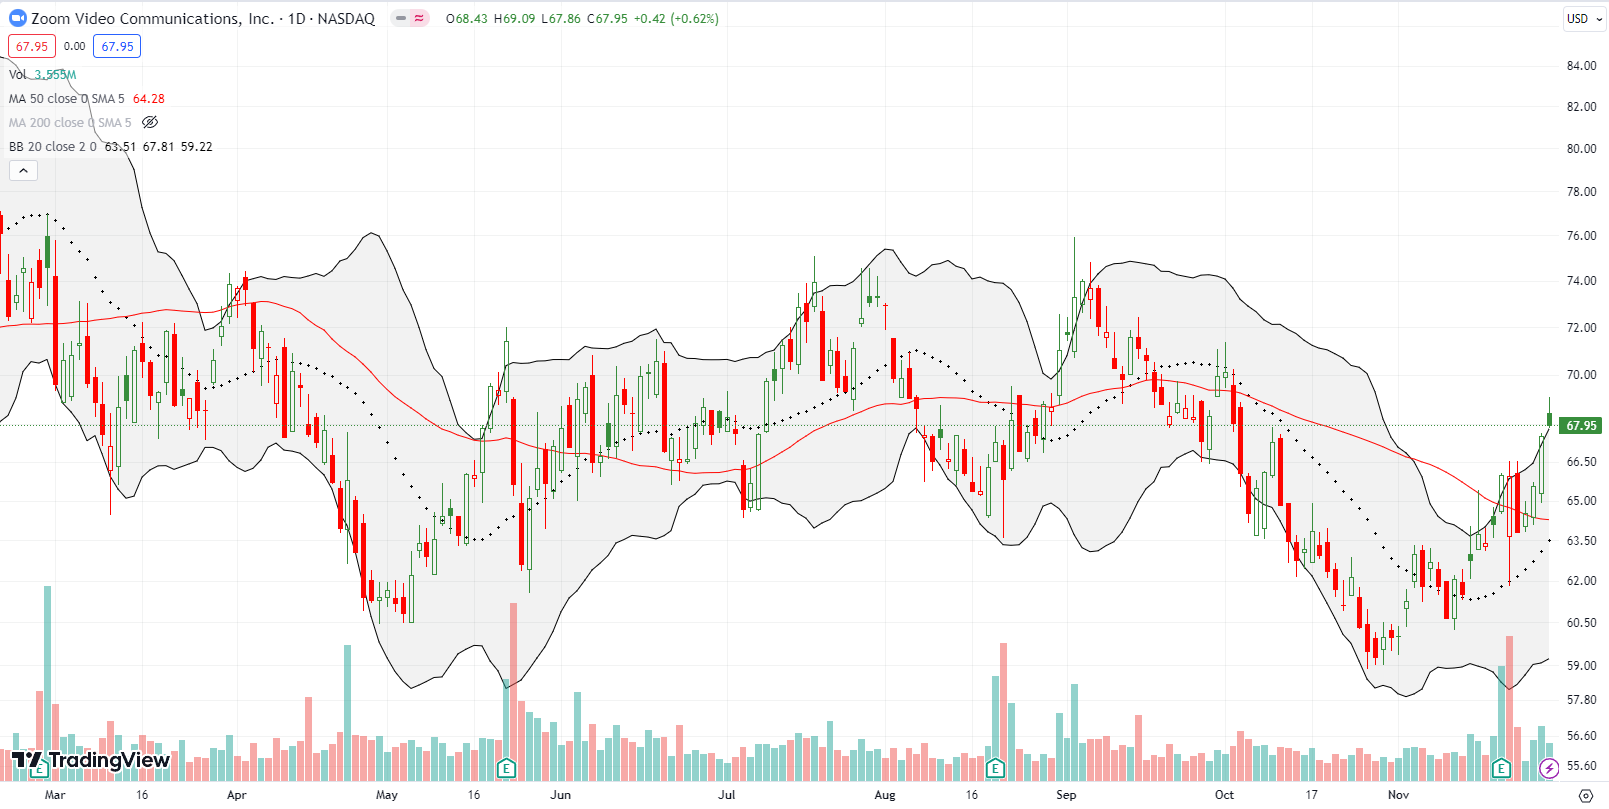
Even Zoom Video Communications, Inc (ZM) benefited from the week’s early surge. In this case, I was already prepared with the long side of a calendar call spread. I took profits on Wednesday’s gap up. ZM has once again confirmed a 50DMA breakout. I am still holding a longshot diagonal calendar call spread Dec $90 / Jan $80 that looked good back in September. I will take another shot on a dip.
Be careful out there!
Footnotes
Subscribe for free to get email notifications of future posts!
“Above the 50” (AT50) uses the percentage of stocks trading above their respective 50-day moving averages (DMAs) to measure breadth in the stock market. Breadth defines the distribution of participation in a rally or sell-off. As a result, AT50 identifies extremes in market sentiment that are likely to reverse. Above the 50 is my alternative name for “MMFI” which is a symbol TradingView.com and other chart vendors use for this breadth indicator. Learn more about AT50 on my Market Breadth Resource Page. AT200, or MMTH, measures the percentage of stocks trading above their respective 200DMAs.
Active AT50 (MMFI) periods: Day #16 over 20%, Day #14 over 30%, Day #12 over 40%, Day #11 over 50%, Day #8 over 60% (overperiod), Day #78 under 70% (underperiod)
Source for charts unless otherwise noted: TradingView.com
Full disclosure: long ZM call spread, long ROKU calendar call spread, long IWM calendar call spread
FOLLOW Dr. Duru’s commentary on financial markets via StockTwits, Twitter, and even Instagram!
*Charting notes: Stock prices are not adjusted for dividends. Candlestick charts use hollow bodies: open candles indicate a close higher than the open, filled candles indicate an open higher than the close.


