Stock Market Commentary
The stock market pushed into overbought conditions last week. After one follow-through day, small caps wilted and dragged down market breadth toward the overbought threshold. That key setback raises the stakes of the current earnings period. I will try to look through the likely “chop” in the trading action, to identify on-going pockets of buying strength and well-supported uptrends.
Steve Eisman (of Big Short fame) visited CNBC’s Fast Money on Thursday. He counted himself as one of the people surprised by the strength of the stock market. In particular, he underestimated how much money institutional investors apparently had on the sidelines coming into 2023. (This observation reminded me of Tom Lee’s early 2023 claim that retail investors would stuff $1.8 trillion of cash into the stock market starting this year.) Now, Eisman thinks the stock market will keep “chugging along” as long as the economic data stay “fine.” Similar to Raymond James’ recognition of the unexpected resilience in the home builders sector, Eisman’s acknowledgment stands out as particularly significant. This is particularly true during a period when too many remain engaged in an ongoing 12 to 18-month journey, expectantly waiting for a recession.
Perhaps the next recession is waiting to appear after nearly no one expects it…
The Stock Market Indices
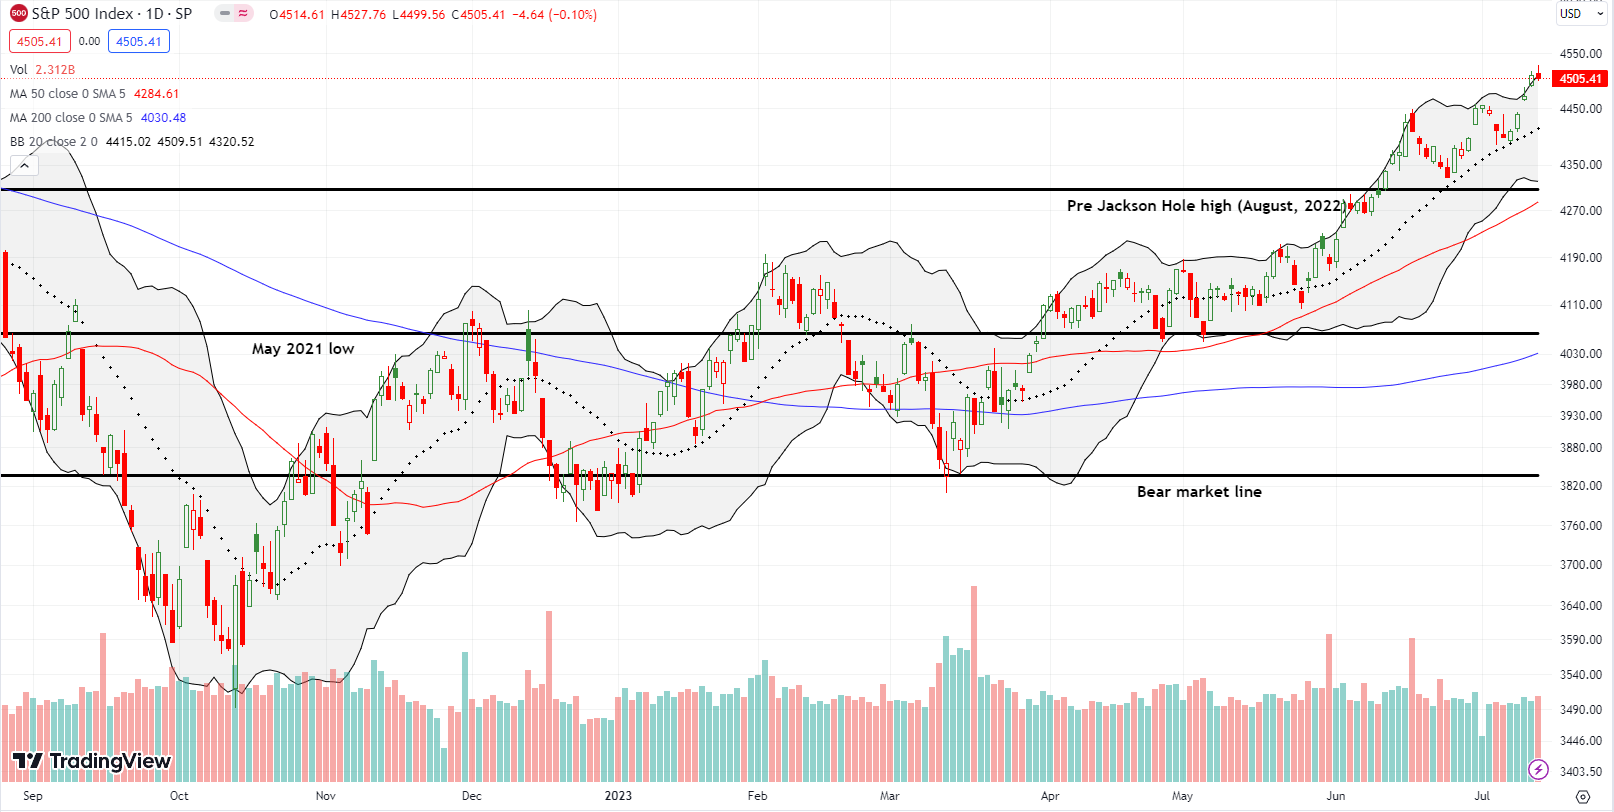
The S&P 500 (SPY) broke out on the day the stock market flipped overbought. The index touched its upper Bollinger Band (BB) that day and kept momentum going with two more days riding the upper BB momentum. Friday’s marginal setback was a fade from stretching well above the upper BB. The S&P 500 is still well-supported by its uptrending 20-day moving average (DMA) (the dotted line). The index will prove itself particularly strong if the next pullback finds support at the previous high and breakout point.
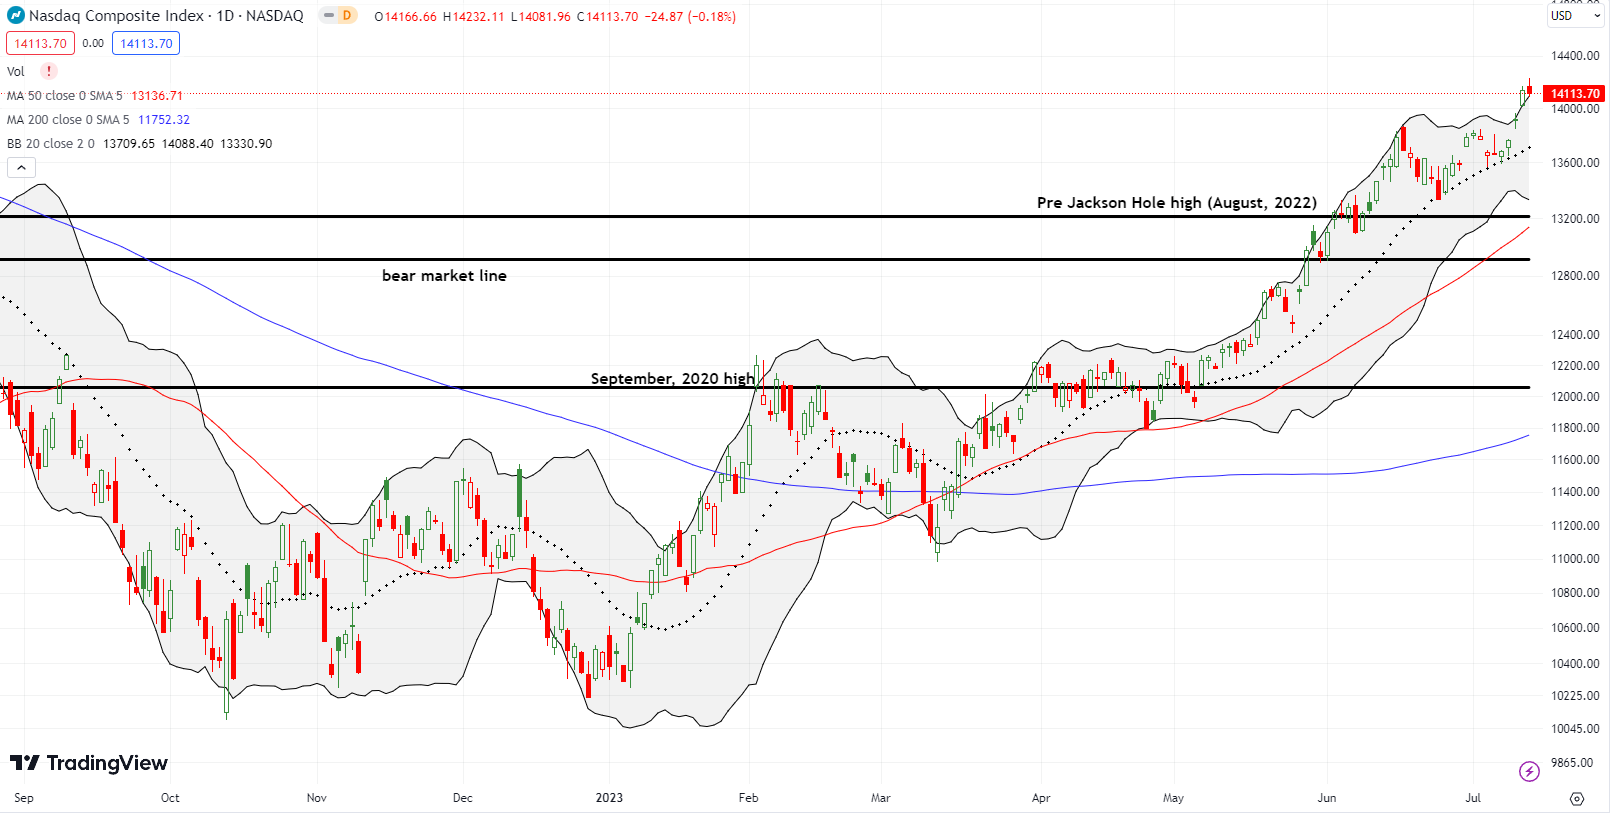
The NASDAQ (COMPQ) mimicked the behavior of the S&P 500 with the Wednesday breakout. The key difference is a marginal positive. The tech laden index managed to close just above its upper BB despite the fade from intraday highs. Just like the S&P 500, a continued setback should greet a well-supported 20DMA.
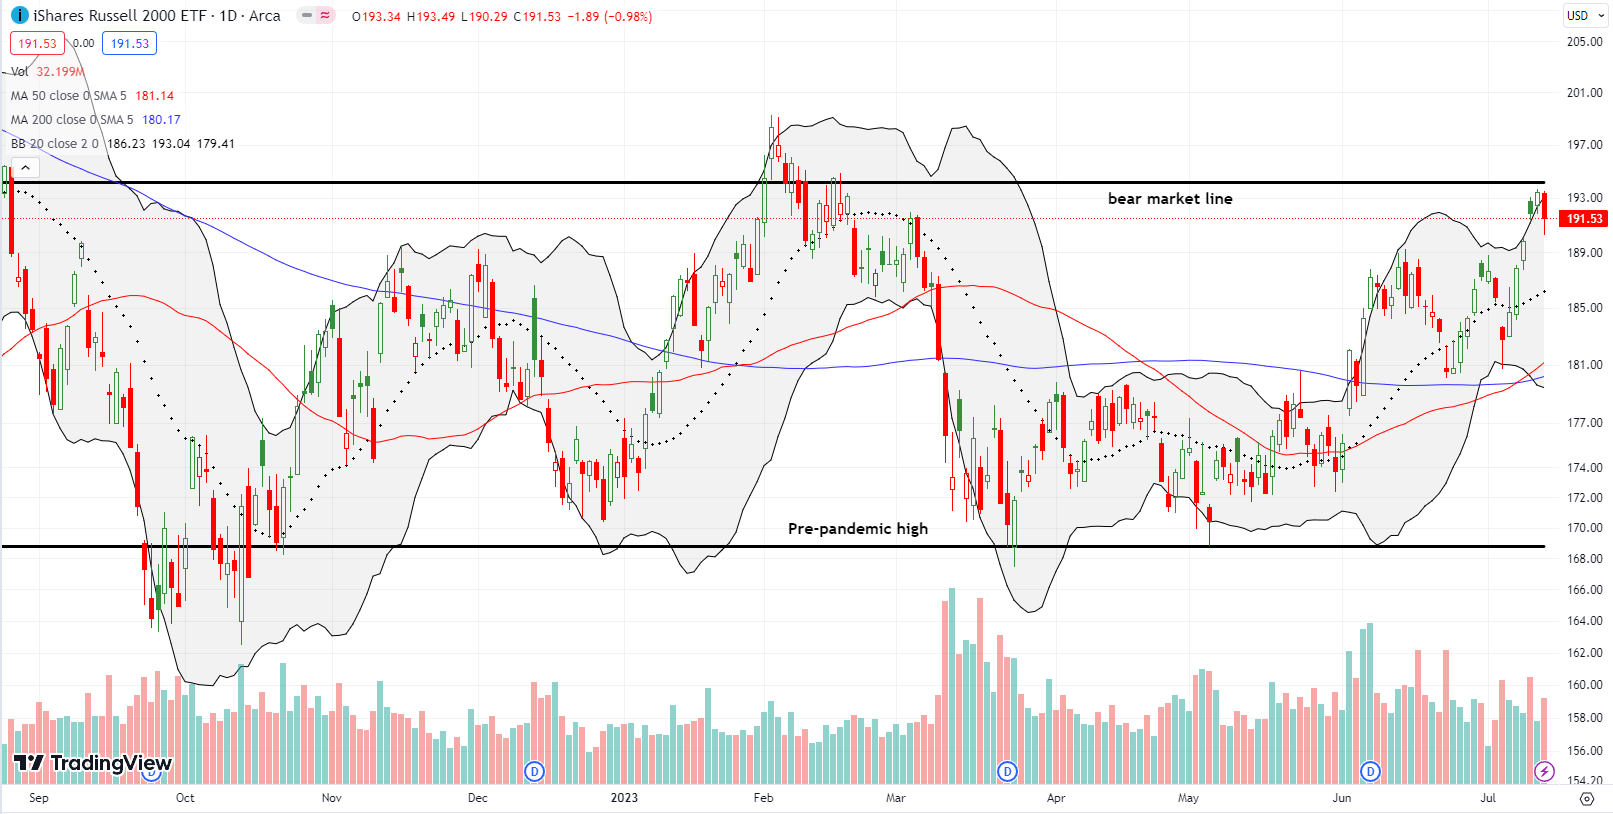
The iShares Russell 2000 ETF (IWM) consistently outpaced the major indices during its rebound until the ETF of small-caps experienced a 1.0% loss on Friday. This setback marked the key setback of the week, as the selling affirmed the ETF’s resistance at the bear market line, indicating a significant threshold for small-cap stocks. Without the involvement of these small-cap stocks, it seems unlikely for the market breadth to advance further into overbought territory. A breakthrough above the bear market line would signal a compelling resurgence for the bulls.
Note how IWM finally reversed its entire loss from March when the collapse in regional banks weighed heavily.
The Short-Term Trading Call with A Key Setback
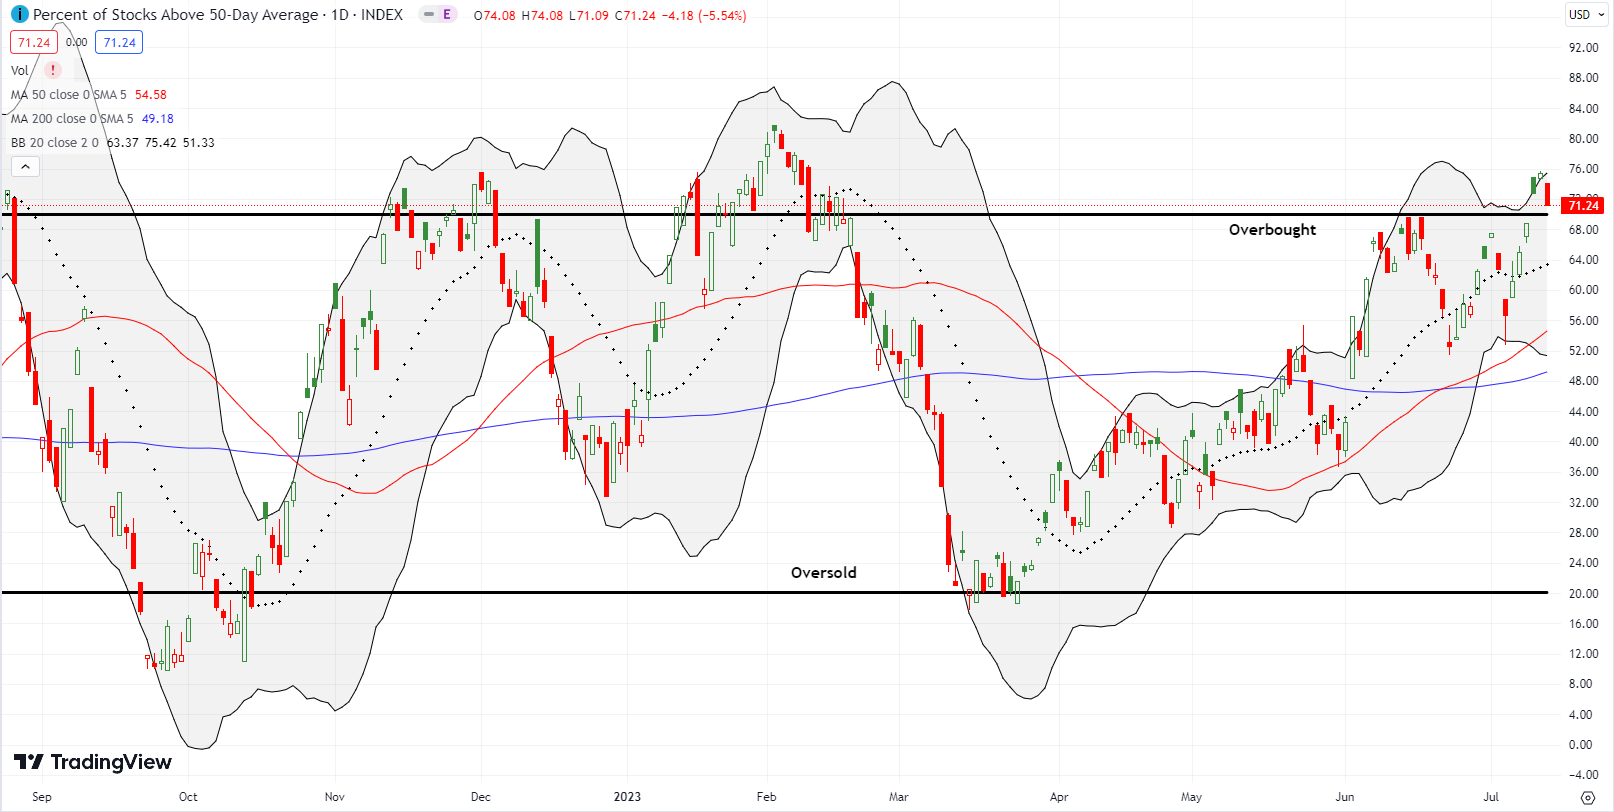
- AT50 (MMFI) = 71.2% of stocks are trading above their respective 50-day moving averages (day #3 overbought)
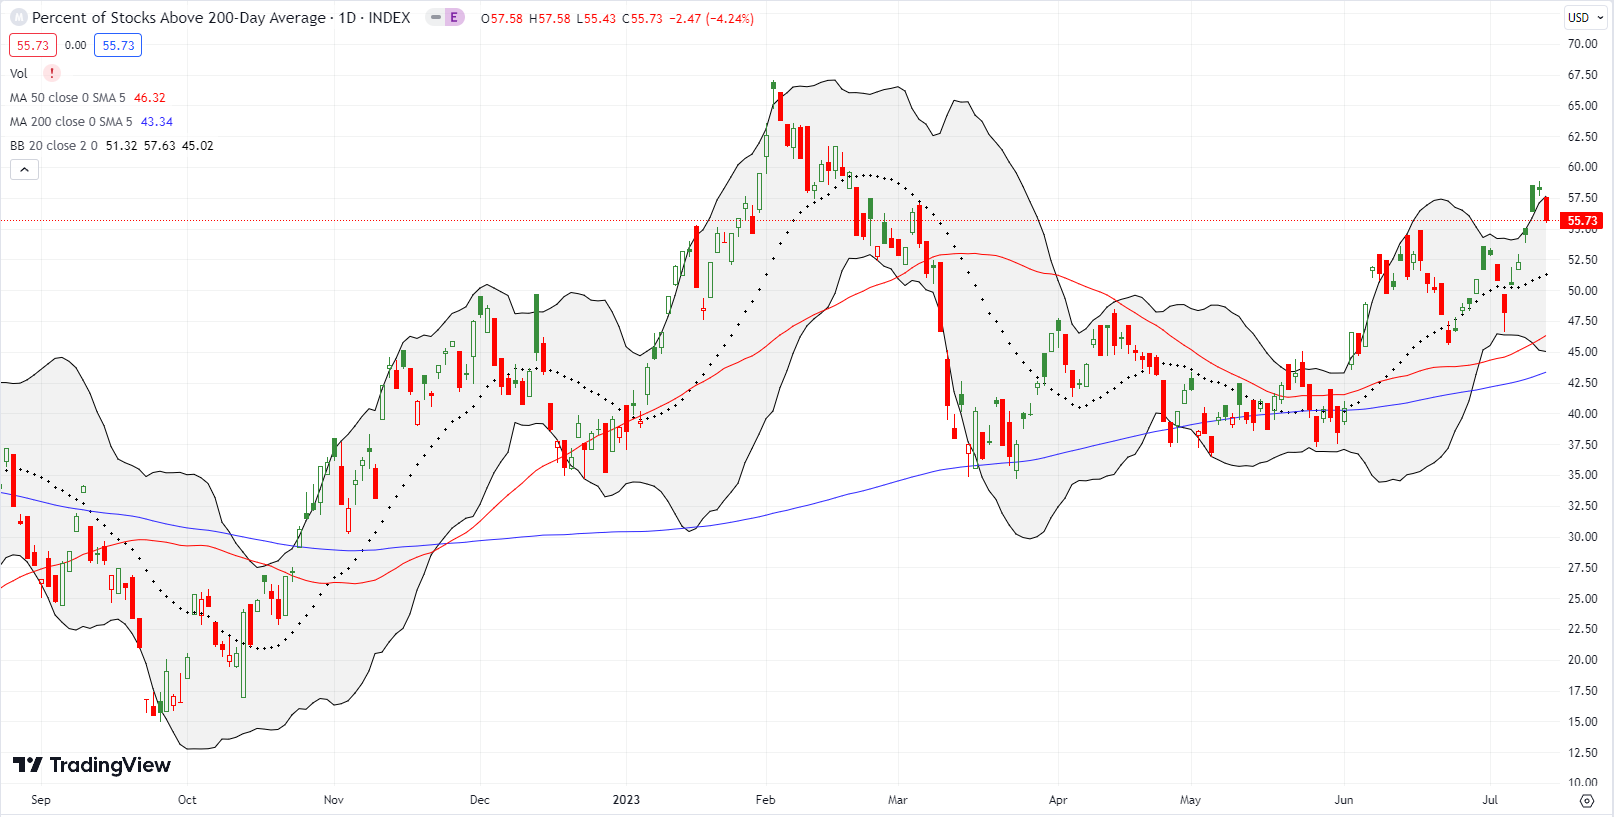
- AT200 (MMTH) = 55.7% of stocks are trading above their respective 200-day moving averages
- Short-term Trading Call: cautiously bullish
AT50 (MMFI), the percentage of stocks trading above their respective 50DMAs, dropped to 71.2% on its third day of overbought trading. My favorite technical indicator’s close cousin AT200 (MMTH), the percentage of stocks trading above their respective 200DMAs, also fell back and almost reversed its breakout from Wednesday. Thus, the fresh bullishness from the overbought trading conditions is already staring down a key setback. While a fall from overbought conditions would trigger bearish implications, I will be slow to switch out of “cautiously bullish” given the on-going buying momentum and strength in the stock market.
I am clinging to expectations that the market will survive this key setback and other pullbacks until at least the Federal Reserve’s next press conference in a week and a half. While I am reluctant to hold most of my swing trades through their respective earnings, I am very interested in buying post-earnings sell-offs (depending on the news and the technicals of course). According to FactSet, the early results from S&P 500 earnings are promising relative to expectations. However, note how the market has soared despite the unfolding “earnings recession.”
“Overall, 6% of the companies in the S&P 500 have reported actual results for Q2 2023 to date. Of these companies, 80% have reported actual EPS above estimates, which is above the 5-year average of 77% and above the 10-year average of 73%. In aggregate, companies are reporting earnings that are 8.8% above estimates, which is above the 5-year average of 8.4% and above the 10-year average of 6.4%…
If -7.1% is the actual decline for the quarter, it will mark the largest earnings decline reported by the index since Q2 2020 (-31.6%). It will also mark the third straight quarter in which the index has reported a decrease in earnings.”
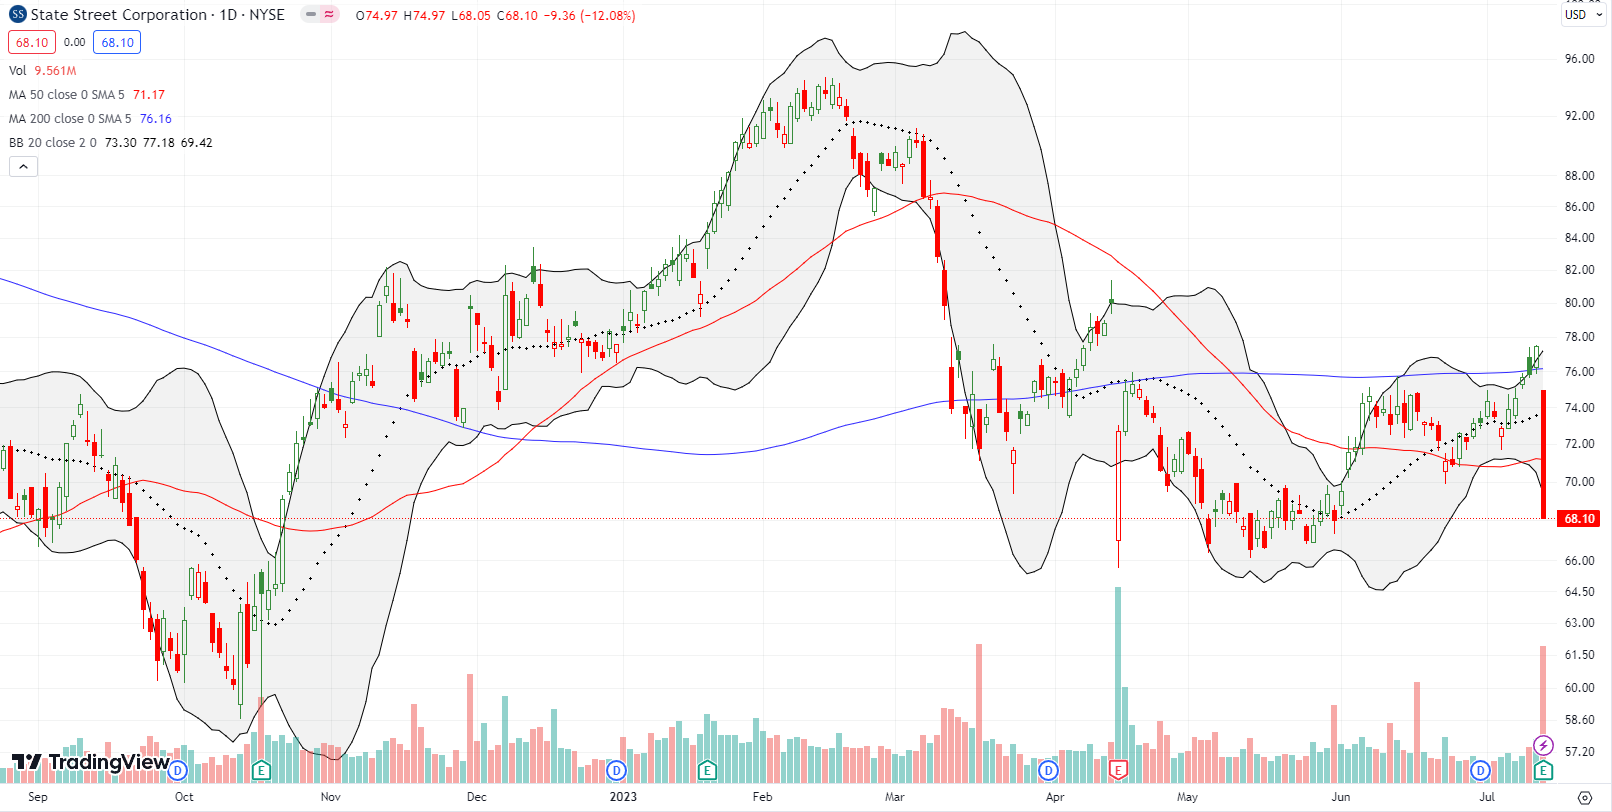
Earnings treated financial institution State Street Corporation (STT) poorly. The stock was in the middle of a 200DMA (the blue line below) breakout ahead of earnings. STT plunged 12.1% after earnings. The company will press on with stock repurchases, so this setback could be short-lived.
Those interested should keep an eye on the last lows. In the meantime, STT looks like it will stay stuck in a wide trading range. The top of the range sits at the close before the April post-earnings tumble. The bottom of the range rests at the May lows. The October lows form a “worst case” scenario.
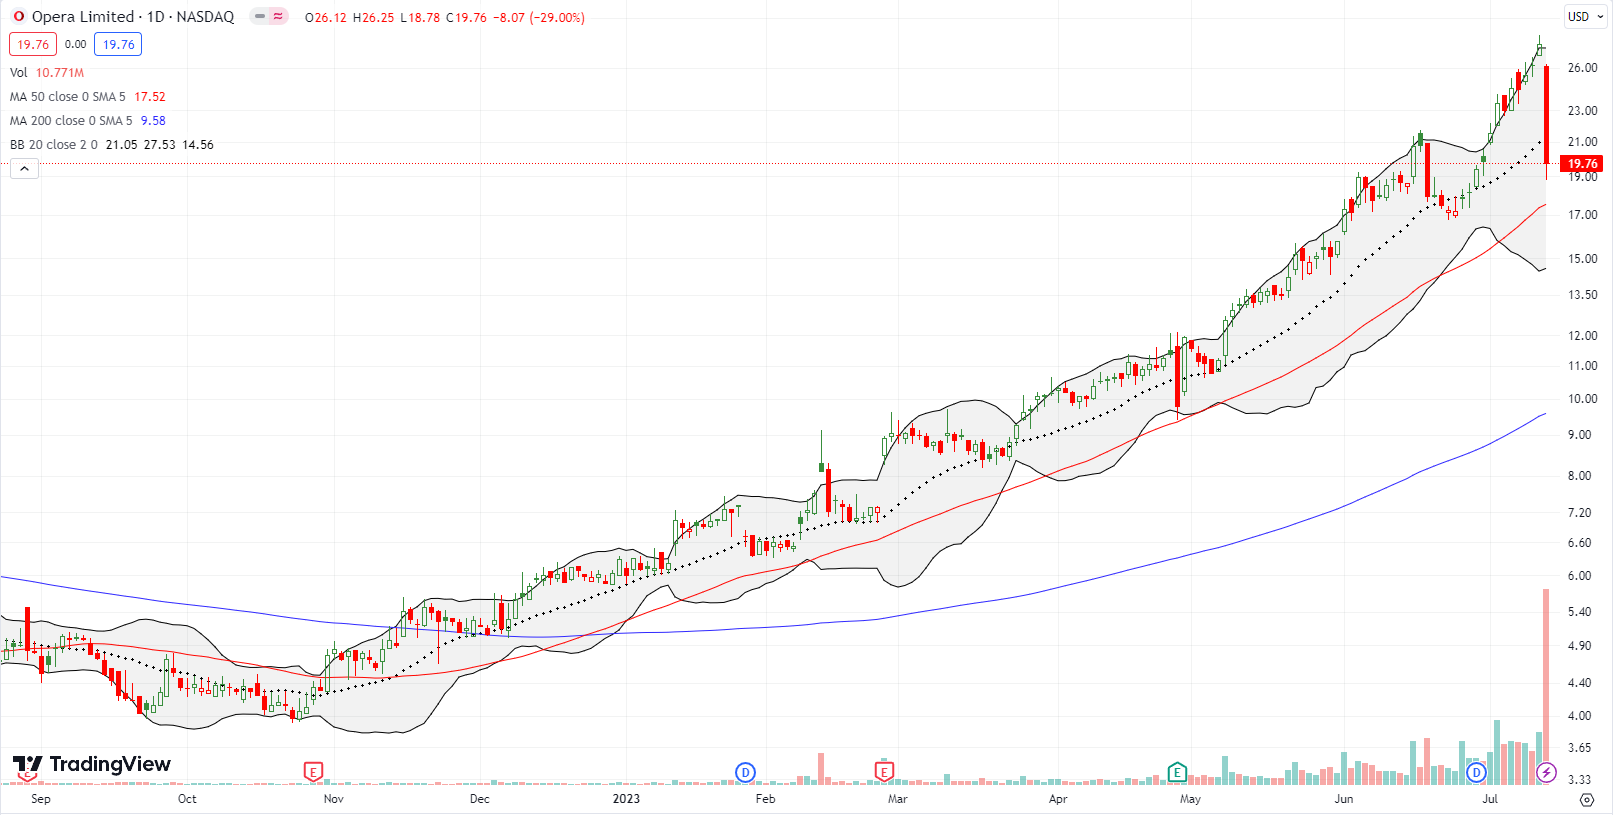
Opera Limited (OPRA) is the Norwegian developer of mobile and PC web browsers and content discovery. The stock has had quite a run from the November lows. OPRA debuted 5 years ago and failed to go materially higher until the breakout to an all-time (price, not closing) high on June 1st of this year. Friday’s 29% loss almost reversed all the gains from that breakout.
The sudden and abrupt setback followed the announcement of a filing authorizing the sale of “up to 141,773,298 ordinary shares or equivalent ADSs offered by the selling securityholders.” This sale is an astonishing amount of shares given the current 90M in outstanding shares. Clearly the lofty stock price was just too much for insiders to resist. This episode is a stark reminder of the dual opportunities and dangers in momentum.
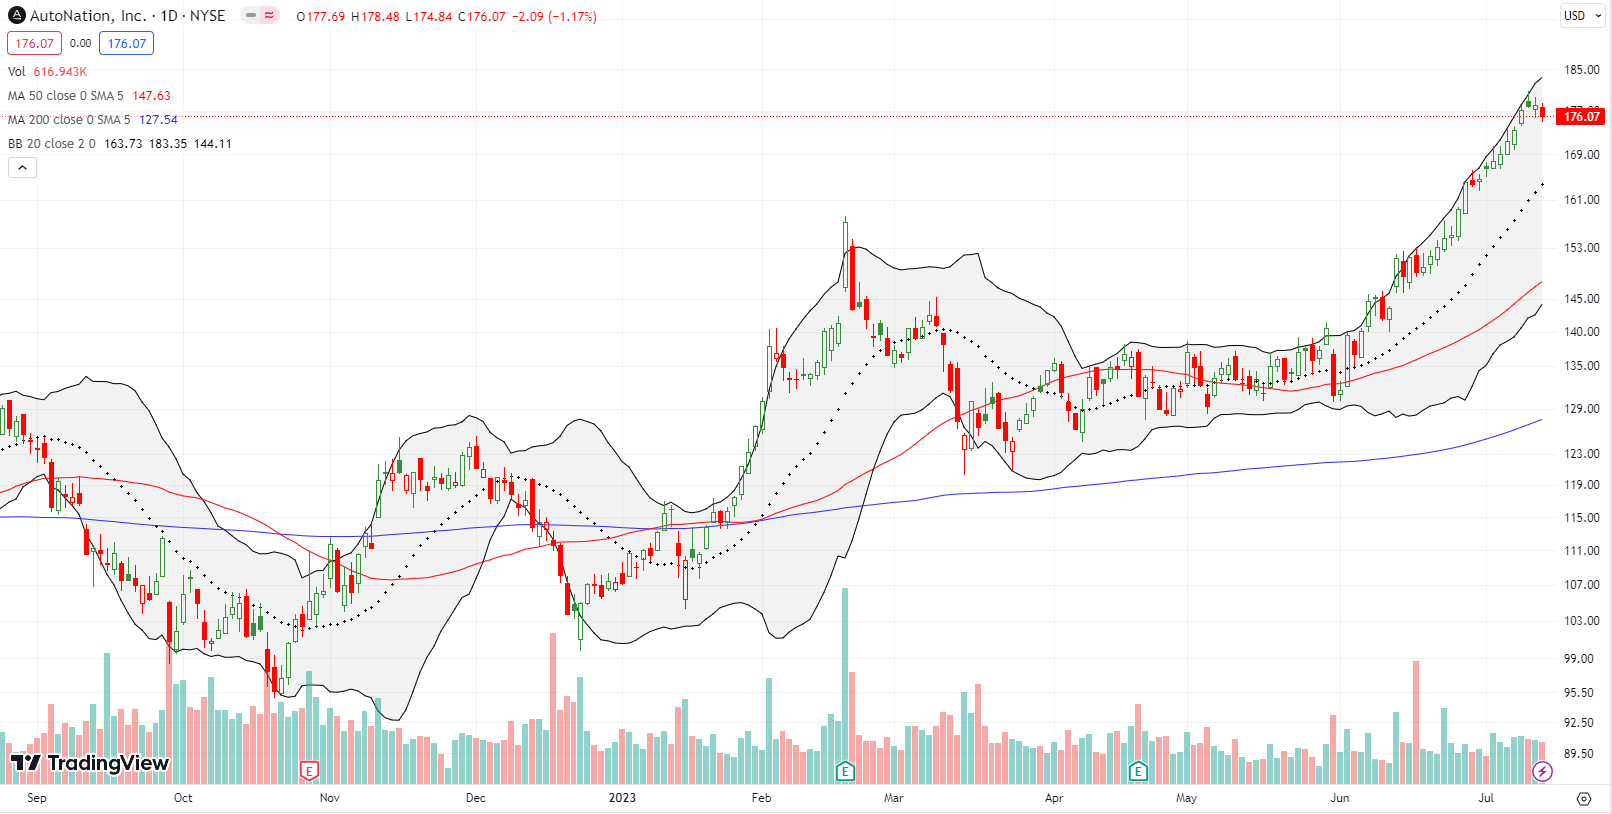
Used car dealer AutoNation, Inc (AN) continues to streak higher nearly unabated. The minor 1.2% setback on Friday was of course no “OPRA” moment, yet it could signal the start of a pause and much needed rest for the stock. If so, I would look for a pullback to the 20DMA for a buying opportunity. The strength in the stocks of used car companies is another of the many surprises in the market right now. (I am still holding my position in CarGurus (CARG)).
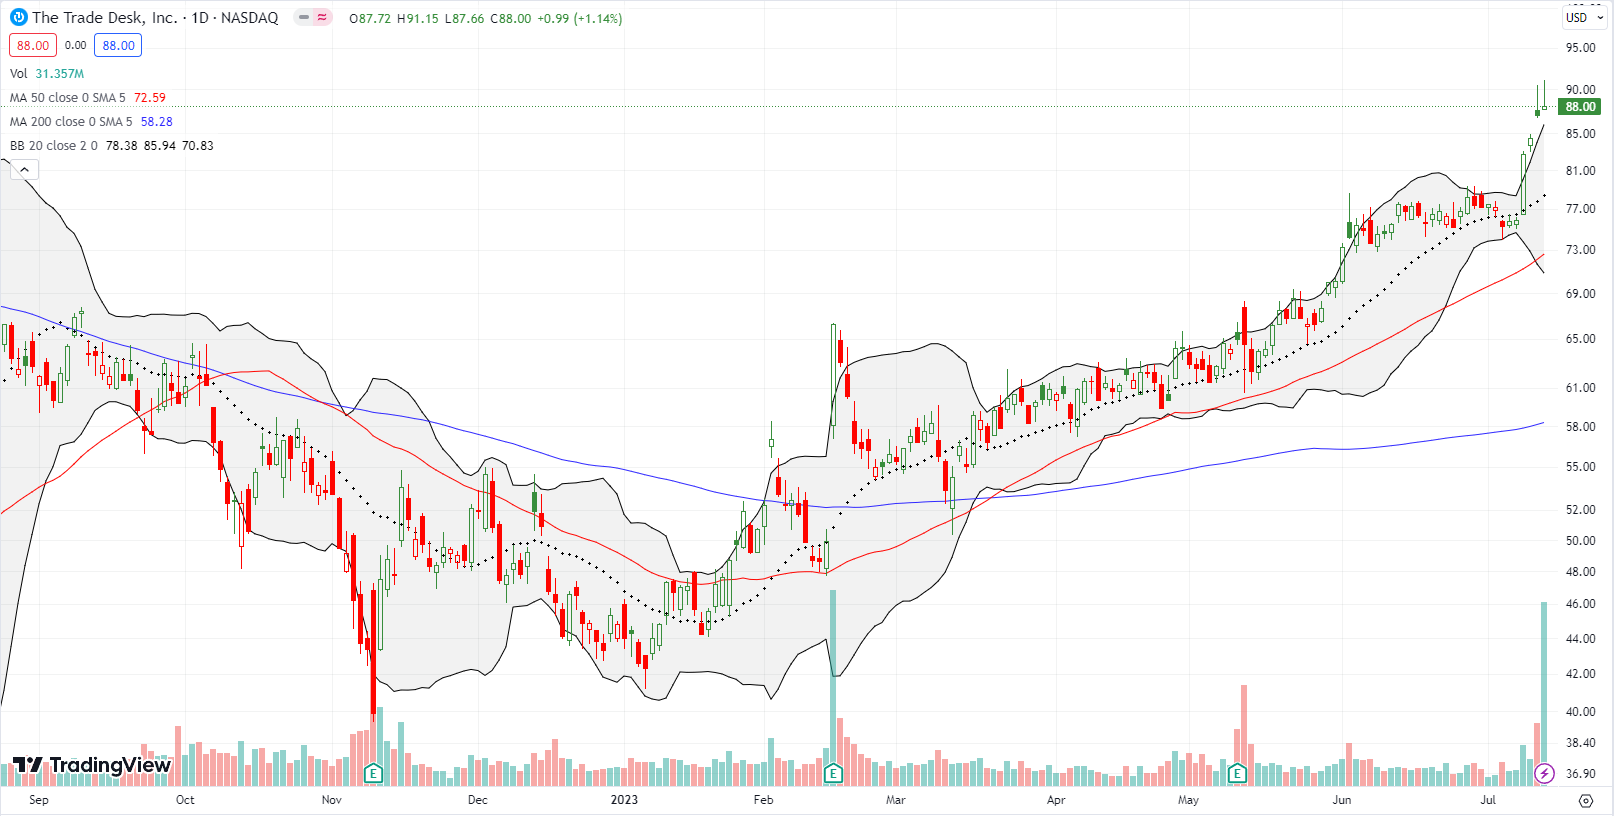
The breakout moment for digital advertising platform The Trade Desk (TTD) occurred the day before the stock market went overbought. TTD has closed above its upper BB for four straight days. However, the last two days also featured sharp fades from intraday highs. This is a topping pattern that suggests buyers are exhausted. TTD is actually a short on a close below the lows of this topping pattern. Yet, I doubt I will take the bait since I am focused on bullish opportunities for now.
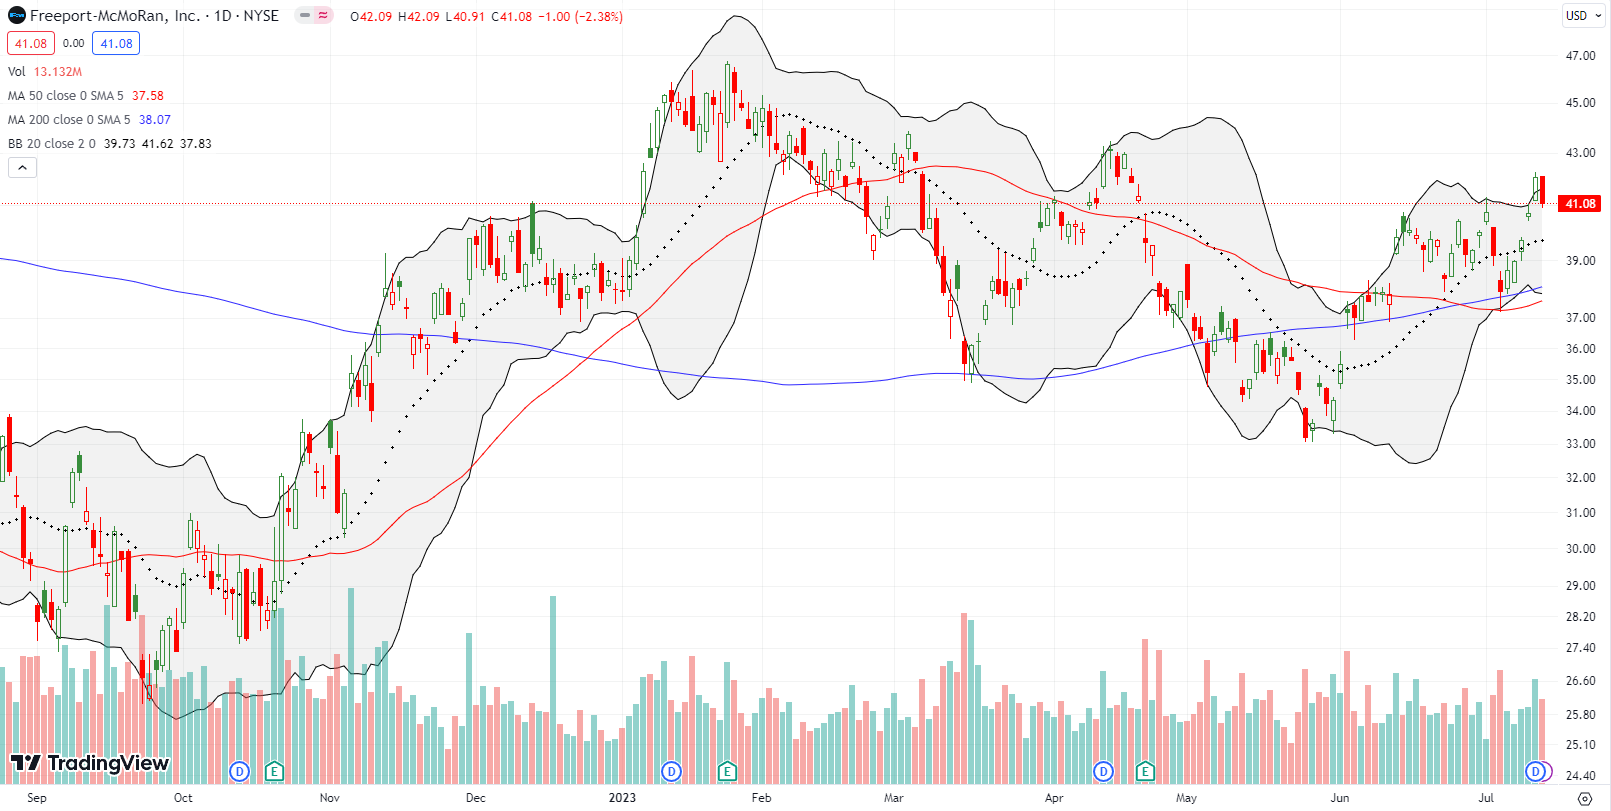
Commodities are delivering mixed signals as prices churn up and down. Copper miner Freeport-McMoRan, Inc (FCX) looks like it wants to strike a decisive blow for higher prices. The previous consolidation period over the past month successfully tested 50DMA support twice after confirming the breakout at the start of the period. (I flipped a swing trade off the first test.) FCX broke out with a 3.3% gain on Thursday but the 2.4% setback on Friday reversed almost all those gains. A move higher from here would confirm the breakout and set up important tests of resistance from the previous two peaks.
Be careful out there!
Footnotes
Subscribe for free to get email notifications of future posts!
“Above the 50” (AT50) uses the percentage of stocks trading above their respective 50-day moving averages (DMAs) to measure breadth in the stock market. Breadth defines the distribution of participation in a rally or sell-off. As a result, AT50 identifies extremes in market sentiment that are likely to reverse. Above the 50 is my alternative name for “MMFI” which is a symbol TradingView.com and other chart vendors use for this breadth indicator. Learn more about AT50 on my Market Breadth Resource Page. AT200, or MMTH, measures the percentage of stocks trading above their respective 200DMAs.
Active AT50 (MMFI) periods: Day #74 over 20%, Day #48 over 30%, Day #45 over 40%, Day #31 over 50%, Day #6 over 60%, Day #3 over 70% (overbought)
Source for charts unless otherwise noted: TradingView.com
Full disclosure: long CARG
FOLLOW Dr. Duru’s commentary on financial markets via StockTwits, Twitter, and even Instagram!
*Charting notes: Stock prices are not adjusted for dividends. Candlestick charts use hollow bodies: open candles indicate a close higher than the open, filled candles indicate an open higher than the close.


Another great analysis . I bought a call option on CARG and still
Holding till results .
What’s your long term view on TTD. Will it be able to take a revenue share from other big advertising companies ?
“Of these companies, 80% have reported actual EPS above estimates, which is above the 5-year average of 77% and above the 10-year average of 73%.”
Base effects! The last 3 years have been uniquely aberrant, comparing against averages that include them is probably not a good idea.
Opera: capital raises of that magnitude need to have a purpose other than “get out while the gettin’ is good”, such as supporting an order-of-magnitude scaling-up of the company’s addressable market. Hard to imagine such a thing given they already claim nearly 400 million users.
It’s a bizarre event. OPRA came out with a “clarification” to say that they are really just renewing a previous authorization to dump these shares. Still smells fishy to me!
While base effects definitely apply here, the 10-year average pretty much makes those base effects irrelevant. 80% is pretty high any way you look at it.
Good job on CARG! Make sure you keep an eye on that time decay though.
TTD: great recovery today. Since a lot of advertisers are suddenly in recovery mode, I think the more important question is whether the ad market really is in recovery now. It’s hard to imagine that it is. I can’t wait to hear what the big companies say first (FB and GOOG for example).
Following up on CARG. I hope you saw the tea leaves in the technicals to exit the trade ahead of earnings. I wrote in an earlier post that I took profits as I derisked my holdings.