Uptrend in ITB: An Observation of 20-Day and 50-Day Moving Averages
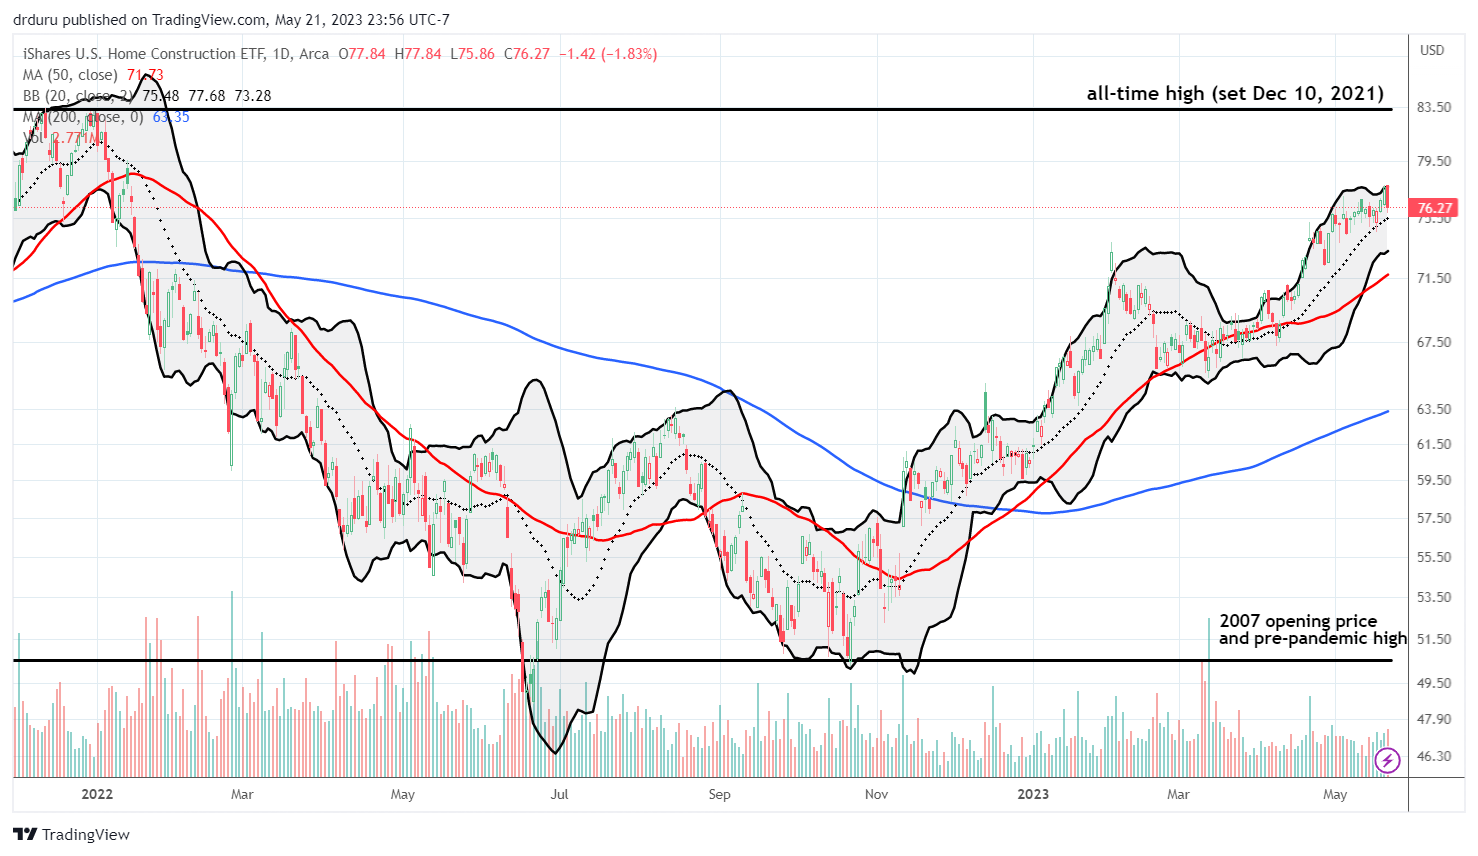
The calendar for the seasonal trade in home builders has come to an end. Yet, the iShares U.S. Home Construction ETF (ITB) looks as strong as ever. The uptrend in ITB is well-defined by a primary uptrend in the 20-day moving average (DMA) (the dotted line) and a secondary uptrend in the 50DMA (the red line below). This uptrend includes a bullish breakout above the February parabolic high. Although technical resistance from the all-time high is still a 10% rally away, this uptrend’s open defiance of the looming prospects for a general economic recession must make bears itch to short. So I took an instant interest in the bearish case recently broadcast by the guests on CNBC’s Options Action.

The Bearish Case: Assessing the Trade from CNBC’s Options Action
Michael Khouw laid out the bearish fundamental case. Khouw basically concluded that affordability issues will cap the upside to home builders despite the country’s chronic inventory shortage. He proposed buying a July 75/68 spread. The two months to expiration gives enough time for the trade to work if the seasonal trade is indeed over, AND the prospects for a recession get strong enough to put buyers into retreat.
Cater Braxton Worth laid out the technical case for a short. However, the chart he used was NOT from ITB. It was called “Construction ETF (ITB)” but it looked nothing like ITB. The chart does indeed look toppy and shortable, but I am mystified on its use as a proxy for ITB. Putting that potential mix-up aside, the technical case for shorting the above chart of ITB is weak without more signals.
Deciphering the Technical Case for a Short: A Study of the ITB Chart
An old trading adage cautions against “catching the falling knife.” It is very difficult to pick a bottom in a downtrend. I created a corollary to this adage: “Do Not Argue With Sellers – Celebrate With Buyers” which describes conditions for buying into a downtrend, like a convincing bounce from a solid line of support. All these principles apply to bears trying to pick a top in an uptrend. For example, sellers should avoid trying to push against a rocket. It is very difficult to pick a top in an uptrend. In the case of ITB, a bear should wait for at least one of the following conditions in descending order of price:
- A failed test of resistance at the all-time high.
- A confirmed breakdown below the 20DMA (a close below 20DMA support soon followed by a lower close).
- A close below the breakout point represented by the February high.
- A confirmed breakdown below the 50DMA.
- A confirmed breakdown below solid support around $65 created by the February to March consolidation.
A technician can justify going short in any of these cases. The lower the trigger, the more conservative the trade and the less the potential profit. A breakdown below $65 would effectively bring an end to ITB’s uptrend.
The Perma Bull Epilogue
Since I am a “perma bull” on housing and on home builder stocks, I do not look for shorting opportunities. Instead, I investigate sell-offs for buying opportunities, especially during the seasonally strong period for these stocks. With the season coming to an end, I am likely on pause until October or so….unless some particularly steep sell-off unfolds. Or in the case of a home builder hitting all-time highs like Taylor Morrison Home Corporation (TMHC), I will happily accumulate on weakness ahead of October.
Be careful out there!
Full disclosure: long ITB

Just wondering do you ever take profits on ITB or HODL
If HODL means hold until I die, then definitely not. I might hold something over 1 or 2 seasonal cycles, but the vast majority of my investments/trades stick with the seasonal strategy.
This latest cycle might finally get me to hold through multiple cycles because builders will come out the other side even stronger than they were after the Great Financial Crisis. Moreover, the supply deficit could get even worse.