Stock Market Commentary:
A sobering thought: American capitalism has yet to figure out how to sustain a stable banking system. The U.S. created the Federal Reserve system in 1914 as a response to the lessons from the banking Panic of 1907 and yet bank runs, bank panics, and bank failures continue to headline market dynamics during down economic cycles. The “Panic of 2023” that is taking down regional banks will surely generate fresh soul searching and a new set of regulatory rules and agencies. In the meantime, the stock market is flirting with oversold trading conditions just in time for the March meeting of the Federal Reserve. Reassurances from across the Federal government are accompanying bank closures and rescues and setting up explosive trading potential. Under these conditions, the technicals become a key component of maintaining sanity…assuming that healing awaits us on the other side.
The Stock Market Indices
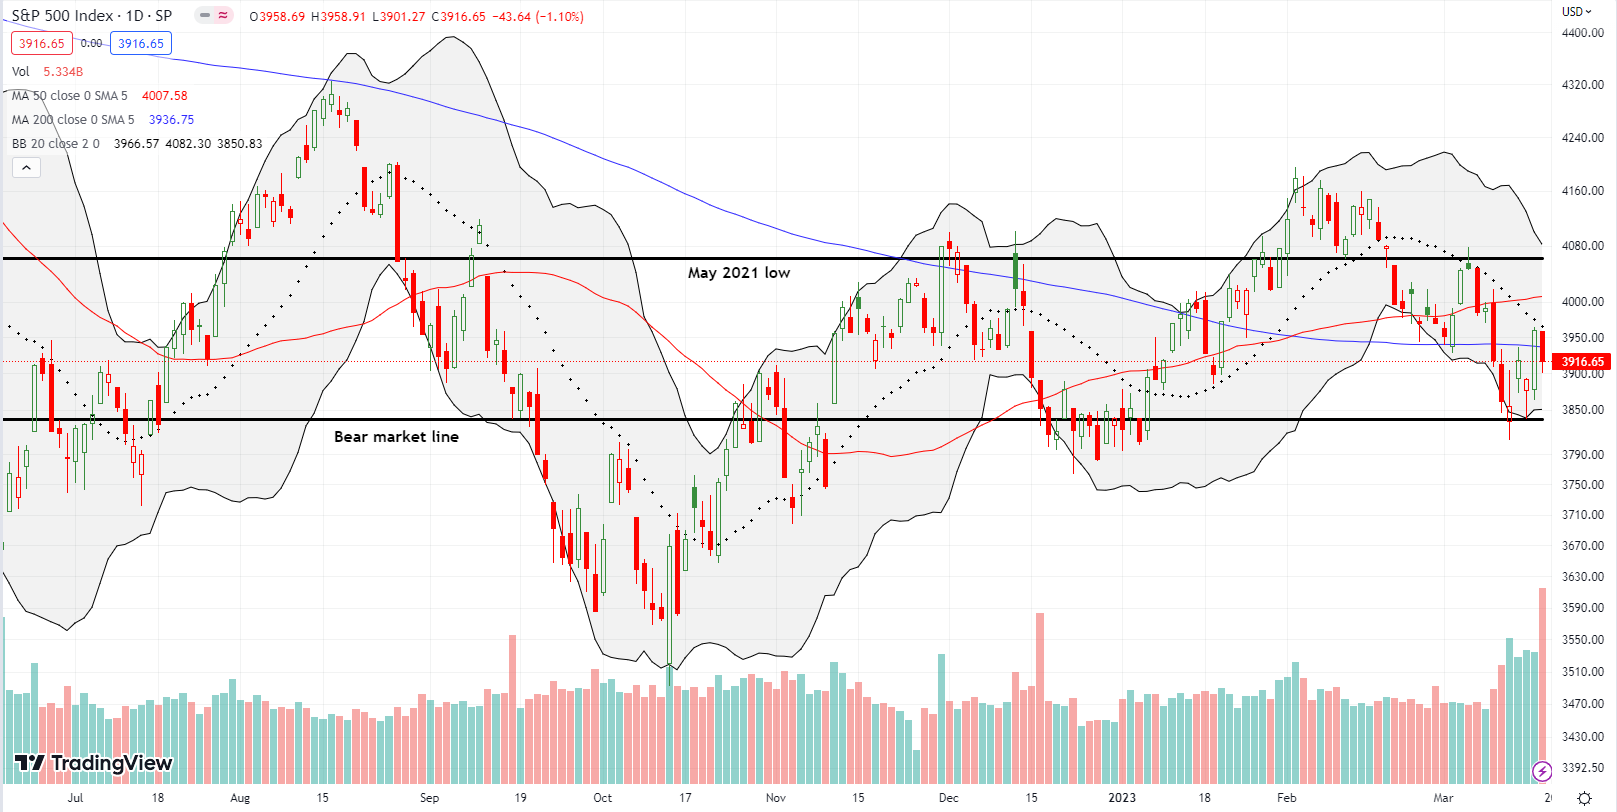
The S&P 500 (SPY) pushed through the headline risks with a hard-fought 1.4% gain for the week. The index tested its bear market line twice, surged through resistance at its 200-day moving average (DMA) (the bluish line), and melted at 20DMA resistance (the dotted line) for the 5th time this month. This cocktail of price action included flirting with oversold trading conditions. The S&P 500 is beset with a confluence of technical support and resistance coming ahead of another momentous decision on monetary policy from the Federal Reserve. Similar to an economy stuck between the inflation from a formerly over-stimulated pandemic economy and the looming deflation from a banking crisis, the S&P 500 is stuck flailing between and around its May, 2021 low and bear market line. In fact, the S&P 500 is trading right where it was two years ago!
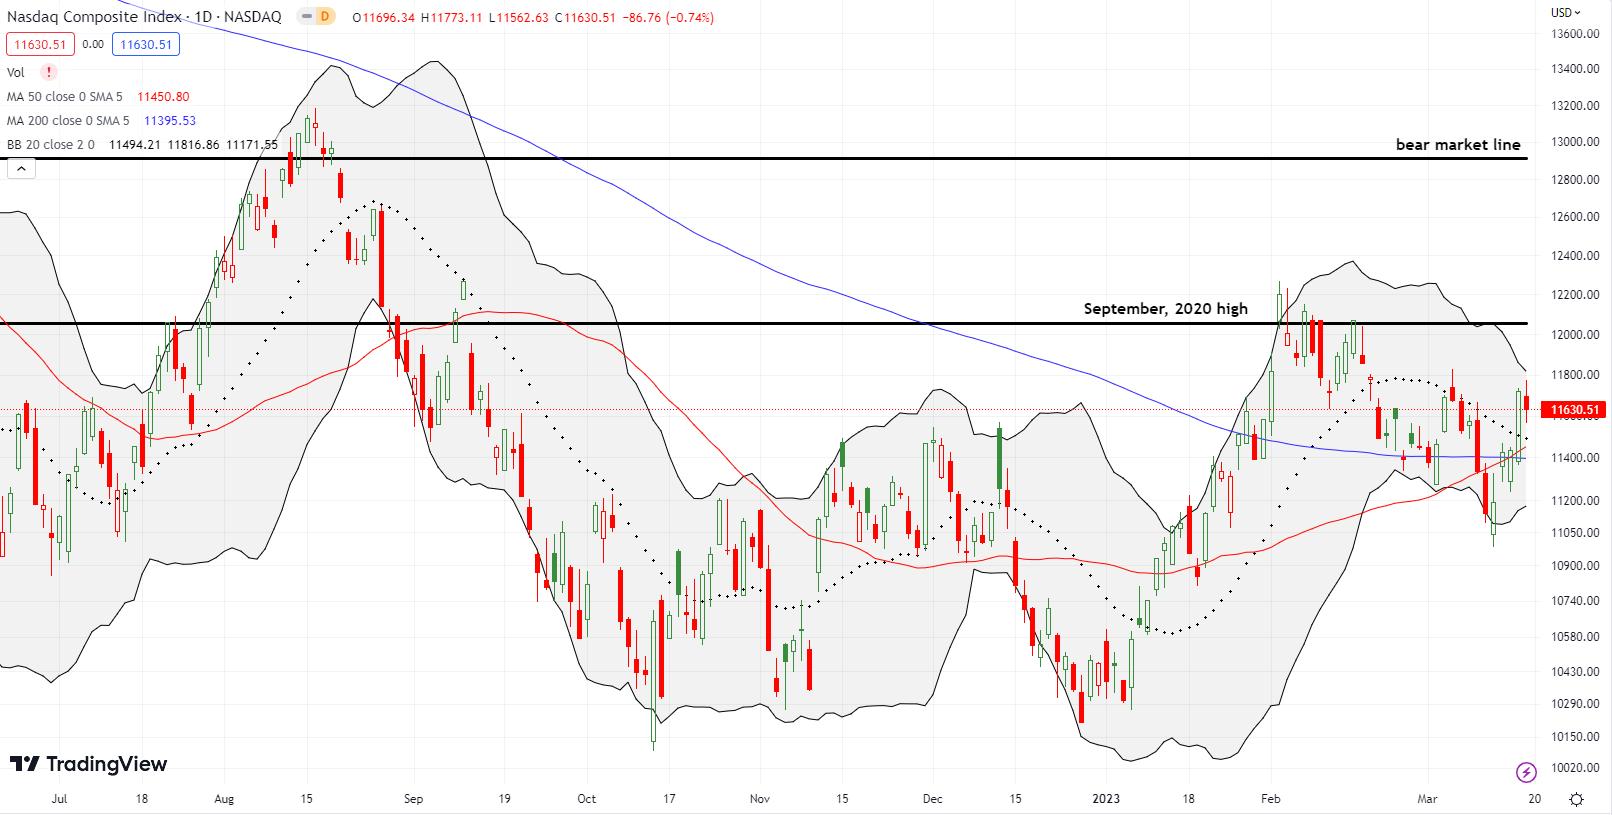
While the S&P 500’s gains were surprising, the gains for the NASDAQ (COMPQ) were outright astounding. An apparent flight to (perceived) safety delivered a 4.4% gain for the week for the tech laden index. Big cap tech led the way as the NASDAQ launched off converged 200DMA and 50DMA (red line) support and surged through 20DMA resistance. Buyers finally met their match at the March highs. Continued buying from here will stare down stiff resistance at the September, 2020 high. I am expecting a little more cautious trading going into the Fed meeting.
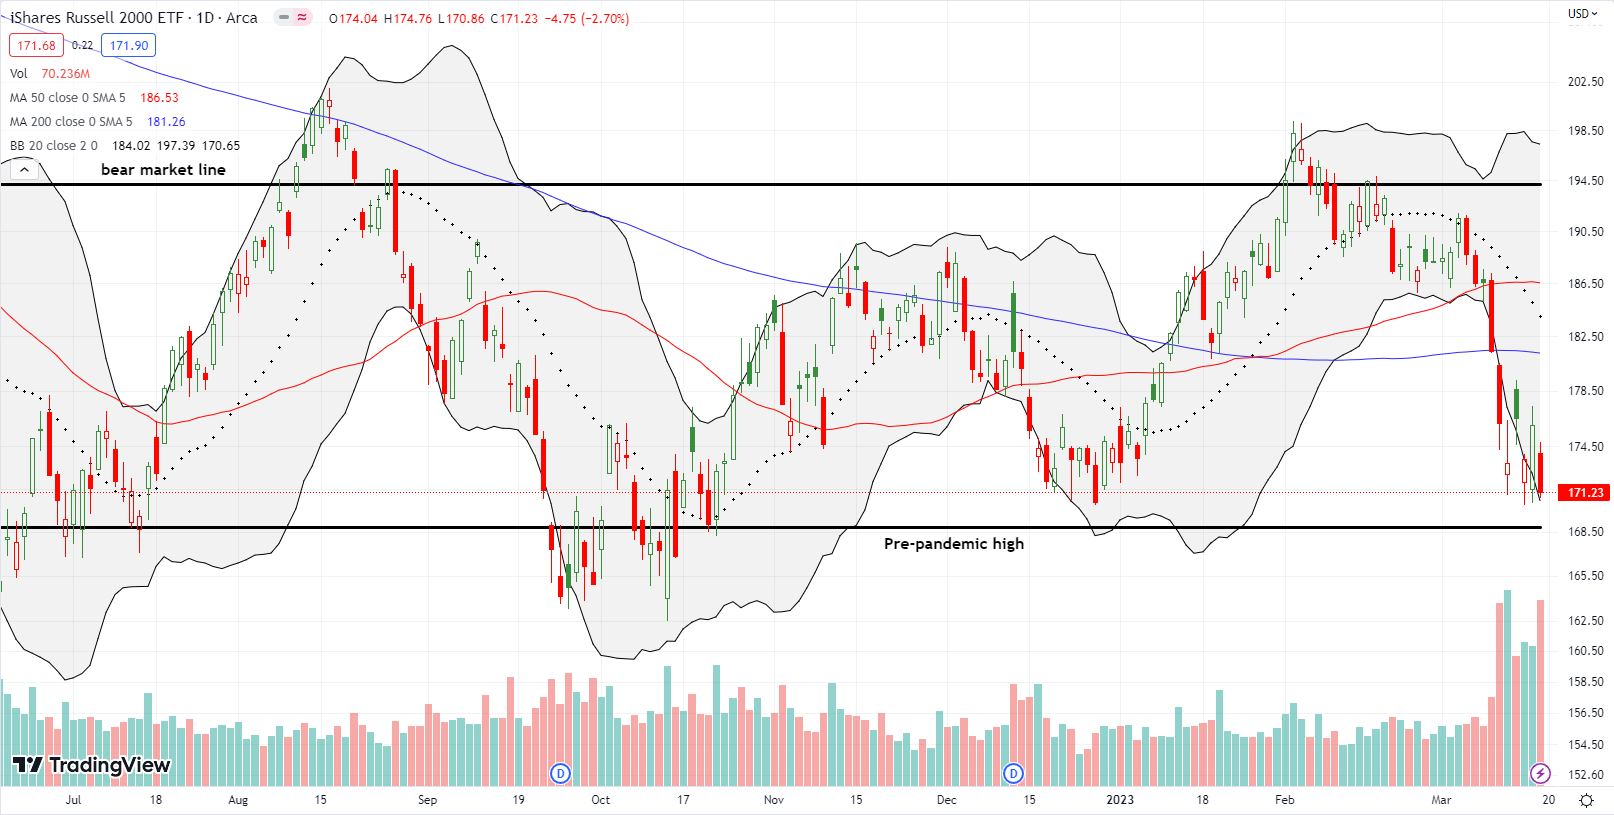
The iShares Russell 2000 ETF (IWM) did not participate in the contrary gains. The growing crisis across regional banks presumably represents a greater stressor for smaller businesses. The ETF of small cap stocks lost 2.8% for the week and closed at a 3-month low. The recent churn tested the December lows over and over. The creeping weakness makes IWM look poised to retest its pre-pandemic high as support. I am still holding an April call spread after taking profits on half of my IWM position. I will look again to trade IWM on the next set of buying conditions.
Stock Market Volatility
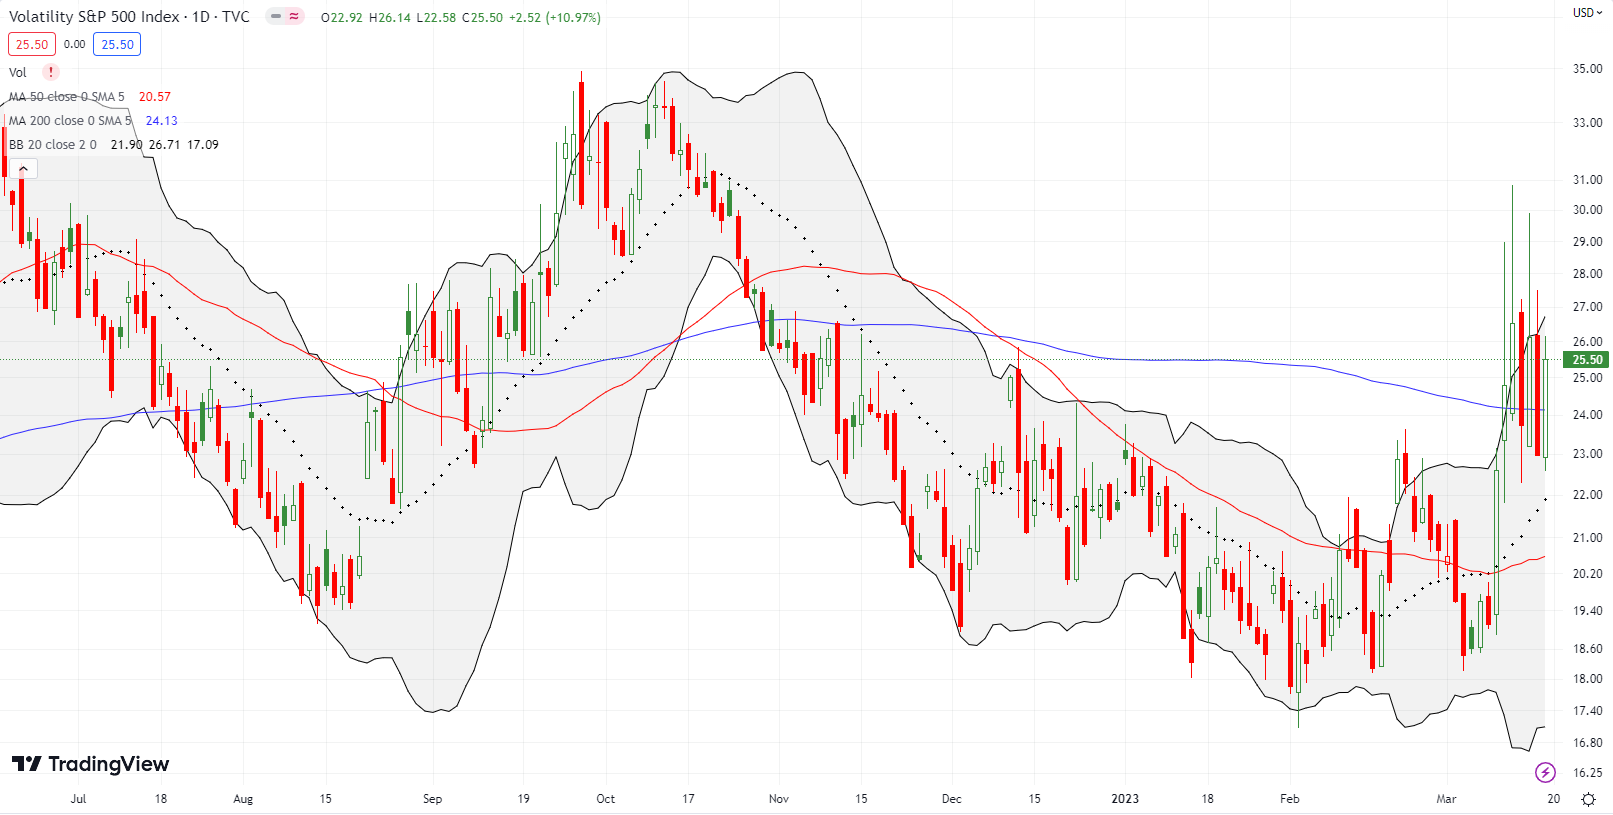
The volatility index gained 2.9% for the week while swinging between 22.3 and 30.8. Despite the net gain, fear is showing exhaustion as faders consistently pushed the VIX off intraday highs all week. Soon, it will take freshly bad news to convince fear and panic to push the VIX above 30. Until then, the VIX’s wild swings are setting up bullish short-term trading conditions. As a small hedge, I bought a May VXX 50/55 call spread when the VIX dropped on Thursday. I am looking to take profits on the next VIX push toward last week’s intraday highs.
The Short-Term Trading Call While Flirting with Oversold
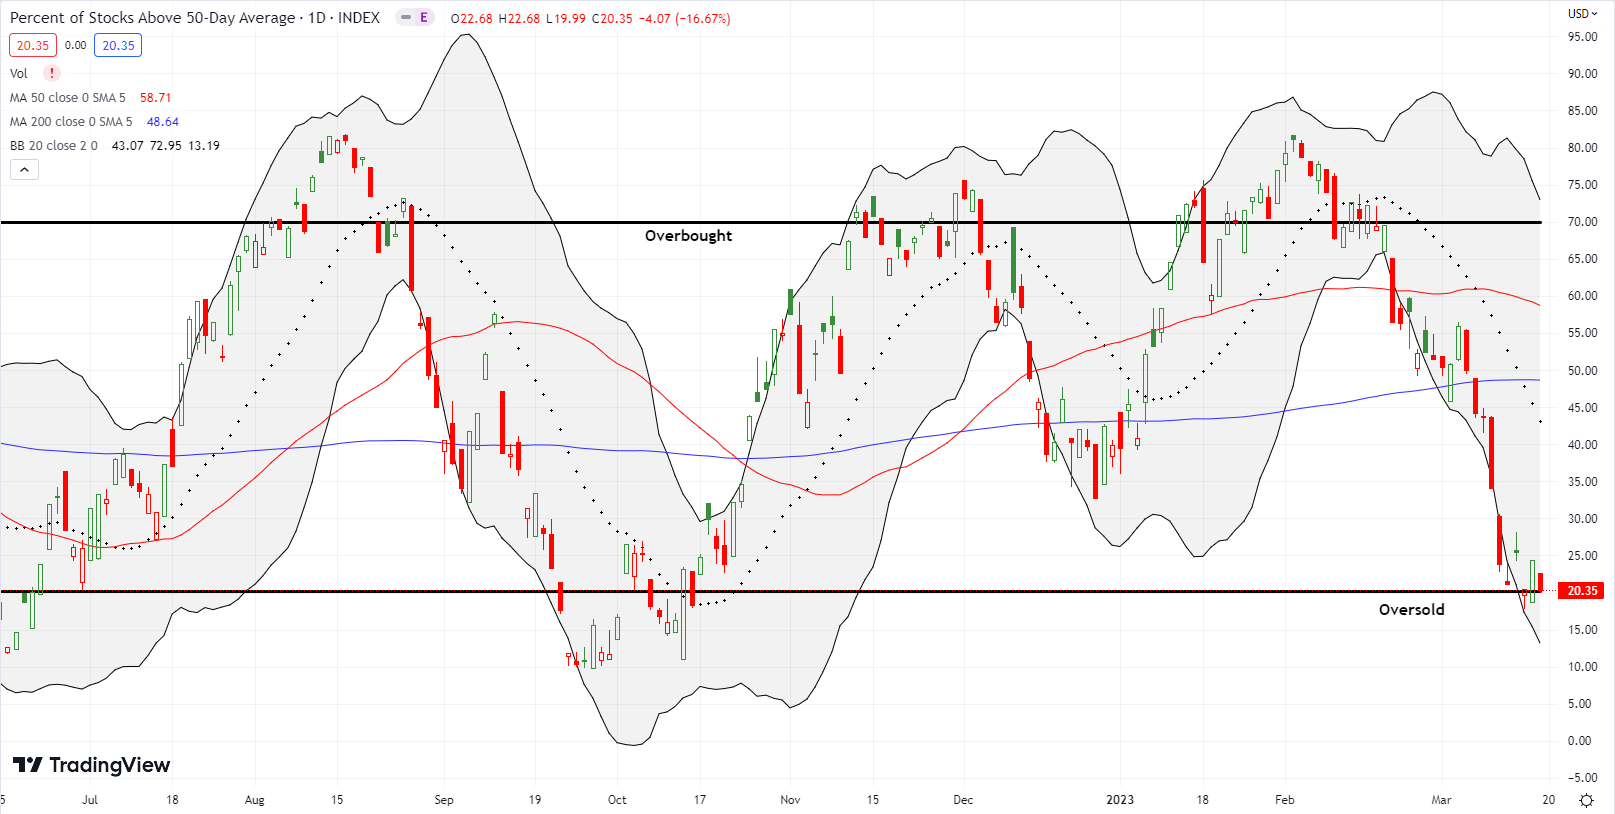
- AT50 (MMFI) = 20.4% of stocks are trading above their respective 50-day moving averages
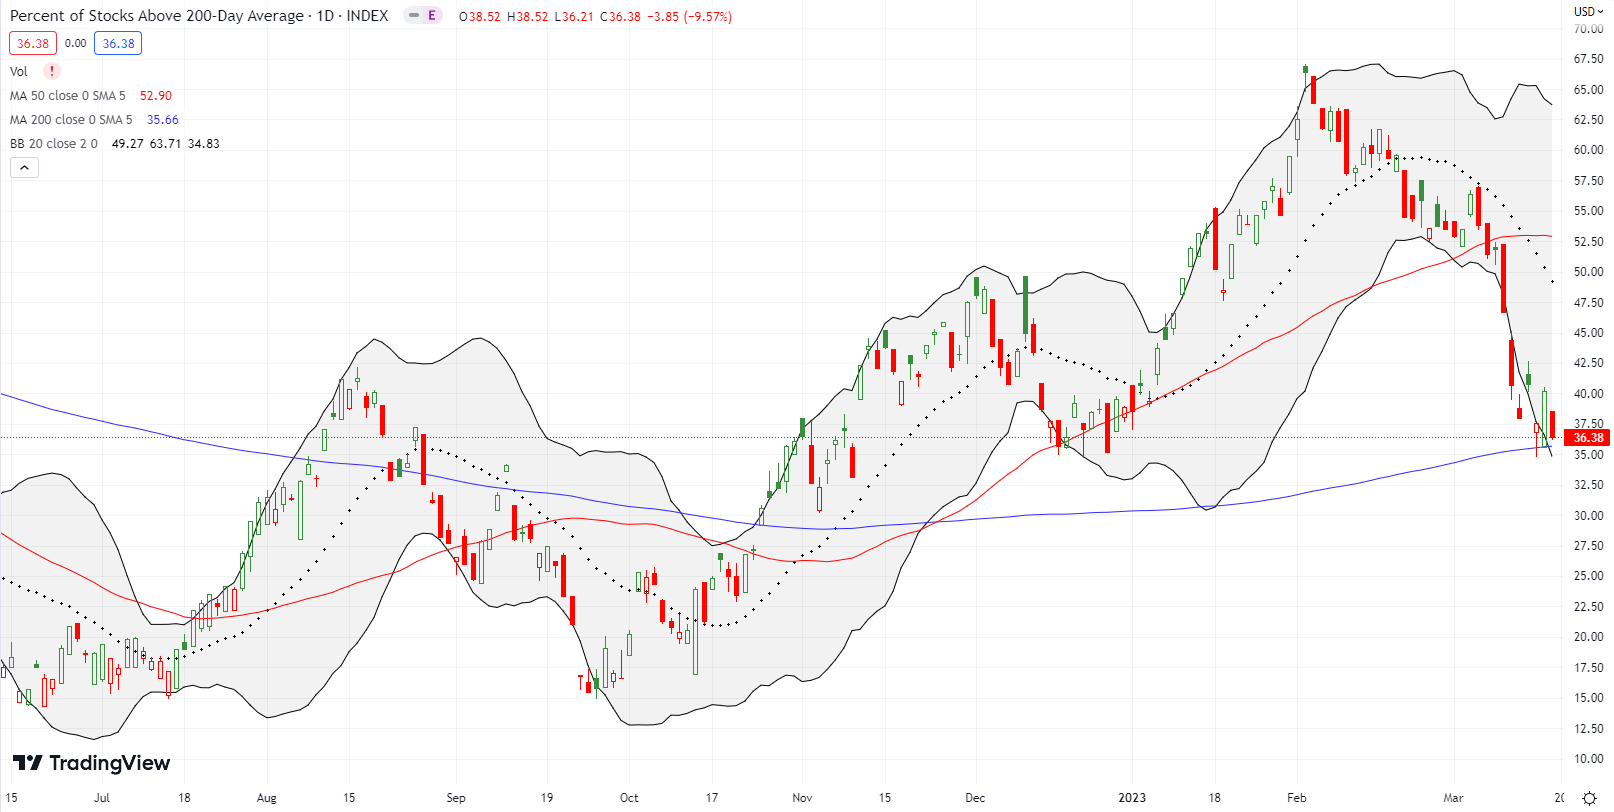
- AT200 (MMTH) = 36.4% of stocks are trading above their respective 200-day moving averages
- Short-term Trading Call: cautiously bullish
AT50 (MMFI), the percentage of stocks trading above their respective 50DMAs, stopped short of closing below the oversold threshold at 20%. My favorite technical indicator traded as low as 17.8 on Wednesday before buyers pushed AT50 above 20 in time for the close. I consider this trading action “close enough” to oversold to maintain a “cautiously bullish” short-term trading call. I plan to buy dips accompanied by spikes in the VIX. The profit window will likely remain narrow for such trades.
This oversold period has fascinating twists. The still growing and spreading banking crisis dramatically shifted traders and investors out of financials and into big cap tech stocks. At the same time, recession bets expanded with big drops in commodity-related stocks. This divergence complicates oversold trades. Once a pullback happens to the herd stampeding into big cap tech, the pricing dynamics could bleed into stocks currently oversold. Last week, I found success in flipping the most oversold parts of the market. The remaining half of my positions failed or faltered into the week’s close. My first foray into a regional bank, First Republic Bank (FRC), taught me to continue leaving individual banks alone for now! I interpreted the massive deposits from 11 major banks as an all-clear signal. I even rolled out what should have been a very conservative covered call position with the short call deep in the money.
Since I expect the Fed to get more dovish (at least in words) on Wednesday, I am looking at commodities as my next target for oversold trades.
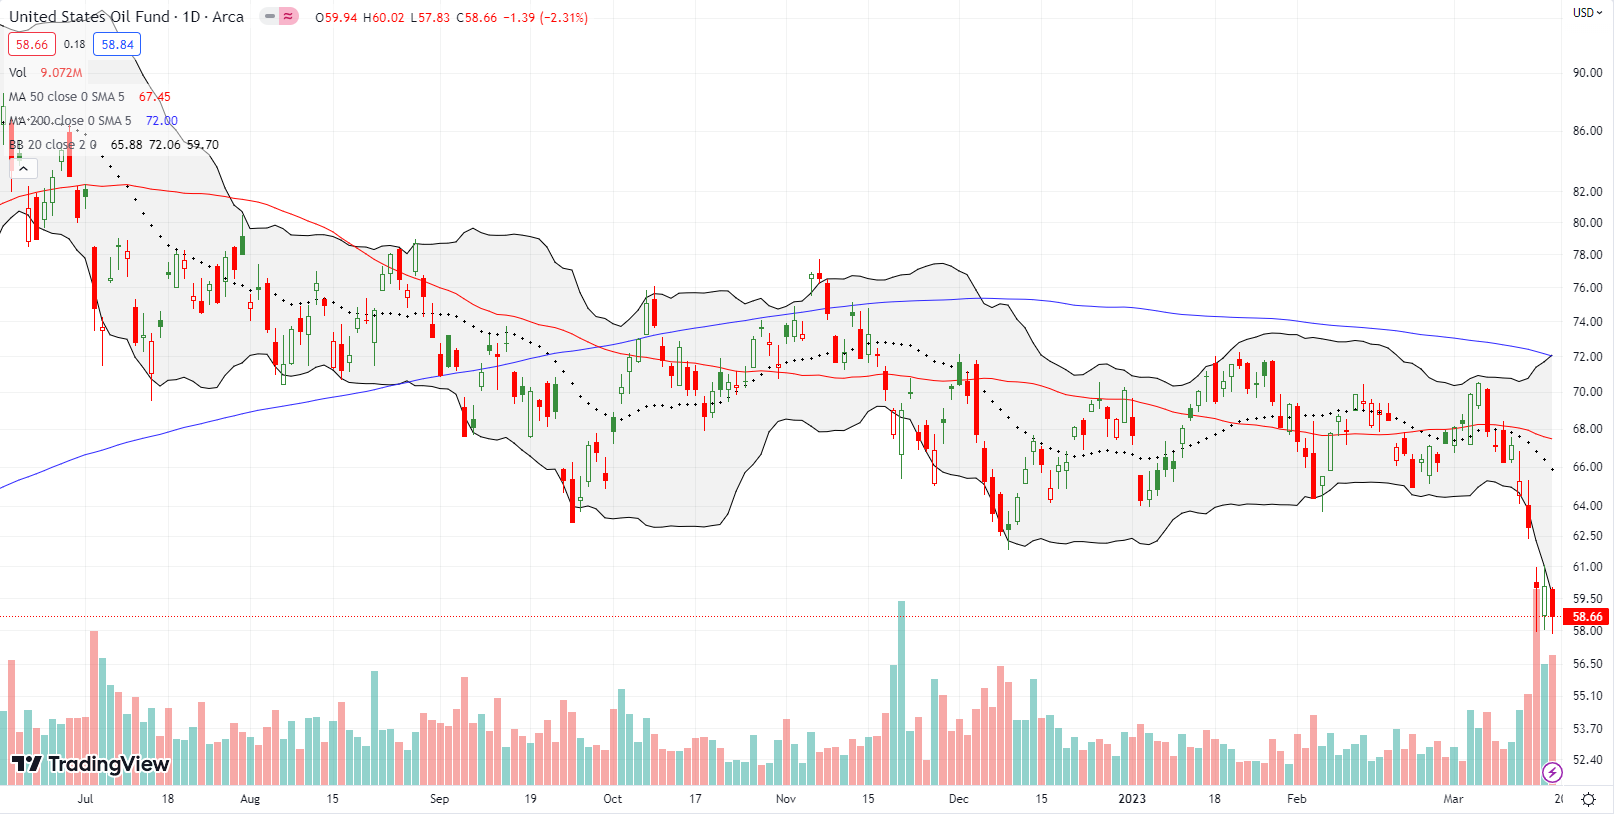
Speaking of commodities, the oil trade broke down last week. Four months ago, I noted the surprising pattern of a drop in oil prices every Monday. That pattern persists and has provided extended success for my trading strategy. However, last week’s plunge in commodities took the United States Oil Fund (USO) into a breakdown and 14-month low. This sell-off threatens the base of my trade in a long April $60 call option. I will need a rally in the next few weeks to salvage the rest of the trade. In the meantime, I went ahead and sold short a weekly call option one more time. I wanted to take advantage of inflated volatility levels.
Be careful out there!
Footnotes
Subscribe for free to get email notifications of future posts!
“Above the 50” (AT50) uses the percentage of stocks trading above their respective 50-day moving averages (DMAs) to measure breadth in the stock market. Breadth defines the distribution of participation in a rally or sell-off. As a result, AT50 identifies extremes in market sentiment that are likely to reverse. Above the 50 is my alternative name for “MMFI” which is a symbol TradingView.com and other chart vendors use for this breadth indicator. Learn more about AT50 on my Market Breadth Resource Page. AT200, or MMTH, measures the percentage of stocks trading above their respective 200DMAs.
Active AT50 (MMFI) periods: Day #105 over 20% (overperiod), Day #6 under 30% (underperiod), Day #7 under 40%, Day #9 under 50%, Day #19 under 60%, Day #21 under 70%
Source for charts unless otherwise noted: TradingView.com
Full disclosure: long QQQ put spread, long IWM call spread, long USO calendar call spread, long VXX call spread, long FRC
FOLLOW Dr. Duru’s commentary on financial markets via StockTwits, Twitter, and even Instagram!
*Charting notes: Stock prices are not adjusted for dividends. Candlestick charts use hollow bodies: open candles indicate a close higher than the open, filled candles indicate an open higher than the close.


